HAL Id: inserm-00484878
https://www.hal.inserm.fr/inserm-00484878
Submitted on 19 May 2010
HAL is a multi-disciplinary open access
archive for the deposit and dissemination of
sci-entific research documents, whether they are
pub-lished or not. The documents may come from
teaching and research institutions in France or
abroad, or from public or private research centers.
L’archive ouverte pluridisciplinaire HAL, est
destinée au dépôt et à la diffusion de documents
scientifiques de niveau recherche, publiés ou non,
émanant des établissements d’enseignement et de
recherche français ou étrangers, des laboratoires
publics ou privés.
A Multi-Volume Visualization Framework for Spatial
Aligned Volumes after 3D/3D Image Registration
Hui Tang, Jean-Louis Dillenseger, Xudong Bao, Li Min Luo
To cite this version:
Hui Tang, Jean-Louis Dillenseger, Xudong Bao, Li Min Luo. A Multi-Volume Visualization
Frame-work for Spatial Aligned Volumes after 3D/3D Image Registration. 1st International Conference
on Information Science and Engineering (ICISE), 2009, Dec 2010, Nanjing, China. pp.3571 - 3574,
�10.1109/ICISE.2009.77�. �inserm-00484878�
A multi-volume visualization framework for
spatial aligned volumes after 3D/3D image
registration*
Hui Tang1,3, Jean-Louis Dillenseger2,3, Xu Dong Bao1,3 and Li Min Luo1,3
1Laboratory of Image Science and Technology, Department of Computer Science and Engineering, Southeast University, 210096,
Nanjing, China
2INSERM U642, Laboratoire Traitement du Signal et de l’Image, Université de Rennes I, 35042 Rennes, France 3Centrede Recherche en Information Biomédicale Sino-Français (CRIBs)
Abstract: A new method for the visualization of spatial
aligned volumes after 3D/3D image registration is presented in this paper. This work aims at displaying the full information of the multi-volume in the same scene. First, we form a vectorial volume from the spatial aligned multi-volume. Then, a statistical vectorial volume classification method based on neighborhood weighted Gaussian mixture model is applied to analyze the vectorial volume and get material distribution information. Finally, several rendering techniques are adapted to visualize the parameters. We imply an application case: the visualization of preoperative kidney planning system to express our visualization method, but this method is not limited to the specific application case. According to the levels where the data intermixing occurs, our method mix the data at the earliest level so that it is called the acquisition level intermixing method.
Keywords: Direct volume rendering, medical imaging,
multi-volume rendering, scientific visualization, vectorial volume classification, 3D image registration.
1. Introduction
Within medical acquisitions, multiple images are often acquired from subjects at different times, and often with different imaging modalities. In order to bring the different acquisitions into the same space, many researchers did effect on the research of medical image registration [1-3]. Image registration is the process of overlaying two or more images of the same scene at different times, from different viewpoints, and/or by different sensors [2]. According to the image spatial dimensions, the registration can be divided into three cases: 2D/2D, 2D/3D and 3D/3D, in which most current papers focus on the 3D/3D registration of two images [1]. After the 3D/3D registration, we will get several spatial-aligned volumes. A combined presentation of registered volume datasets will give a better view of the
anatomical structures, so that a multi-volume visualization method will be discussed in this paper.
For the visualization of single volume, direct volume rendering convey an entire 3D dataset in a 2D image directly. There are many research concerned about direct volume rendering [4-6]. The process of constructing an image from a volumetric dataset using direct volume rendering can be summarized by the following steps [7]: data traversal, sampling, gradient computation, transfer function, shading and illumination, compositing.
Figure 1: Rendering pipeline for different intermixing levels Cai and Sakas [8] classified the multi-volume rendering methods according to the levels where the data
intermixing occurs. Three levels were defined: image level intermixing, composition level intermixing and illumination model level intermixing (Fig. 1). All these presented methods render the multi-volume by mixing the component volumes at one certain step of volume rendering pipeline. But actually, these volumes are different acquisitions taken from the same patient so that they are not independent. So that we can form a vectorial volume dataset, in which each voxel contains a vector of n elements corresponding to the information of the acquisitions (n is equal to the number of acquisitions). Then the analysis can be performed on this vectorial volume instead of several individual volumes. That is to say, the intermixing level can then occur before the rendering pipeline. We will call this level acquisition level intermixing (Fig. 1). This method is realized by the following steps: first form a vectorial volume from the multi-volume; then apply a statistical multi-dimensional classification method to get the material property information; finally render the multi-volume according to the classified material properties.
The rest of this paper is organized as follows. Section 2 expresses the proposed multi-volume rendering framework. The statistical vectorial volume classification method has been presented in our previous paper [9]. After classification, several rendering methods can be used to display the material information, which are discussed in section 3. We take an application case of the proposed multi-volume visualization method for detail expression in this section. Finally, the conclusions are given in Section 4.
2. Multi-volume rendering framework
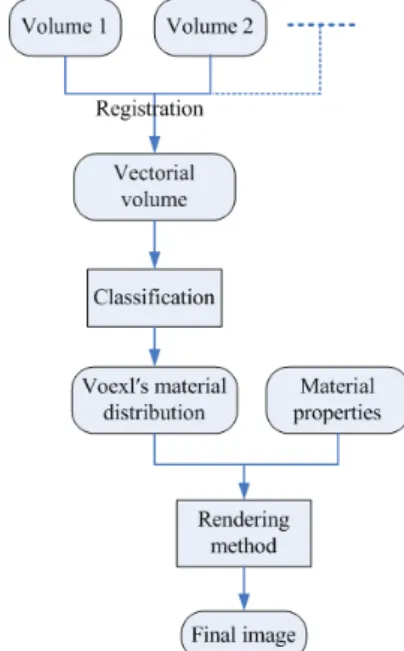
Based on the discussion in Section 1, we proposed a multi-volume rendering method which belongs to the acquisition level intermixing. The framework of this method is described in Fig. 2.
Figure 2: Multi-volume rendering pipeline
After registration, several volumes will be aligned into the same space. As analyzed before, the spatial aligned volumes can form a vectorial volume. If we analyze this vectorial volume instead of the individual volumes, the acquisitions can be taken into account at the same time. So that we propose to first perform analysis on this vectorial volume and then apply rendering techniques to show the analysis result parameters. Since the multi-volumes are mixed together at the beginning, according to the he levels where the data intermixing occurs, our method is called acquisition level intermixing. The intermixing step is realized by a neighborhood weighted mixture Gaussian classification method which has been presented in our previous paper [9].
3. Rendering methods
3.1. An application caseRenal cancer represents 2~3% of whole cancers and is the third most frequent in urologic cancer. If renal tumors are detected precociously, they are usually less than 4 cm so that a nephron sparring surgery can be considered through several methods like open or celioscopic surgery, even also radiofrequency treatments. In all of these cases the surgeon needs to establish his treatment planning and the first step of the kidney preoperative planning is to be aware about the anatomical structure of the patient’s kidneys.
The CT uroscan is the classical clinical preoperative examination. It consists of three to four time spaced 3D acquisitions, which give complementary information about the kidney anatomy. The first acquisition is realized without injection of contrast agent and informs the surgeon about intern morphology of the patient. Just after a contrast medium injection, one or two acquisitions are taken, which reveal the renal vascular systems and the renal parenchyma and also give information about the nature and the location of the renal carcinoma. About ten minutes later on the last acquisition the collecting system is enhanced. The 3D/3D registration of these acquisitions has been presented in our previous work [10].
After registration, according to the framework we proposed (Fig. 2), a vectorial volume is formed. The vectorial volume classification method based on the neighborhood weighted Gaussian mixture model is applied [9]. With the material distributions and the material properties, both surface rendering and volume rendering techniques can be expanded to the vectorial volume visualization in the acquisition level intermixing method.
3.2. Surface rendering method
For scalar volume, surface rendering techniques approximate a surface by some geometrical primitives, most commonly triangles, which can then be rendered using conventional graphics accelerator hardware. The Marching Cubes algorithm [11] was developed to
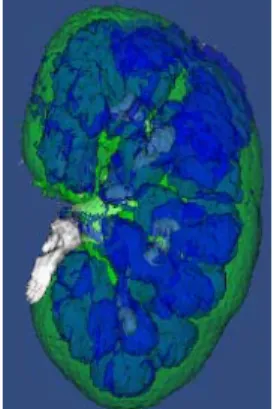
approximate an iso-valued surface with a triangle mesh. This surface extraction cannot be applied on the vectorial volume directly because the vectorial iso-value is difficult to define. But the class distributions we get after applying the vectorial classification method are relatively separated. Each material distribution can be treated as an independent volume. Each material distribution volume is closed to a binary volume with the value range [0, 1] (especially at the border) instead of always 1 in a binary volume. We can get the surfaces of each material and then render them in the same scene as multiple objects so that the materials can be merged in the final image (Fig. 3).
Figure 3: Merged scene rendered by semi-transparent surface rendering technique.
3.3. Volume rendering method
The input of this rendering pipeline is the material probabilities on each voxel and the material properties (color and opacity value) assigned by the user. The volume rendering method for visualizing the classified material information is expanded from scalar volume rendering method. The difference exists in gradient calculation and transfer function design.
For gradient calculation, Drebin et al. [12] proposed to form a density volume by assigning a density value to each material and then composing the densities weighted by the materials’ probabilities. A density characteristic
k
ρ is assigned for the kth material and then the density is formed by the following formula for each grid:
1 K k k k D pρ = =
∑
(1) We can see that the greater ρk is, the moreimportant the kth material is. If ρk equals to zero, the
kth material will disappear in the final image. The material opacity α has the similar effect: α = 1 implies that the material is completely opaque, and
0
α= implies that it is completely transparent so that we can use the opacity α to replace ρ to form the density volume. This replacement can reduce the input parameters of the rendering pipeline so that it can
simplify the user input because the two properties: opacity α and the density ρ can be confused. The formula is as follows: 1 K k k k D pα = =
∑
(2) The gradient of the sample point can be calculated from the density volume D with any scalar volume gradient calculation method.For transfer function design, according to the nature of the material probabilities, we proposed two methods: class decision method and composed color and opacity method.
Class decision method: For each sample point, we achieve a decision that the point belongs to one certain material and then assign the material color and opacity to the sample point for the final composition process. When we cast a ray into the volume, we calculate the first derivate along the ray. If the kth material probability volume gives the maximum first derivate, we select it as the class decision for the current sample position.
Composed color and opacity: Unlike the class decision method, the color and opacity for the sample position can be gotten from the material probabilities directly by multiplying the color and opacity assigned to that material by the probability of each material.
The rendering results with the two transfer function design method are shown in Fig. 4. On Fig. 4(a), we can see that the class decision method can better discriminate the different material; there is less color confusion in the rendering result. But the decision making process is a 0-1 procedure so the rendering results appear discrete. In contrast, on Fig. 4(b), the final result appears more continual because the boundaries are composed by two materials.
(a) (b)
Figure 4: Rendering results. (a): Class decision; (b): Composed color and opacity
4. Conclusions
With the development of 3D/3D medical image registration methods, more and more application meets the requirement of the visualization of spatial-aligned volumes. Most of the existing methods for multi-volume visualization are based on the intermixing of the volumes
at one certain step in the rendering pipeline. In this paper, we propose an acquisition level intermixing method, in which the intermixing step appears at the beginning of the rendering process.
First, the individual volumes are combined into a vector volume so that the analysis is performed on this vectorial volume instead of several separated scalar volumes. Based on the statistical vectorial volume classification method based on the Gaussian mixture model, in order to integrate more information into the classification process, we apply a neighborhood weighted method for the analysis of the vectorial volume. Then several rendering techniques are applied on the classification result. Both of the surface rendering and direct volume rendering techniques can be adapted to this situation. Two kinds of transfer design methods for direct volume rendering (class decision method and composed color and opacity) are implemented and compared. The rendering results of the two methods are given and the comparison of them is discussed.
References:
[1] J. B. Maintz and M. A. Viergever, "A survey of medical image registration," Med Image Anal, vol. 2, pp. 1-36, 1998.
[2] B. Zitova and J. Flusser, "Image registration methods: a survey," Image and Vision Computing, vol. 21, pp. 977-1000, 2003.
[3] D. L. Hill, P. G. Batchelor, M. Holden, and D. J. Hawkes, "Medical image registration," Phys Med Biol, vol. 46, pp. R1-45, 2001.
[4] A. Kaufman and K. Mueller, "Overview of
volume rendering," in The visualization Handbook, C. R. Johnson, C. D. Hansen, and C. R. Johnson, Eds.: Academic Press, 2004. [5] M. Levoy, "Display of surfaces from volume
data," IEEE Comp Graph & Appl, vol. 8, pp. 29-37, 1988.
[6] M. Levoy, "Efficient ray tracing of volume data," ACM Trans. on Graphics, vol. 9, pp. 245-261, 1990.
[7] M. Hadwiger, J. M. Kniss, C. Rezk-salama, D. Weiskopf, and K. Engel, Real-time volume graphics: A. K. Peters, Ltd., 2006.
[8] W. Cai and G. Sakas, "Data intermixing and multi-volume rendering," Computer Graphics Forum, vol. 18, pp. 359-368, 1999.
[9] H. Tang, J. L. Dillenseger, and L. M. Luo, "A vectorial image classification method based on neighborhood weighted Gaussian mixture model," presented at Conf of IEEE EMBS (EMBC'08), Vancouver, Canada, 2008.
[10] H. Tang, J. L. Dillenseger, and L. M. Luo, "Intra subject 3D/3D kidney registration using local mutual information maximization," presented at Conf of IEEE EMBS (EMBC'07), Lyon, France, 2007.
[11] W. E. Lorensen and H. E. Cline, "Marching cubes: a high resolution 3D surface reconstruction algorithm," Computer Graphics, vol. 21, pp. 163-169, 1987.
[12] R. A. Drebin, L. Carpenter, and P. Hanrahan, "Volume rendering," presented at SIGGRAPH'88, Atlanta, GA, 1988.
![Figure 1: Rendering pipeline for different intermixing levels Cai and Sakas [8] classified the multi-volume rendering methods according to the levels where the data](https://thumb-eu.123doks.com/thumbv2/123doknet/14211568.482026/2.892.475.798.624.1005/figure-rendering-pipeline-different-intermixing-classified-rendering-according.webp)