Publisher’s version / Version de l'éditeur:
Creep, Shrinkage and Durability Mechanics of Concrete and Concrete Structures: Proceedings of the 8th Int. Conference on Creep, Shrinkage and Durability
Mechanics of Concrete and Concrete Structures. Volume 1, pp. 349-355, 2008-09-30
READ THESE TERMS AND CONDITIONS CAREFULLY BEFORE USING THIS WEBSITE. https://nrc-publications.canada.ca/eng/copyright
Vous avez des questions? Nous pouvons vous aider. Pour communiquer directement avec un auteur, consultez la première page de la revue dans laquelle son article a été publié afin de trouver ses coordonnées. Si vous n’arrivez pas à les repérer, communiquez avec nous à [email protected].
Questions? Contact the NRC Publications Archive team at
[email protected]. If you wish to email the authors directly, please see the first page of the publication for their contact information.
NRC Publications Archive
Archives des publications du CNRC
This publication could be one of several versions: author’s original, accepted manuscript or the publisher’s version. / La version de cette publication peut être l’une des suivantes : la version prépublication de l’auteur, la version acceptée du manuscrit ou la version de l’éditeur.
Access and use of this website and the material on it are subject to the Terms and Conditions set forth at Early-age viscoelastic behavior of high performance concrete with internal curing
Cusson, D.
https://publications-cnrc.canada.ca/fra/droits
L’accès à ce site Web et l’utilisation de son contenu sont assujettis aux conditions présentées dans le site LISEZ CES CONDITIONS ATTENTIVEMENT AVANT D’UTILISER CE SITE WEB.
NRC Publications Record / Notice d'Archives des publications de CNRC: https://nrc-publications.canada.ca/eng/view/object/?id=db82f3f3-4354-419e-803d-0ae2460717d7 https://publications-cnrc.canada.ca/fra/voir/objet/?id=db82f3f3-4354-419e-803d-0ae2460717d7
http://irc.nrc-cnrc.gc.ca
E a r l y - a g e v i s c o e l a s t i c b e h a v i o r o f h i g h
p e r f o r m a n c e c o n c r e t e w i t h i n t e r n a l c u r i n g
N R C C - 5 0 4 4 3
C u s s o n , D .2 0 0 8 - 0 9 - 3 0
A version of this document is published in / Une version de ce document se trouve dans:
8th International Conference on Creep, Shrinkage and Durability of Concrete and Concrete Structures (CONCREEP8), Sept. 30-Oct. 2, 2008, .pp 1-6
The material in this document is covered by the provisions of the Copyright Act, by Canadian laws, policies, regulations and international agreements. Such provisions serve to identify the information source and, in specific instances, to prohibit reproduction of materials without written permission. For more information visit http://laws.justice.gc.ca/en/showtdm/cs/C-42
Les renseignements dans ce document sont protégés par la Loi sur le droit d'auteur, par les lois, les politiques et les règlements du Canada et des accords internationaux. Ces dispositions permettent d'identifier la source de l'information et, dans certains cas, d'interdire la copie de documents sans permission écrite. Pour obtenir de plus amples renseignements : http://lois.justice.gc.ca/fr/showtdm/cs/C-42
8th Intl. Conf. on Creep, Shrinkage and Durability of Concrete and Concrete Structures, Ise-Shima, Japan, Sept. 30 – Oct. 2, 2008
Early-age viscoelastic behavior of high performance concrete
with internal curing
D. Cusson
National Research Council Canada, Ottawa, Ontario, Canada
ABSTRACT: A new analytical approach to determine the ageing creep coefficient of high performance con-crete under restrained autogenous deformations is proposed. The results show that changes in creep coeffi-cient under variable stress conditions can be determined from time of setting. These changes were very high shortly after the setting time and decreased to very small changes by the age of two days. The early-age vis-coelastic behavior was also found to vary with the quantity of internal curing water provided in concrete through the use of presoaked lightweight aggregate for the prevention of self-desiccation. The early-age creep coefficients determined for high performance concrete under variable stress conditions were found to be more than 50% smaller than those predicted by existing creep models mainly developed from standard compressive creep tests on normal strength concrete. Predictions of developing concrete stresses using the creep coeffi-cients determined experimentally with the proposed approach agreed very well with measured stresses.
1 INTRODUCTION
The risk of early-age cracking in concrete structures is largely influenced by creep and shrinkage. Creep modifies the initial stress and strain patterns by in-creasing the load-induced deformations and relaxing the stresses due to imposed strains (Chiorino 2005). Concrete is an age-stiffening material that experi-ences shrinkage in any environment with a relative humidity below hygral equilibrium. Thus, autoge-nous shrinkage due to self-desiccation in low water-cement (w/c) high performance concrete (HPC) can be a problem. Existing creep models have been de-veloped on concrete with w/c between 0.4 and 0.6, most of which did not experience self-desiccation, as reported by Gardner & Lockman (2001).
Internal curing with saturated lightweight aggre-gate (LWA) was shown to reduce self-desiccation and autogenous shrinkage of HPC by providing ad-ditional water in concrete for an improved curing and a more complete cement hydration (RILEM TC-196, 2007). Although the benefits of internal curing for HPC structures have been evidenced in labora-tory studies (Weber & Reinhardt 1997) and field in-vestigations (Villarreal & Crocker 2007), the litera-ture offers very limited data on the visco-elastic behavior of low w/c HPC with internal curing.
This paper presents a new analytical approach to determine the basic creep coefficient of internally-cured HPC tested under restrained deformations, in-cluding initial expansion and shrinkage.
2 RESTRAINED SHRINKAGE TESTING
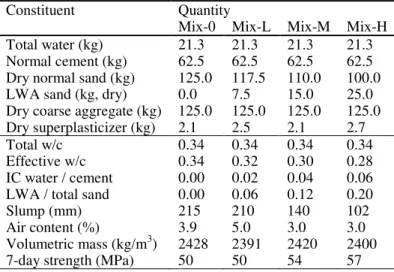
Four pairs of large-size HPC specimens were tested under free and restrained deformations. Four con-crete mix designs were evaluated, including one ref-erence concrete (Mix-0) with no internal curing, and three similar concretes with different levels of inter-nal curing, namely Mix-L, Mix-M and Mix-H with low, medium and high contents of pre-soaked LWA, respectively (Table 1). This was achieved by replac-ing part of the normal-density sand with pre-soaked lightweight aggregate sand (e.g. expanded shale with a water absorption capacity of 15%). In this study, each concrete mix design had 450 kg/m3 of normal cement and a total water-cement ratio of 0.34.
T
able 1. Concrete mix formulations and properties. Constituent Quantity
Mix-0 Mix-L Mix-M Mix-H Total water (kg)
Normal cement (kg) Dry normal sand (kg) LWA sand (kg, dry) Dry coarse aggregate (kg) Dry superplasticizer (kg) 21.3 62.5 125.0 0.0 125.0 2.1 21.3 62.5 117.5 7.5 125.0 2.5 21.3 62.5 110.0 15.0 125.0 2.1 21.3 62.5 100.0 25.0 125.0 2.7 Total w/c Effective w/c IC water / cement LWA / total sand Slump (mm) Air content (%)
Volumetric mass (kg/m3) 7-day strength (MPa)
0.34 0.34 0.00 0.00 215 3.9 2428 50 0.34 0.32 0.02 0.06 210 5.0 2391 50 0.34 0.30 0.04 0.12 140 3.0 2420 54 0.34 0.28 0.06 0.20 102 3.0 2400 57 1
-8th Intl. Conf. on Creep, Shrinkage and Durability of Concrete and Concrete Structures, Ise-Shima, Japan, Sept. 30 – Oct. 2, 2008
1 INTRODUCTION
The risk of early-age cracking in concrete structures is largely influenced by creep and shrinkage. Creep modifies the initial stress and strain patterns by in-creasing the load-induced deformations and relaxing the stresses due to imposed strains (Chiorino 2005). Concrete is an age-stiffening material that expe-riences shrinkage in any environment with a relative humidity below hygral equilibrium. Thus, autogen-ous shrinkage due to self-desiccation in low water-cement (w/c) high performance concrete (HPC) can be a problem. Existing creep models have been de-veloped on concrete with w/c between 0.4 and 0.6, most of which did not experience self-desiccation, as reported by Gardner & Lockman (2001).
Internal curing with saturated lightweight aggre-gate (LWA) was shown to reduce self-desiccation and autogenous shrinkage of HPC by providing ad-ditional water in concrete for an improved curing and a more complete cement hydration (RILEM TC-196, 2007). Although the benefits of internal curing for HPC structures have been evidenced in laborato-ry studies (Weber & Reinhardt 1997) and field in-vestigations (Villarreal & Crocker 2007), the litera-ture offers very limited data on the visco-elastic behavior of low w/c HPC with internal curing.
This paper presents a new analytical approach to determine the basic creep coefficient of internally-cured HPC tested under restrained deformations, in-cluding initial expansion and shrinkage.
2 RESTRAINED SHRINKAGE TESTING
Four pairs of large-size HPC specimens were tested under free and restrained deformations. Four con-crete mix designs were evaluated, including one ref-erence concrete (Mix-0) with no internal curing, and three similar concretes with different levels of inter-nal curing, namely Mix-L, Mix-M and Mix-H with low, medium and high contents of pre-soaked LWA, respectively (Table 1). This was achieved by replac-ing part of the normal-density sand with pre-soaked lightweight aggregate sand (e.g. expanded shale with a water absorption capacity of 15%). In this study, each concrete mix design had 450 kg/m3 of normal cement and a total water-cement ratio of 0.34.
Table 1. Concrete mix formulations and properties.
Early-age viscoelastic behavior of high performance concrete
with internal curing
D. Cusson
National Research Council Canada, Ottawa, Ontario, Canada
ABSTRACT: A new analytical approach to determine the ageing creep coefficient of high performance con-crete under restrained autogenous deformations is proposed. The results show that changes in creep coeffi-cient under variable stress conditions can be determined from time of setting. These changes were very high shortly after the setting time and decreased to very small changes by the age of two days. The early-age vis-coelastic behavior was also found to vary with the quantity of internal curing water provided in concrete through the use of presoaked lightweight aggregate for the prevention of self-desiccation. The early-age creep coefficients determined for high performance concrete under variable stress conditions were found to be more than 50% smaller than those predicted by existing creep models mainly developed from standard compressive creep tests on normal strength concrete. Predictions of developing concrete stresses using the creep coeffi-cients determined experimentally with the proposed approach agreed very well with measured stresses.
Constituent Quantity
Mix-0 Mix-L Mix-M Mix-H Total water (kg)
Normal cement (kg) Dry normal sand (kg) LWA sand (kg, dry) Dry coarse aggregate (kg) Dry superplasticizer (kg) 21.3 62.5 125.0 0.0 125.0 2.1 21.3 62.5 117.5 7.5 125.0 2.5 21.3 62.5 110.0 15.0 125.0 2.1 21.3 62.5 100.0 25.0 125.0 2.7 Total w/c Effective w/c IC water / cement LWA / total sand Slump (mm) Air content (%)
Volumetric mass (kg/m3) 7-day strength (MPa)
0.34 0.34 0.00 0.00 215 3.9 2428 50 0.34 0.32 0.02 0.06 210 5.0 2391 50 0.34 0.30 0.04 0.12 140 3.0 2420 54 0.34 0.28 0.06 0.20 102 3.0 2400 57
- 2 - For each of the four HPC mix designs, two large-size prismatic concrete specimens (200 x 200 x 1000 mm) were prepared from the same concrete batch. Within each pair of concrete specimens, one was tested under restrained shrinkage and the other com-panion specimen was tested under free shrinkage. The eight concrete specimens were sealed with plas-tic sheets to prevent external drying shrinkage, and were tested under an ambient air temperature be-tween 20°C and 25°C. More detailed information can be found in Cusson & Hoogeveen (2008).
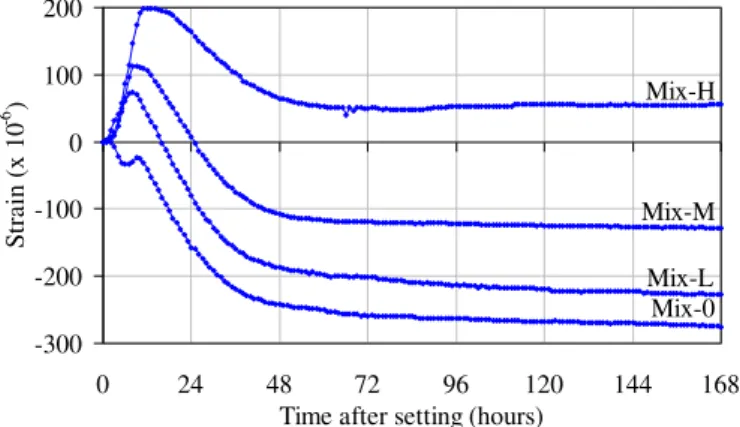
Figure 1 presents the total strain measured for a period of seven days in each unrestrained concrete specimen. This measurement included autogenous shrinkage and thermal strains. It can be readily seen that the addition of pre-soaked LWA for internal curing allowed early-age expansion to occur, which was due to autogenous swelling and thermal expan-sion, with peaks observed between 8 to 12 hours of age. The extent of expansion increased with the quantity of pre-soaked LWA used in the concrete. Mix-H was the only concrete producing positive values of total strain after the first day until the end of testing at 7 days. -300 -200 -100 0 100 200 0 24 48 72 96 120 144 168 Time after setting (hours)
S tra in (x 10 -6 ) Mix-H Mix-M Mix-L Mix-0
Figure 1. Total strains measured in unrestrained specimens.
The elastic strain developing over time was also determined experimentally for each of the four specimens tested under restrained shrinkage (Cusson & Hoogeveen 2008). In order to find the creep strain (cr) as a function of time after setting (t), increments
of creep strain (cr) produced over a single time
in-crement (t) were obtained as follows (assuming compatibility of strains): ) ( ) ( ) ( ) (t t t el t F tot R tot cr (1)
t i i cr cr t t 0 ) ( ) ( (2)where totR is the increment of total strain in the re-strained concrete specimen (which is zero only un-der full restraint); totF is the increment of total strain in the unrestrained specimen (which includes non stress-induced strains due to swelling, shrinkage and thermal effects); and el is the increment of
elastic strain obtained during the experiments. For example, Figure 2 presents the elastic and creep strains obtained for Mix-H concrete specimen.
-250 -200 -150 -100 -50 0 50 100 0 24 48 72 96 120 144 168 Time after setting (hours)
S tra in (x 10 -6 ) Creep strain Elastic strain
Gain in compressive creep due to restrained expansion Gain in tensile creep due to restrained shrinkage
Mix-H
Figure 2. Measured elastic and creep strains for Mix-H.
3 DETERMINATION OF CREEP COEFFICIENT 3.1 Pure creep or restrained shrinkage condition Under a constant stress, the elastic strain is also con-stant and the creep coefficient () of concrete can be calculated as follows (CEB 1993; ACI 209, 1992):
) ( ) , ( ) , ( 0 o el o cr t t t t t (3)
where cr is the creep strain measured at time t; and
el is the elastic strain applied at time of loading to.
Under restrained shrinkage, the elastic strain gradually increases over time, and the conventional definition of the creep coefficient (Eq. 3) cannot be used. In this case, the following definition was pro-posed by Kovler (1994): ) ( ) ( ) ( ) ( t t t t el cr (4)
where is the ageing factor, which accounts for the fact that el is not constant but applied gradually. For
simplicity, engineers have often used a constant value of 0.8 as an approximation (CEB 1993). In this paper, reference to the ageing creep coefficient as will imply that the effect of is included.
3.2 Restrained expansion/shrinkage condition In the more general case of restrained expansion fol-lowed by restrained shrinkage, the elastic strain changes over time and can be negative (compres-sive) under restrained expansion and positive (ten-sile) under restrained shrinkage. As shown in Figure 2, under an initial restrained expansion, the negative elastic strain produced an increase in compressive creep strain. The compressive creep strain reached a peak value of –190 x 10-6 when the elastic strain re-duced to zero before changing into a restrained shrinkage mode.
As the tensile elastic strain increased (or re-mained in the positive range), positive increments of creep strain were produced and resulted in less nega-tive values of creep strain (e.g. –90 x 10-6 at 7 days). In this case, Equation 4 does not apply and will re-sult in negative values of ageing creep coefficient af-ter the stress reversal from compression to tension.
In order to determine the ageing creep coefficient in this case, it is proposed to define the increment of ageing creep coefficient () as follows:
) ( ) ( ) ( t t t el cr (5)
where cr is the increment of creep strain at time t
produced by the full elastic strain (el) applied at
time t. With Equation 5, the signs of cr and el will
always match, resulting in a gradually increasing ageing creep coefficient over time, which can then be determined incrementally as follows:
t t i i o o t t t, ) ( ) ( (6)Substituting Equation 5 into Equation 1, and tak-ing cr(t) = cr(t) –cr(t-t), the elastic strain
ap-plied at time t was found to be:
) ( 1 ) ( ) ( ) ( ) ( t t t t t t cr F tot R tot el (7)
which can be solved using an incremental procedure. In Eq. 7, was determined experimentally by con-ducting a linear regression analysis on the test data. For this, the following power equation was used:
B t A
t
)( (8)
where A and B are best-fit parameters determined by minimising the sum of absolute differences between the experimental values of creep strain and the fitted values of creep strain obtained by using the mod-elled values of elastic strain (Eq. 7) into Equations 1-2. Figure 3 presents the measured and best-fit creep strains obtained for the tested HPC specimens.
-200 -150 -100 -50 0 50 100 150 0 24 48 72 96 120 144 168 Time after setting (hours)
S tra in (x 10 -6 ) Mix-H Mix-M Mix-L Mix-0
Measured creep strain Best fit creep strain
Figure 3. Measured and best-fit creep strains.
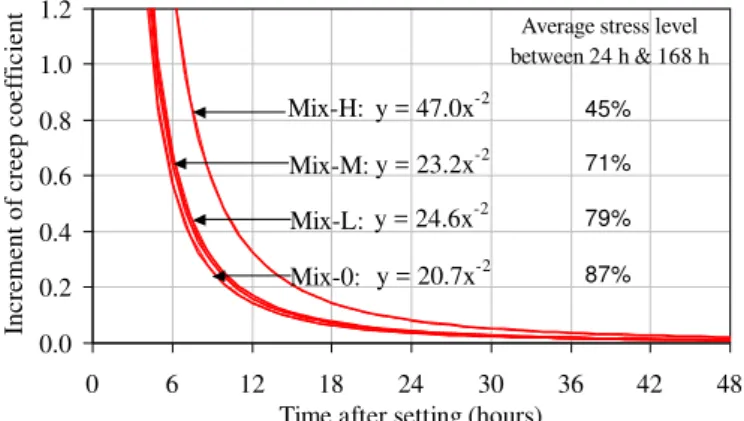
The resulting best-fit curves for the increments of creep coefficient () as a function of time are illus-trated in Fig. 4 for the different concrete specimens. As expected, it can be observed that the increments of ageing creep coefficient can be very large at very early ages and very small after an age of two days (at which time the elastic modulus of concrete reached 90% to 95% of its ultimate value). Ozawa & Morimoto (2002) also found major differences in creep coefficients measured for loading times before and after the age of 2 days.
y = 47.0x-2 y = 24.6x-2 y = 20.7x-2 y = 23.2x-2 0.0 0.2 0.4 0.6 0.8 1.0 1.2 0 6 12 18 24 30 36 42 48
Time after setting (hours)
Inc re m e nt of c re e p c oe ffi c ie nt Mix-H: Mix-M: Mix-L: Mix-0: 71% 45% 79% 87% Average stress level between 24 h & 168 h
Figure 4. Best-fit increments of ageing creep coefficient.
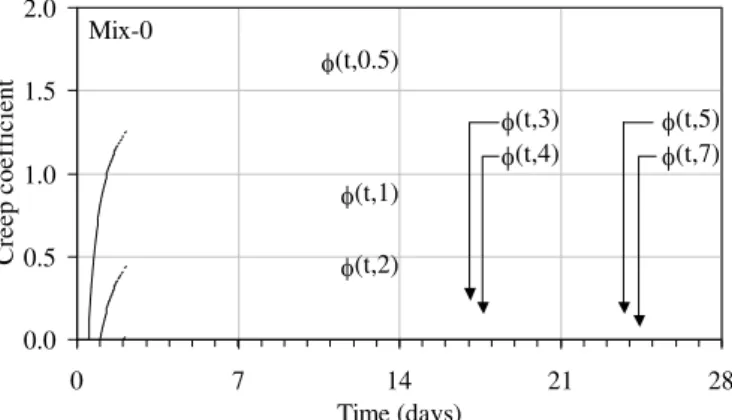
Using Eq. 6 () and the empirical relationships shown in Fig. 4 (), the ageing creep coefficients were determined as functions of time after setting (t) for 28 days and for arbitrary loading times of 0.5, 1, 2, 3, 4, 5, and 7 days. It is interesting to note that this approach only requires one set of specimens to ob-tain (t,to) corresponding to different loading ages.
Figures 5-8 present the obtained ageing creep co-efficients for the four HPC specimens, respectively. It can be observed that the ageing creep coefficients at very early ages increased very rapidly, especially when the loading ages were 0.5 day and 1 day. This effect is even stronger for Mix-H specimen as shown in Figure 8, where a high value of 3.7 was found for (28,0.5), compared to 1.6 for the reference concrete specimen with no internal curing.
The 28-day values of ageing creep coefficient re-ported in Figures 5-8 are not ultimate values, but could be considered as being close to ultimate values since the slopes of the curves at the age of 28 days are very small and because drying creep in this study can be considered negligible due to the sealed condi-tion used during testing. Reported ultimate values of creep coefficient varied from 0.92 to 2.46 for high-strength concrete (Huo et al. 2001), and from 1.3 to 4.2 for normal strength concrete (ACI 209, 1992). Note that these reported values are mostly represent-ative of concrete specimens tested under drying con-ditions and loaded with a constant compressive force at the age of 7 days, which makes the comparison with the present test results difficult.
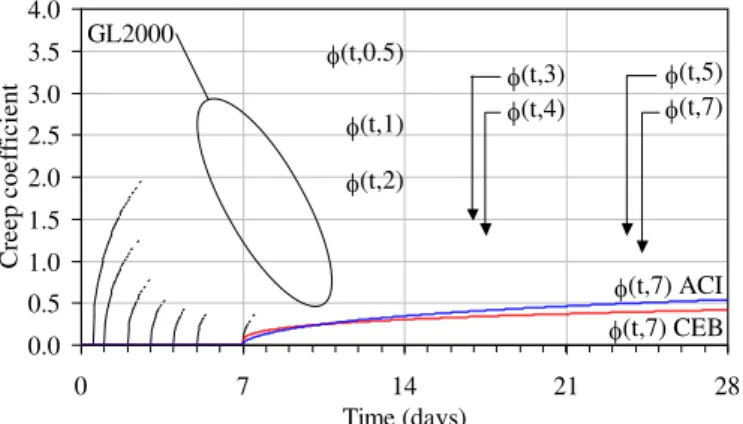
- 4 - In order to compare the results of this study, three established creep models were used to predict the creep coefficient for the HPC specimens. They are the GL2000 model developed by Garder & Lockman (2001), the ACI 209 (1992) model, and the CEB MC90 (1993) model. In order to simulate the test conditions used in this study, a concrete relative hu-midity of 96% (sealed curing) and a 28-day concrete strength of 60 MPa were assumed in these creep models. Figure 9 presents the creep coefficients pre-dicted by the GL2000 for loading times of 0.5, 1, 2, 3, 4, 5 and 7 days, and those predicted by the ACI and CEB models for a 7-day loading time.
When comparing the experimental results in Fig-ures 5-8 with the predicted values of creep coeffi-cient in Figure 9, one can observe some similarities and several differences in the 28-day values of creep coefficient and in its development rate. For instance, for the very early loading times of 0.5 day and 1 day, the time development of for Mix-H specimen is similar to the predictions of the GL2000 model. For loading times equal to or greater than 2 days, the creep coefficients for the four HPC specimens are more than 50% smaller than the predictions from the GL2000 model. The same observation applies when comparing the experimental values of the creep coefficient with the predictions obtained using the ACI and CEB models for a loading time of 7 days.
These differences can be attributed to factors like loading/curing conditions, and concrete mix design.
0.0 0.5 1.0 1.5 2.0 0 7 14 21 28 Time (days) Cre e p c oe ffi c ie nt (t,0.5) (t,1) (t,2) (t,3) (t,4) (t,5) (t,7) Mix-0
Figure 5. Ageing creep coefficients for Mix-0 specimen.
0.0 0.5 1.0 1.5 2.0 0 7 14 21 28 Time (days) Cre e p c oe ffi c ie nt (t,0.5) (t,1) (t,2) (t,3) (t,4) (t,5) (t,7) Mix-L
Figure 6. Ageing creep coefficients for Mix-L specimen.
For instance, the existing creep models were based on large sets of results, most of which were obtained from compressive creep testing of normal strength concrete under drying conditions.
In the present study, the elastic strain was applied gradually under restrained expansion (compressive creep/relaxation) for less than a day and then under restrained shrinkage (tensile creep/relaxation) for the remaining time. Under nearly full restraint condi-tions, the elastic strain reached values near the ulti-mate strain capacity of the concrete, which is differ-ent from standard creep testing, in which the specimens are usually loaded to 40% (or less) of the available concrete strength. In reality, creep of con-crete is a non-linear phenomenon (CEB 1993). Non-linearity with respect to creep may be observed in experiments where the sustained stress is higher than 40% of concrete strength, or in experiments with va-riable stress history.
Sealed curing and different levels of internal cur-ing were used in this study, thus eliminatcur-ing the component of drying creep. Also, most of the con-crete specimens tested for creep in the literature had water-cement ratios between 0.40 and 0.60. Conse-quently, the existing creep models cannot capture the effect of self-desiccation in low water-cement high-strength concrete.
In light of the above, the good agreement of the measured creep coefficients for Mix-H concrete at the 0.5-day loading age may be explained by: (i) very effective internal curing, which prevented self-
0.0 0.5 1.0 1.5 2.0 0 7 14 21 28 Time (days) Cre e p c oe ffi c ie nt (t,0.5) (t,1) (t,2) (t,3) (t,4) (t,5) (t,7) Mix-M
Figure 7. Ageing creep coefficients for Mix-M specimen.
0.0 0.5 1.0 1.5 2.0 2.5 3.0 3.5 4.0 0 7 14 21 28 Time (days) Cre e p c oe ffi c ie nt (t,0.5) (t,1) (t,2) (t,3) (t,4) (t,5) (t,7) Mix-H
0.0 0.5 1.0 1.5 2.0 2.5 3.0 3.5 4.0 0 7 14 21 28 Time (days) Cre e p c oe ffi c ie nt (t,0.5) (t,1) (t,2) (t,3) (t,4) (t,5) (t,7) (t,7) ACI (t,7) CEB GL2000
Figure 9. Predicted creep coefficients from existing models.
desiccation at early ages as the measured internal concrete RH remained above 96% for the seven days of testing; and (ii) the lower average applied stress level of 0.45, which is not far from the 40% limit, under which creep strains are assumed to be propor-tional to sustained stresses (ACI 1992, CEB 1993).
4 PREDICTION OF CONCRETE STRESSES Using the proposed calculation approach, the con-crete stress (c) in the HPC specimens resulting
from restrained expansion/shrinkage was simply cal-culated as follows: ) ( ) ( ) (t Ec t el t c (9) -2 -1 0 1 2 3 4 0 24 48 72 96 120 144 168
Time after setting (hours)
S tre ss (M P a ) Mix-0
+++++ Measured concrete stress Prediction with present approach Prediction with CEB MC90 approach
Figure 10. Stress predictions for Mix-0 concrete specimen.
-2 -1 0 1 2 3 4 0 24 48 72 96 120 144 168
Time after setting (hours)
S tre ss (M P a ) Mix-L
+++++ Measured concrete stress Prediction with present approach Prediction with CEB MC90 approach
Figure 11. Stress predictions for Mix-L concrete specimen.
where Ec is the concrete modulus of elasticity at age t; and el is the elastic strain calculated at age t with
the proposed Equation 7.
In order to verify the validity of the present ap-proach (i.e. using Equations 5-9), the conventional approach suggested by CEB (1993) was also used to determine the concrete stress developing over time in the four HPC specimens as a result of restrained expansion/shrinkage. Considering that concrete complies with the theory of linear visco-elasticity of ageing materials (Bažant 1975, 1995), the following equations based on the principle of superposition were used (CEB 1993):
) ( ) , ( ) , ( R tot t t o Rt d t t o
(10) ) , ( ) ( ) ( / ) , ( 1 ) ( ) , ( o o o c c o o c o t t t t E E t t t E t t R (11) where R is the relaxation function, which represents the axial stress produced at time t by a constant unit strain applied at time toEc(to) is the concretemod-ulus of elasticity at time to; Ec is the concrete
mod-ulus of elasticity at 28 days; is the concrete ageing coefficient (set to 0.8); and is the creep coefficient, which was obtained experimentally for the HPC specimens using the proposed approach (Figures 5-8). Equation 10 was numerically solved using an in-cremental procedure. -2 -1 0 1 2 3 4 0 24 48 72 96 120 144 168
Time after setting (hours)
S tre ss (M P a ) Mix-M
+++++ Measured concrete stress Prediction with present approach Prediction with CEB MC90 approach
Figure 12. Stress predictions for Mix-M concrete specimen.
-2 -1 0 1 2 3 4 0 24 48 72 96 120 144 168
Time after setting (hours)
S tre ss (M P a ) Mix-H
+++++ Measured concrete stress Prediction with present approach Prediction with CEB MC90 approach
- 6 - The stress predictions from both the proposed and conventional approaches are compared to the expe-rimental stress results for the four HPC specimens in Figures 10-13. Both stress calculation approaches (using the same sets of creep coefficients) provided nearly identical stress predictions over the 7-day test period. The predictions also agreed very well with the test results for the HPC specimens. It is noted that the CEB approach, assuming linear viscoelastic-ity, also provided excellent stress predictions for specimens tested under high stress levels. This is be-cause the relations for the creep coefficient incre-ment (Fig. 4) captured the nonlinear creep effects.
For Mix-L and Mix-M, it can be observed that the very early age compressive stresses were slightly overestimated during the restrained expansion phase, which occurred within the first 12 hours after set-ting. This may be explained by the fact that the li-near regression analysis of the creep data was con-ducted on the entire set of data obtained from time of setting to the age of 7 days, as opposed to per-forming the analysis in two separate steps (i.e. re-strained expansion vs. rere-strained shrinkage). Never-theless, the predictions of the present approach using the best-fit relations shown in Fig. 4 agreed nicely with the experimental values of creep coefficient.
5 SUMMARY AND CONCLUSIONS
A new analytical approach is suggested to determine the ageing creep coefficient of low water-cement high performance concrete under uniaxially re-strained autogenous deformations, including initial expansion followed by shrinkage. The following conclusions can be drawn from this study:
1. Determining creep coefficient under restrained shrinkage with the present approach requires one set of specimens to obtain (t,0), and all subsets (t,to), for a given concrete and environment.
2. The increments of creep coefficient under vari-able stress conditions were determined from the time of setting, showing very high creep rates shortly after setting compared to later ages (two days), after which time the creep rates were found to be very small (drying prevented). 3. Increasing levels of internal curing in HPC
re-sulted in larger compressive creep developing at early ages due to larger restrained expansion, which is excellent for reducing the cracking risk. 4. The creep coefficients of HPC determined under
the present test conditions (i.e. restrained auto-genous deformations, high stress levels, internal curing) were found to be more than 50% smaller than those predicted from existing creep models (GL2000, ACI, CEB) that are mainly based on compressive creep test results from normal strength concrete specimens.
5. Predictions of developing concrete stresses in the HPC specimens using the creep coefficients de-termined with the proposed approach agreed well with measured concrete stresses.
6. Predictions of concrete stresses with the pro-posed simple approach were nearly identical to those obtained with the conventional CEB model, when both approaches used the experi-mentally determined creep coefficients, which also captured the nonlinear creep effects.
ACKNOWLEDGEMENTS
The author would like to acknowledge the contribu-tion of Ted Hoogeveen of NRC for the conduct of the laboratory experiments.
REFERENCES
ACI 209 “Prediction of creep, shrinkage, and temperature ef-fects in concrete structures”, ACI Report 209R-92, Detroit, 1992, 47 p.
Bažant, Z.P. “Theory of Creep and Shrinkage in Concrete Structures: a Précis of Recent Developments”, Mechanics
Today, Vol. 2, Peragon Press, 1975, 1-93.
Bažant, Z.P. & Baweja, S. “Creep and Shrinkage Prediction for Analysis and Design of Concrete Structures – Model B3”,
Materials and Structures, RILEM, Paris, V.28, 1995,
357-365, 415-430, 488-495.
CEB “CEB-FIP Model Code 1990”, Information Bulletin No. 213/214, Euro-International Concrete Committee, Lausanne, 1993, 437 p.
Chiorino, M.A. “A Rational Approach to the Analysis of Struc-tural Effects due to Creep”, in: Shrinkage and Creep of Concrete, ACI SP-227, Edited by N.J. Gardner and J. Weiss, 2005, 107-142.
Cusson, D., Hoogeveen T. “Internal curing of high-performance concrete with pre-soaked fine lightweight ag-gregate for prevention of autogenous shrinkage cracking”,
Cement and Concrete Research, 38(6), 2008, 757-765.
Gardner, N.J. & Lockman, M.J. “Design Provisions for Drying Shrinkage and Creep of Normal Strength Concrete, ACI Materials Journal, 98(2), March-April 2001, 159-167. Huo, X.S., Al-Omaishi, N. & Tadros, M.K. “Creep, Shrinkage
and Modulus of Elasticity of High-Performance Concrete”, ACI Materials Journal, 98(6), Nov.-Dec. 2001, 440-449. Kovler, K. “Testing system for determining mechanical
behav-iour of early-age concrete under restrained and free uniaxial shrinkage”, Materials & Structures, 27, 1994, 324-330. Ozawa, M. & Morimoto, H. “Evaluation of Creep of
High-Strength Concrete at Early Ages”, Control of Cracking in
Early Age Concrete, Mihashi and Wittmann (Eds.), Swets
& Zeitlinger, Lisse, 255-264.
RILEM TC-196 “Internal curing of concrete”, State-of-the-art
Report of RILEM Technical Committee 196-ICC, Edited by
K. Kovler & O.M. Jensen, RILEM Publications S.A.R.L., Bagneux, France, 2007, 139 p.
Villarreal, V.H. & Crocker, D.A. “Better pavements through internal hydration”, Concrete International, February 2007, pp. 32-36.
Weber, S. & Reinhardt, H.W. “A New Generation of High Performance Concrete: Concrete with Autogenous Curing”, Advanced Cement Based Materials 6(2), 1997, 59-68.