Assessment of Potential
Opportunities for
Use of Digital Payments for
Smallholder Farmers in
Northern and Central Senegal
MIT D-Lab
Comprehensive Initiative on Technology Evaluation
Massachusetts Institute of Technology
About USAID
The United States Agency for International Development (
USAID)
is a leading international
devel-opment agency and a catalytic actor driving develdevel-opment results.
The
USAID Center for Digital Development
(CDD) works to address gaps in digital access and
af-fordability and to advance the use of technology and advanced data analysis in development. CDD
pursues this mission by: 1) supporting the enabling environment that serves as a foundation for
inclu-sive digital infrastructure and services and 2) building Agency capacity via technical trainings,
tool-kits, and guidance documents, and by building a network of Mission-based specialists. CDD works to
foster market-led innovation and integrate digital technology, advanced data, and geographic
anal-ysis, and to align digital development best practices with the strategic planning and design of
enter-prise-driven programs across the Agency and with partners.
About MIT D-Lab | CITE
MIT D-Lab
works with people around the world to develop and advance collaborative approaches
and practical solutions to global poverty challenges. The program’s mission is pursued through
an academics program of more than 20 MIT courses and student research and fieldwork
oppor-tunities; research groups spanning a variety of sectors and approaches; and a group of
participa-tory innovation programs called innovation practice.
This document is part of a series of reports produced by MIT CITE. Launched at the Massachusetts
Institute of Technology (MIT) in 2012 with a consortium of MIT partners, CITE was the first-ever
program dedicated to developing methods for product evaluation in global development. Located
at MIT D-Lab since 2017, CITE is led by an interdisciplinary team and has expanded its research
fo-cus to include studies that explore the barriers to, and enablers of, effective innovation processes
and technology adoption; the outcomes of capacity building programs and technology
interven-tions; and the contexts in which technologies and innovation processes operate. This includes a
portfolio of research studies on digital financial services programs, capacity for local innovation,
internet of things for agriculture, inclusive systems innovation, fairness in machine learning, and
evaporative cooling technologies. CITE also develops the capacity of researchers to conduct
eval-uations by providing resources and tools on its methods.
This report is made possible by the support of the American People through the United States
Agency for International Development (USAID). The contents of this report are the sole
responsi-bility of MIT D-Lab.
Authors
Cauam Cardoso and Jonars Spielberg, Massachusetts Institute of Technology
Acknowledgments
This research project would not have been possible without the support from staff at USAID,
im-plementing organizations, the research teams in Senegal and at MIT D-Lab, and others. The
con-tributions included, but were not limited to, providing connections to key stakeholders involved
in the research; logistical and implementation support; valuable feedback on the research
de-sign and questions; important data; valuable project management, co-dede-sign, and data collection
knowledge and skills; and feedback on the reports and presentations.
Specifically, MIT D-Lab and the authors would like to acknowledge the following individuals and
organizations for their assistance:
USAID: Mission support - Abdoulaye Dia, Abdoulaye Ndao; Center for Digital Development -
Ankunda Kariisa, Alison Harrell; and Center for Development Research - Maggie Linak.
MIT D-Lab: Dan Frey, Kendra Leith, Libby McDonald, and Eric Verploegen.
Senegal research team: Alassane Ba, Elhadj Ba, Moussa Baldé, Mouhamadou Deme, Hamady Dia,
Keyna Diop, Malal Silla Ka, Aissata Tall, Djeneba Thiam.
Additional implementing organizations: Agence Nationale de Conseil Agricole et Rural (ANCAR),
Fédération des Groupements et Associations de Femmes Productrices de la Région de
Saint-Louis (FEPRODES), Fédération des Producteurs de Maïs du Saloum (FEPROMAS), Feed the
Future Naatal Mbay, Femmes Productrices de Ross Bethio, Orange, Union des Groupement de
Maka Diama, SP1 Fanaye, Union des jeunes agriculteurs du Koyli Wirnde (UJAK), Union des PIV de
Thille-Thiangaye, Wari, The West African Research Center.
TABLE OFCONTENTS
1. INTRODUCTION 4
2. RESEARCH DESIGN, METHODS & IMPLEMENTATION 5
2.1. Research Strategy 5
2.2. Research Frameworks 6
2.2.1. Operational framework for organizational stakeholders 7
2.2.2. Operational framework for smallholder farmers 8
2.3. Study Sites 10
2.4. Implementation Partners 12
2.5. Research Methods 12
2.5.1. Exploratory case study 12
2.5.2. Quantitative survey 14
2.5.3. Conjoint experiment 16
2.6. Research Strengths and Limitations 20
3. RESULTS 20
3.1. Sample Characteristics 20
3.2. Six Key Findings for Senegal 23
3.2.1. Financial inclusion: Lower than digital inclusion, especially among women 23 3.2.2. Barriers to adoption: Unclear value proposition and “fit” among non-users 24 3.2.3. Supply-side perceptions of demand-side needs and attitudes are not always accurate 26 3.2.4. DFS service package preferences differ somewhat by gender and age but not by region 27
3.2.5. The type of DFS should inform program design 29
3.2.6. Supply-side perceptions of DFS service package preferences differed from SHF-reported
preferences 30
3.3. Preliminary Results of the Comparative Analysis: Four Key Comparative Findings between
Guatemala and Senegal 31
3.3.1. DFS can strengthen the relationship between the government & SHFs 35 3.3.2. The sequencing of financial and digital inclusion efforts may affect DFS adoption 36 3.3.3. High levels of digital and financial inclusion seem to be relevant to DFS adoption only after
SHFs trust the financial system 38
3.3.4. Supply-side participants in Guatemala showed low expectations about SHF behavior, which
are often mistaken 39
4. CONCLUSIONS & RECOMMENDATIONS 42
5. RESEARCH DISSEMINATION 44
1
SUMMARY OF KEY FINDINGS
This research project, Assessment of Potential Opportunities for Use of Digital Payments for
Smallholder Farmers in Resource Constrained Settings, explored 1) how digital services can
address the unmet financial needs of smallholder farmers; 2) the conditions under which smallholder farmers adopt digital financial services (DFS) to address these unmet needs; and 3) the characteristics that predict, incentivize, or are barriers to adoption of DFS by smallholder farmers. Tables 1 and 2 provide a summary of the key findings of the report, as well as a short summary of recommendations for local decision makers. The last column in each table indicates supply-side stakeholders who are in the best position to follow up on these findings and recommendations. Table 1 pertains to Senegal specifically. Table 2 pertains to both Senegal and Guatemala, the two countries where this research project took place.
Table 1 – Summary of Findings, Recommendations, and Key DFS Stakeholders in Senegal
Finding (Provisional) Implication/Recommendation Stakeholders
Financial inclusion is lower than digital inclusion, especially among women
Widespread mobile phone ownership is not directly associated with higher DFS usage. The availability of digital technologies is unlikely to change smallholder farmers’ (SHFs’) cost-benefit calculations if the underlying terms of the financial services offered are not advantageous. This is especially true in the case of women, whose digital inclusion is already lower than that of men. Providers1 + Enablers2 + Conveners3 An unclear value proposition impedes greater adoption
Non-users, especially older women, appear to believe that digital financial services (DFS) is not compatible with their lives, and that DFS are not designed with them in mind. Whether this is true or not, the perception alone serves as a barrier to adoption. More attention is needed to understand SHFs’ financial lives, and to demonstrate how DFS can become integral parts of their lives.
Providers + Enablers
1 Providers are organizations that design and deliver digital financial services. They include actors such as banks, telecom companies, and Fintech startups.
2 Enablers are the organizations creating and maintaining the institutions that DFSs need to function as an integrated system. They help in the design of regulations, policies, and programs as well as in the identification of
organizational gaps and diffusion of best practices.
3 Conveners are organizations that aggregate DFS users. They can be organized from the bottom up as farmer cooperatives or from the top down as networks of farmers selling their products for the same private-sector buyer.
2 Mistaken supply-side perceptions of demand-side needs can lead to services and programs farmers do not want or need
Supply-side respondents often answered the mirror survey differently than SHFs. These differences reflect divergent mental models and beliefs and can have material consequences for what is offered to farmers. Effort should be taken among all supply-side actors to invest in “updating” their perceptions of the needs and attitudes of their (potential) beneficiaries or customers so that time and resources can be focused toward activities that will resonate with SHFs. Multiple avenues exist to update perceptions, but most generally involve interacting with SHFs to a greater degree.
Providers + Enablers + Conveners
DFS service packages can scale but equity concerns require sensitivity to groups’ varying preferences
DFS delivery preferences that are shared across the two regions sampled suggests that targeted geographical interventions may not be necessary. But in order to scale equitably, special considerations are likely needed among sub-groups, such as women and the elderly, whose preferences are distinct. New providers will be able to compete to capture younger adult market segments, who possess less loyalty to incumbent providers than older adults.
Providers + Enablers DFS type should inform service package design
Results indicate that SHFs who want to use insurance through digital channels value assistance, whether through an agent or through group membership. In contrast, SHFs who prefer digital transfers value individual use of a phone app and lower transaction fees. The general point is that, while the service itself is important, it is also important to tailor delivery to meet the needs and preferences of users for each service.
Providers + Enablers
Supply-side actors, who may not always understand SHFs’ preferences, would benefit from incorporating SHF feedback into service package design
Supply-side respondents thought SHFs preferred using agents over a phone app and wanted better transaction rates over better security, the opposite of what SHFs self-reported. Supply-side respondents also underestimated the importance SHFs attached to individual memberships from organizations to whom they already belonged. Specific strategies to reach farmers are necessary but are likely informed by inaccurate ideas among providers and enablers. Listening to farmers and incorporating them into the delivery design process could help counter costly misperceptions and speed up DFS expansion among SHFs.
Providers + Enablers
3 Table 2 – Summary of Comparative Analysis Findings, Recommendations,
and Key DFS Stakeholders for Senegal and Guatemala
Finding (Provisional) Implication/Recommendation Stakeholders
DFS can strengthen the relationship between the
government & SHFs
Government support of SHFs in the form of direct subsidies can positively affect the expansion of DFS usage in the country. Supply-side stakeholders should consider alternative public policies with DFS integration as a mechanism to engage SHFs.
Providers + Enablers + Conveners
The sequencing of financial and digital inclusion efforts may affect DFS adoption
SHFs prefer using banking services in person, which may increase resistance to DFS adoption, especially in cases where financial inclusion is high relative to digital inclusion, as is in Guatemala. Senegal, where digital use is high relative to individual use of banking institutions, may be a context more conducive to DFS uptake, where SHFs may have fewer pre-existing assumptions about or experiences with formal financial institutions that would color their decision-making on DFS adoption.
Enablers and providers should support awareness raising campaigns to demonstrate the benefits of DFS. However, these efforts should be accompanied by DFS modalities that are useful and affordable to SHFs.
Providers + Enablers + Conveners
High levels of digital and financial inclusion seem to be relevant to DFS adoption only after SHFs trust the financial system.
Senegalese SHFs trust their financial system, which is consistent with a relatively high proportion of people joining new DFS providers. At the same time, most SHFs take over one year to adopt DFS from when they first heard about it. One of the explanations for this may be the lower socio-economic indicators, as well as low levels of financial inclusion.
In Guatemala, relatively high distrust in the financial system creates the need for additional assurances from providers and enablers prior to DFS adoption. But the data shows that as trust is achieved, relatively higher levels of financial and digital knowledge may increase the speed of DFS adoption. Providers + Enablers Supply-side participants in Guatemala showed low expectations about SHF
behavior, which are often mistaken
Low supply-side expectation may lead to a misinterpretation of SHFs’ priorities and behaviors, with a potentially negative effect on policy. Key instances of potential misinterpretation of priorities: DFS adoption among SHFs seems to be more about trust and value for money than about financial/digital knowledge as perceived by the supply-side actors.
Providers + Enablers + Conveners
4
1. INTRODUCTION
The project, Assessment of Potential Opportunities for Use of Digital Payments for Smallholder
Farmers in Resource Constrained Settings, was established in 2018 through a partnership
between MIT D-Lab CITE and USAID’s Feed the Future Program (D2FTF). The objective of this research is to better understand the role that digital services can play in the financial inclusion of smallholder farmers in Senegal (this report) and in Guatemala in a separate report, “Assessment of Potential Opportunities for Use of Digital Payments for Smallholder Farmers in Guatemala’s Western Highlands.”
The literature on digital financial services (DFS) is relatively recent, but it has documented a variety of lessons learned through the implementation of policies and projects around the world.4
This study builds on the existing knowledge, but the goal of the report itself will be to provide a summary of the key findings of the study, in order to highlight the points most useful to practitioners and decision makers in Senegal. More detailed documents containing the complete methodology and research results will be published at a later stage through academic papers. As such, the findings and recommendations of this report are still tentative, given that they reflect the evidence and analysis available to date.
There are three fundamental concepts for the research that are important to be defined from the outset: Digital Financial Services, Financial Inclusion, and Smallholder Farmer:
● Digital Financial Services (DFS): “Digital financial services” is a broad category that encompasses Mobile Financial Services (MFS) and all branchless banking services that are enabled via electronic channels. Services can be accessed using a variety of electronic instruments, including mobile phones, card-reading point of sale (PoS) devices, electronic cards (credit, debit, smart card, key fobs), and computers. Similarly, “digital payments” covers mobile payments and electronic payments, while digital money covers mobile money and electronic money.”5
● Financial Inclusion or Access to Finance: “Access to and the ability to effectively use appropriate financial services that are provided responsibly and sustainably in a well-regulated environment. Although access to informal financial services (services offered by unregulated entities) is a form of access to finance, financial inclusion efforts typically focus on extending access to formal financial services (services offered by regulated entities) to poor and underserved communities.”6
4 Nicoletti, B. (2017). The future of FinTech: Integrating finance and technology in financial services. Springer. 5 Martin, C. et al (2016) USAID Guide to the Use of Digital Financial Services in Agriculture.
5 ● Smallholder Farmers: SHFs will be defined in terms of size of agricultural holdings7 and the
nature of labor in these properties8. Size: <2 hectares – “small is a relative concept, depending
on agro-ecological as well as socio-economic considerations. Labor: “Labor is a key feature of smallholder agriculture. We consider a smallholding to be an agricultural holding run by a family using mostly (or only) their own labor and deriving from that work a large but variable share of its income, in kind or in cash.”
Taking into consideration these fundamental concepts, the study investigates three research questions:
1. How can digital services help address the unmet financial needs of smallholder farmers? 2. Under what conditions do smallholder farmers (SHFs) adopt digital financial services to
address these unmet needs?
3. What characteristics predict, incentivize, or are barriers to the adoption of DFS by smallholder farmers interacting in agricultural value chains?
2. RESEARCH DESIGN, METHODS & IMPLEMENTATION 2.1. Research Strategy
The strategy adopted to respond to the three questions consisted of five phases and took place between June of 2018 and December of 2019. The research phases represent a mix of qualitative and quantitative methodological practices, triangulating different types of data in order to increase the confidence in the results presented.9 The integration of methodologies followed a sequential
exploratory design, where an initial case study is followed by a subsequent quantitative survey.10,11 Such strategy is adequate for cases where a detailed description of the context is
necessary to inform data collection on specific trends and behavioral patterns of the research subjects.12,13
7 From Lowder, S. K., Skoet, J., & Raney, T. (2016). The number, size, and distribution of farms, smallholder farms, and family farms worldwide. World Development, 87, 16-29.
8 HLPE (2013) Investing in smallholder agriculture for food security. A report by the High-Level Panel of Experts on Food Security and Nutrition of the Committee on World Food Security.
9 Jick, T. D. (1979). Mixing qualitative and quantitative methods: Triangulation in action. Administrative science quarterly, 24(4), 602-611.
10 Pluye, P., & Hong, Q. N. (2014). Combining the power of stories and the power of numbers- mixed methods research and mixed studies reviews. Annual review of public health, 35, 29-45.
11 Creswell, J. W., & Creswell, J. D. (2017). Research design: Qualitative, quantitative, and mixed methods approaches. Sage publications.
12 Gable, G. G. (1994). Integrating case study and survey research methods- an example in information systems. European journal of information systems, 3(2), 112-126.
13 Ivankova, N. V., Creswell, J. W., & Stick, S. L. (2006). Using mixed-methods sequential explanatory design: From theory to practice. Field methods, 18(1), 3-20.
6 ● Phase 1 - Preliminary research phase, which identifies key research questions, as well as
provides the scope and general features of the study design
● Phase 2 - Comparative case-studies (one for each country) describing both the context within which local smallholder farmers live and work, and the digital financial services national ecosystem
● Phase 3 - A quantitative survey to identify smallholders (actual and perceived) financial needs, and conditions for DFS adoption
● Phase 4 - Analysis of the data collected through the survey, identifying key results and lessons for local decision-makers
● Phase 5 – A series of research dissemination events, including presentations at USAID headquarters in DC and USAID Senegal
2.2. Research Frameworks
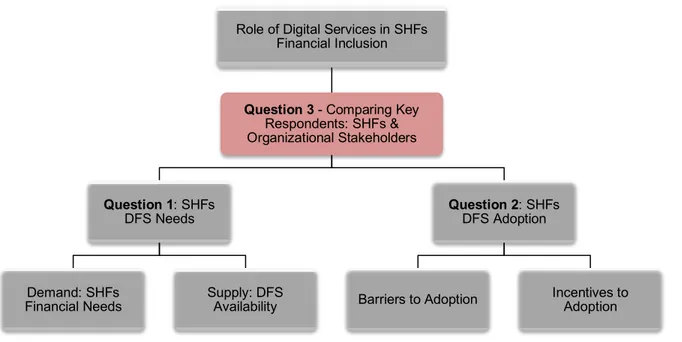
A research framework was built to operationalize each research question, based on the expert interviews and a review of the literature performed during this initial phase of the study (see Figure 1). The first question centers around the dynamics of supply of digital financial services, and the demand for these services by smallholder farmers. The second focuses on the smallholder farmers’ behavior and decision-making in terms of barriers and incentives to DFS adoption. In the third question, the goal is to compare and contrast how actors in the “supply side” – organizational stakeholders responsible for providing services, creating an enabling environment for DFS, and
convening clients – interpret DFS challenges and opportunities, vis-à-vis populations in the
“demand side” – smallholder farmers (SHFs) who potentially could, or do use DFS. Figure 1 – Summarized Research Framework
Role of Digital Services in SHFs Financial Inclusion
Question 3 - Comparing Key
Respondents: SHFs & Organizational Stakeholders
Question 1: SHFs
DFS Needs
Demand: SHFs
Financial Needs Supply: DFS Availability
Question 2: SHFs
DFS Adoption
7 As a complement to this general structure, the research team developed operational frameworks for “supply” and “demand” constructs. The objective was to limit the scope of the study and lay out transparent guidelines for the development of sampling strategies and the selection of data collection methodologies.
2.2.1. Operational framework for organizational stakeholders
The operational framework for organizational stakeholders was designed around three types of organizations (See Figure 2):
• DFS Providers: Providers are organizations that design and deliver digital financial services, who may or may not target farmers directly. They include more traditional actors such as banks and telecom companies, but also newer players like Fintech startups that were already present in the digital space. Overall, understanding providers’ perspectives (including staff and third-party agents) is important because they can reveal what design principles and assumptions they use when creating services, and the challenges and opportunities that emerge during DFS implementation.
• Conveners: Conveners are organizations that aggregate DFS users, often providing the scale that allows these services to be effective. They can be organized from the bottom-up as farmer cooperatives, or from the top-down as networks of farmers selling their products for the same private sector buyer. By talking to conveners, the research team was able to understand the unique characteristics of these networks, and the pre-conditions they pose to the appropriate deployment of DFS.
• Enabling Organizations: Enablers are the organizations creating and maintaining the institutions that DFS needs to function as an integrated system. They help in the design of regulations, policies, and programs, as well as in the identification of organizational gaps and diffusion of best practices. From these organizations, the study learned more about the history of DFS in the country, major sectoral initiatives, and current DFS challenges and opportunities at a systemic level.
8 Figure 2 – Summarized Sampling Framework for Organizational Stakeholders
2.2.2. Operational framework for smallholder farmers
The operational framework for smallholder farmers was designed according to the following criteria (See Figure 3):
• Institutional Partners: Since USAID is the main institutional partner of the study, the research took advantage of its infrastructure and contacts in the field to implement data collection activities. However, the research sought to minimize potential selection bias by collecting additional data via alternative partners. These are organizations without formal connections with USAID, such as local DFS providers, private agricultural firms with large network of suppliers, or SHF cooperatives. Due to feasibility considerations, the main goal was to select at least one of these organizations, and recruit some of their clients as a reference group.
• Location: The study focused on areas where access was feasible, the population of low-income smallholder farmers was large, and agricultural practices were diverse and
Organizational Stakeholders DFS Providers Farmer Specific
New AgritechsA. New
Traditional Agricultural B. Banks General New C. Local Fintecs Service D. New Providers Traditional E. Micro-Finance Institutions F. Banks G. Telecom Companies Conveners H. Bottom-up: Farmer Cooperatives
I. Top-Down: Private Single Buyers Enabling Organizations J. Government K. International Agencies L. NGOs
9 representative of the local context. Recognizing USAID as our main implementing partner, it was critical for the study that research sites overlapped with areas where USAID projects are operational.
• Gender: Depending on local social norms and other contextual factors, women and men can have dissimilar experiences related to agriculture, as well as DFS access and use. As such, the study included gender considerations in its sampling (ex: building a sample with a proportional number of male and female respondents), data collection methods and practices (ex: in the qualitative phase, focus group discussions were separated by gender), and research content (ex: asking questions that identify gender-based variations in behavior).
• Crop Variety: Crop variety was an important factor in assuring the comparability between the case studies in Senegal and Guatemala (see table below). As such, the study selected crop types considering both context-specific factors (export value and national consumption patterns), and aspects that would favor comparability (by selecting crops that are relevant to both countries).
• DFS Adoption: One of the objectives of the study was to understand behavior patterns between smallholder farmers that adopt DFS and those who do not. As such, research sampling, methods, and questions were designed to capture the experience of participants who are DFS users and those who are not.
• Socio-cultural Characteristics: Both Senegal and Guatemala are characterized by unique social and cultural characteristics. The study aimed to prevent biases in the analysis by mixing data collection locations and being mindful of these cultural differences during fieldwork. The objective was to avoid a situation in which the pool of respondents was too heavily populated with people from the same religion, ethnicity, or historical background.
10 Figure 3 – Summarized Sampling Framework for SHFs
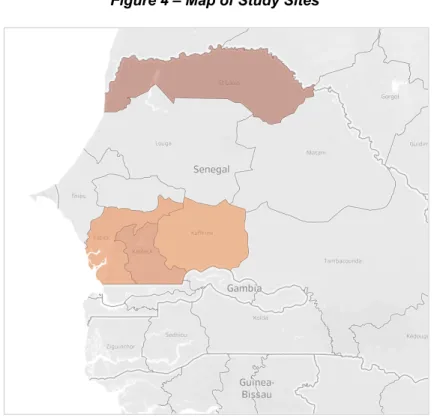
2.3. Study Sites
The study focused on two major agricultural areas in Senegal. The first was the Delta and middle valley portions of Senegal River Valley in the north within the region of Saint Louis, where irrigated rice farming is prevalent. The second was the Sine-Saloum River Basin in the central area, comprised of the regions Kaffrine, Kaolack, and Fatick (see Figure 4). Here, groundnuts and maize are the dominant crops planted.
These regions are predominantly rural with significant concentrations of smallholder farmers as well as relatively elevated levels of poverty, consistent with the research objectives (see Table 3). In addition, USAID, especially its agricultural programming under Feed the Future (FTF), operate actively in these regions,14 which helped facilitate the selection of partner organizations to
implement the study.
14 USAID (2017) Feed the Future Zone of Influence Indicator Assessment Report May 2017. Available at: https://cg- 281711fb-71ea-422c-b02c-ef79f539e9d2.s3.us-gov-west-1.amazonaws.com/uploads/2018/03/Feed_the_Future_Senegal_Indicator_Assessment_Report.pdf INSTITUTIONAL PARTNER [SHFs] Access to Irrigation Rain-fed Irrigated Gender Male Female Crop Variety Rice Groundnut Cotton Maize Location Country's Capital Area A Area B DFS Adoption DFS User DFS Non-User Socio-cultural Characteristics Religion Ethnicity
11 Figure 4 – Map of Study Sites
Table 3 – General Characteristics of Potential Research Sites in Senegal
Characteristics/Region Saint Louis Kaffrine15 Kaolack Fatick
Rural Population16 51% 82% 62% 83%
% of population living in
poverty17 41% — 66% 46%
Primary crops Rice Groundnuts, maize Groundnuts, maize Groundnuts, maize
HDI18 0.46 — 0.43 0.51
USAID Operations Yes Yes Yes Yes
15 Administrative data on Kaffrine is unavailable for several socioeconomic indicators. See, for instance, at: http://senegal.opendataforafrica.org
16 Agence nationale de la Statistique et de la Démographie - ANSD, Sénégal. Available at: http://senegal.opendataforafrica.org/SNSEI2015/social-economic-indicators-of-senegal 17 Agence nationale de la Statistique et de la Démographie - ANSD, Sénégal. Available at:
http://senegal.opendataforafrica.org/cqkpgcc/incidence-of-poverty-and-contribution-of-senegal-2006 18 Global Data Lab (2017). Subnational Human Development Index. Available at:
12
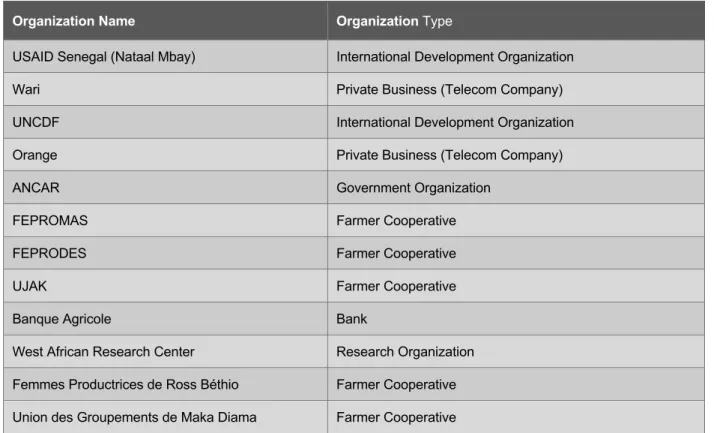
2.4. Implementation Partners
The fieldwork planning and implementation in Senegal relied on several institutional partners (see Table 4 below) for the identification and recruitment of research participants, especially during phases 2 and 3 of the project. This group represents a diverse pool of organizations working in a variety of fields such as banking, telecoms, government, and farmer cooperatives.
Table 4 – Implementation Partners in Senegal
Organization Name OrganizationType
USAID Senegal (Nataal Mbay) International Development Organization
Wari Private Business (Telecom Company)
UNCDF International Development Organization
Orange Private Business (Telecom Company)
ANCAR Government Organization
FEPROMAS Farmer Cooperative
FEPRODES Farmer Cooperative
UJAK Farmer Cooperative
Banque Agricole Bank
West African Research Center Research Organization Femmes Productrices de Ross Béthio Farmer Cooperative Union des Groupements de Maka Diama Farmer Cooperative
2.5. Research Methods
With the development of the general and operational research frameworks, as well as the definition of the study sites and implementation partners, phases 2 and 3 of the study used complementary methodologies.
2.5.1. Exploratory case study
Phase 2 consisted of an exploratory case study focusing on the Senegal River Valley and the Sine-Saloum River Basin. Such a strategy allowed the research team to test the feasibility of the study, develop operational measurements, and form tentative hypotheses to be tested in phase
13 3.19,20 Phase 2 was largely qualitative, and followed a grounded theory approach,21 creating a rich
description of the local context, its social and economic characteristics, as well as participants’ actions and points of view.22,23 This information was critical to better understand smallholder
farmers, what financial needs they have, and the conditions underlying their decision whether to use digital financial services. Specifically, phase 2 relied on the following qualitative methodologies:
● Document Analysis: The team reviewed project documents, reports, and databases produced by relevant organizational stakeholders. The goal was to identify historical and contextual aspects that can inform the development of the research questions and hypotheses the team probed during phase 3.24
● Direct Observation: During the fieldwork, researchers sought opportunities to observe research participants in their own environment. For example, field visits included trips to farming input stores, mobile agents’ shops, and local bank branches.
● Semi-structured interviews: The research team interviewed representatives of organizational stakeholders and smallholder farmers as outlined in the research framework. The priority was to create a variability sample,25 where respondents provide a diverse set of
perspectives about DFS’ relevance to smallholder farmers. Specific interview protocols were prepared to address questions specific to each target population.
● Focus group discussions: FGDs were used as a mechanism for data collection from smallholder farmers. This methodology allows for gathering of information from a relatively large number of respondents within a short timeframe.26 Furthermore, FGDs are considered
friendly to people who cannot read or write (which is the case of some SHFs), and to people who may otherwise feel intimidated by individual interviews.27
19 George, A. L., & Bennett, A. (2005). Case studies and theory development in the social sciences. MIT Press. 20 Yin, R. K. (2017). Case study research and applications: Design and methods. Sage publications.
21 Corbin, J. M., & Strauss, A. (1990). Grounded theory research: Procedures, canons, and evaluative criteria. Qualitative sociology, 13(1), 3-21.
22 Maher, C., Hadfield, M., Hutchings, M., & de Eyto, A. (2018). Ensuring Rigor in Qualitative Data Analysis: A Design Research Approach to Coding Combining NVivo With Traditional Material Methods. International Journal of
Qualitative Methods, 17(1), 1609406918786362.
23 Corbin, J. M., & Strauss, A. (1990). Grounded theory research: Procedures, canons, and evaluative criteria. Qualitative sociology, 13(1), 3-21.
24 Bowen, G. A. (2009). Document analysis as a qualitative research method. Qualitative research journal, 9(2), 27-40.
25 Ibid Daniel, J. (2011)
26 Stewart, D. W., & Shamdasani, P. N. (2014). Focus groups: Theory and practice (Vol. 20). Sage publications. 27 Kitzinger, J. (1995). Qualitative research: introducing focus groups. Bmj, 311(7000), 299-302.
14
2.5.2. Quantitative survey
Phase 2 provided details about two key factors: i) contextual nuances of the local DFS ecosystem; and ii) logistical constraints that helped the team define the scope and scale for phase 3. The development of the survey instrument was also informed by existing research on financial and digital inclusion in rural areas.28,29,30,31,32,33,34,35 This evidence was especially useful to frame
questions about smallholder farmers’ access to, and adoption of DFS. However, the same was not true for comparing how “supply” and “demand” sides perceive DFS challenges.
With little precedent in the digital finance literature, the team pursued methodological strategies in areas like medicine, where there have been studies about how doctors and patients perceive symptoms of chronic diseases differently,36,37 as well as in political science, where scholars
explored how the general public and policy experts perceive corruption at the national level38.
Drawing from these examples, the research team created an adapted “mirror survey” approach, which consists of two questionnaires - one for smallholder farmers, and another for participants from the “supply-side” – with similar questions and structure (see Table 5 & 6).
The demand-side questionnaire had a total of 90 questions and was conducted in person by a team of local researchers. The supply-side questionnaire had 79 questions and was conducted either in person by the Senegalese research team or self-administered online via an anonymous survey link. Both questionnaires lasted between 30 and 45 minutes.
28 CGAP (2016) Smallholder Household Survey - Building the Evidence Base on the Agricultural and Financial Lives of Smallholder Households. Available at: http://microdata.worldbank.org/index.php/catalog/2922
29 Finau, G., Rika, N., Samuwai, J., & McGoon, J. (2016). Perceptions of digital financial services in rural Fiji. Information Technologies & International Development, 12(4), pp-11.
30 World Bank (2017) Global Findex Questionnaire. Available at:
https://globalfindex.worldbank.org/sites/globalfindex/files/databank/2017%20Findex%20questionnaire.pdf 31 BFA (n.d.). Financial Diaries Project Questionnaires. Available at: http://financialdiaries.com/about 32 OECD (2018). Financial inclusion and consumer empowerment in Southeast Asia. Available at:
http://www.oecd.org/finance/Financial-inclusion-and-consumer-empowerment-in-Southeast-Asia.pdf
33 CGAP (2018). Financial Diaries with Smallholder Families. Available at: http://www.cgap.org/data/data-financial-diaries-smallholder-families
34 IFC (2016). Mobile banking Questionnaire for users. Available at:
https://www.ifc.org/wps/wcm/connect/571be8004e23021c939fbb7a9dd66321/Tool+3.9.+Market+Questionnaire+-+Users.pdf?MOD=AJPERES
35 IFC (2016). Mobile banking Questionnaire for non-users. Available at:
https://www.ifc.org/wps/wcm/connect/75112a804e2301d39396bb7a9dd66321/Tool+3.10.+Market+Questionnaire+-+Non-Users.pdf?MOD=AJPERES
36 Barr, R. G. et al (2005) Physician and patient perceptions in COPD- the COPD resource network needs assessment survey. The American journal of medicine, 118(12), 1415-e9.
37 Celli, B. et al (2017) Perception of symptoms and quality of life–comparison of patients’ and physicians’ views in the COPD MIRROR study. International journal of chronic obstructive pulmonary disease, 12, 2189.
38 Razafindrakoto, M., & Roubaud, F. (2010). Are international databases on corruption reliable? A comparison of expert opinion surveys and household surveys in sub-Saharan Africa. World development, 38(8), 1057-1069.
15 Table 5 – Examples of Questionnaire Vignettes & Questions
Demand-side vignette: “In this section of the research, we will ask you a few questions about how you use digital technologies such as mobile phones:
Demand-side Question: Do you own a mobile phone?”
Supply-side vignette: “In this section of the survey, we will ask you about YOUR PERCEPTION of how smallholder farmers use digital technologies such as mobile phones.
Please think of a real small farmer with whom you have had contact recently, who is a representative of most of the farmers you work with.
If you do not have direct contact with small farmers yourself, think of a typical small farmer who benefits from the projects or services provided by your organization.” Supply-side Question: “Do you think this typical smallholder farmer owns a mobile phone?”
Table 6 – Mirror Questionnaire Structure
Questionnaire
Section Demand-side” Survey Structure (Questionnaire to be responded by
Smallholder Farmers themselves)
Supply-side” Survey Structure
(Questionnaire to be responded by relevant
stakeholders in the “supply-side”, about how do they think a “typical” smallholder farmer, in their
experience, would respond to the same question)
Section 1 Socioeconomic Profile
(age, gender, education, etc.)
Participant’s Socioeconomic Profile
(age, gender, education, professional activity, type of employer, etc.)
Section 2 Agricultural Profile
(type of crop, land ownership, etc.)
Typical SHF - Socioeconomic & Agricultural Profile
(age, gender, education + type of crop, land ownership, etc.)
Section 3 Digital Inclusion Profile
(mobile phone/computer ownership, usage, etc.)
Typical SHF - Digital Inclusion Profile
(mobile phone/computer ownership, usage, etc.)
Section 4 Financial Inclusion Profile
(bank account ownership, usage, as well as savings, borrowing, transfers, payments and insurance activities)
Typical SHF - Financial Inclusion Profile
(bank account ownership, usage, as well as savings, borrowing, transfers, payments and insurance activities)
Section 5 Barriers & Incentives to DFS Adoption
(DFS adoption and usage, reasons for using DFS or not, etc.)
Typical SHF - Barriers & Incentives to DFS Adoption
(DFS adoption and usage, reasons for using DFS or not, etc.)
16 Whereas the demand-side questionnaire would provide data for answering research questions 1 2, and 3, the supply-side questionnaire allowed the team to address question 3. Most of the analysis contained in this report was based on descriptive statistics of relevant sections of the survey, while chi-square or t-tests were used to conduct bivariate analyses of some variables to determine significant associations, especially in the comparative analysis between demand and supply responses, as well as between the data gathered in Guatemala and Senegal.
2.5.3. Conjoint experiment
To address our third research question about the characteristics that matter to SHFs when considering using DFS, we included a conjoint experiment in our survey. First used in marketing39
but subsequently applied to several other fields including public health,40 political science,41 and
agriculture,42 conjoint experiments are used to gain insight on individuals’ preferences. They work
by dissecting a product or service into discrete characteristics, or attributes, that can then take on different values, or levels. For instance, a car can take on the attributes of price, brand, and gas mileage with levels for each, such as $10,000 or $25,000, Toyota or Ford, and 20 mpg or 50 mpg. A research subject is then presented with two (or more) of the service/product with different level combinations and asked to choose which they would prefer—continuing the car example, choosing between a $25,000 Toyota with 50 mpg or a $10,000 Ford with 20 mpg. Using statistical methods, we can then calculate which attributes and levels matter more or less. We can also disaggregate the results, such as by gender or age, to examine how preferences might vary among different sub-groups.
Conjoint experiments have several advantages relative to other survey-based methods that ask respondents explicitly about their preferences, as well as some disadvantages. Advantages include the ability to:
● Estimate the effect of several attributes simultaneously
● Address certain kinds of biases (omitted variable, reverse causality, social desirability) ● Reflect how choices are actually made in the real world, where respondents have to make
tradeoffs between different attributes that are bundled together (you buy a car with a lower price as well as several other attributes, not just a lower price)43
39 Green PE and Wind Y. (July-August 1975). New Way to Measure Consumers’ Judgments.” Harvard Business Review.
40 Van Rijsbergen B and D’Exelle B. (2013). Delivery Care in Tanzania: A Comparative Analysis of Use and Preferences, World Development 43, 276-287.
41 Oliveros, V., & Schuster, C. (2018). Merit, tenure, and bureaucratic behavior: Evidence from a conjoint experiment in the Dominican Republic. Comparative Political Studies, 51(6), 759-792.
42 Alwang J, Larochelle C, and Barrera V. 2017. “Farm Decision Making and Gender: Results from a Randomized Experiment in Ecuador.” World Development 92: 117-129.
43 Hainmueller J, Hopkins DJ, and Yamamoto T. (2014). Causal inference in conjoint analysis: Understanding multidimensional choices via stated preference experiments, Political Analysis 22, 1-30.
17 The primary disadvantage is that including more attributes and levels requires a larger sample size to yield statistically significant results. Due to time and resource constraints for data collection, we decided to limit the attributes to five, each with two levels, as seen in Table 7. It should be noted that, while we chose these attributes and levels based on reports, meetings with experts, supply-side interviews, and focus group discussions during Phases 1 and 2, additional attributes could contribute to a farmer’s choice when considering DFS use in agriculture.
Table 7 – Conjoint Experiment Attributes and Levels
Attribute Level
Access By a phone app By an agent Account type Individual membership Group membership Loyalty Existing provider New provider Promotion Airtime bonuses Lower fees
Reliability Better security Better transaction success rate
In our case, respondents were presented with a hypothetical new program, named “e-Money for Agriculture” (eM4A), and were told that it was going to digitize one of six agricultural services. After disclosing which service they most wanted digitized, each SHF was then shown seven rounds of two service packages and asked which of the two they preferred (supply-side survey respondents were also given the conjoint experiment; as with other survey sections, they were asked to make their choices “as if” they were a typical SHF). Because literacy levels varied widely among SHFs, we developed a script to be read aloud and visual representations of each attribute-level that the farmer could look at when making his or her decision. The script and visuals are shown in Figure 5. Our procedure and the way in which we integrated the conjoint experiment into our larger survey was modeled off of previous work from MIT’s Governance Lab.44 In
anticipation of the results in the next section, Figure 6 shows illustrative conjoint results and how to interpret them.
44 Meyer A and Rosenzweig L. ( 2016). Conjoint Tools for Developing Country Contexts, The Political Methodologist, February 18.
18 Figure 5 – Conjoint Experiment Script and Visual Representations
Now that we know you want to digitize [preferred FS], we want to know how you would like this program to best serve you. We will show you 2 pretend programs side-by-side that will provide the service for you. Each program will have different characteristics and we will ask you to choose which one you would prefer over the other.
[Researcher gives examples of all characteristics and the meaning of each variable].
You must make a choice between the two. You will repeat this exercise a total of 7 times. Each pair of programs will be slightly different, so make sure to pay attention!
DESCRIPTION OF PROGRAM CHARACTERISTICS:
-Access, agent (A): The program offers an SMS--based system with limited options to perform transactions over the phone. -Access, phone app (B): The program offers an app that allows the user to rely less on agents, with a subsidized smartphone. -Account type, group (A): This program offers one account to be managed by your farmer cooperative on behalf of all its members. -Account type, individual (B): This program offers an account to you individually for you to manage.
-Loyalty, existing customer (A): Your current bank or DFS provider will offer this program.
-Loyalty, new customer (B): A different bank or DFS provider from what you have now will offer this program. -Promotion, airtime bonus (A): This program offers airtime bonuses based on the volume of transactions. -Promotion, lower transaction fees (B): This program offers lower transaction fees than the competition. -Reliability, security (A): This program does better than the competition in terms of fraud protection.
19 Figure 6 – How to Interpret Conjoint Results: Illustrative Example
(Singular population result, above; comparative result between sub-populations, below)
Note: Preference is measured formally as average marginal component effect, or AMCE45. To illustrate with an example, the AMCE for the Access attribute above (darker bar) shows that there is a 10 percentage point preference for a service package that is able to offer a phone app to complete transactions relative to an otherwise identical service package that does not offer an app and instead requires more reliance on an agent.
45 Hainmueller J, Hopkins DJ, and Yamamoto T. (2014). Causal inference in conjoint analysis: Understanding multidimensional choices via stated preference experiments, Political Analysis 22, 1-30.
20
2.6. Research Strengths and Limitations
A key strength of the research is the mirror supply- and demand-side surveys, which to our knowledge one of the first applications of such an approach to research in the DFS space. This allows us to make direct comparisons between the responses of SHFs and those who work with them in order to understand when and how perceptions among supply-side actors misalign with those of farmers. Our research design also explicitly targeted Feed the Future zones of influence for our sample, such that the findings would be relevant to populations who are beneficiaries of USAID’s agricultural programming. The application of a conjoint experiment is novel and allows for quantification of the preferences of farmers. By providing new evidence on how to optimize digital finance design and delivery, we respond to an identified research gap.46
Limitations stem primarily from time and resource constraints that impacted our sampling design. The sample is non-random and non-nationally representative, though we made every effort to collect a diversity sample that was balanced across relevant demographic characteristics (gender, age, crop, etc.). The sample also contains cross-sectional data, a snapshot in time, rather than longitudinal data that would have allowed the tracking of dynamic response changes over time. The key strength of the mirror surveys is also a limitation in the sense that, because we were one of the first research teams to do so, we did not have a well-established methodology or example to follow.
3. RESULTS
3.1. Sample Characteristics
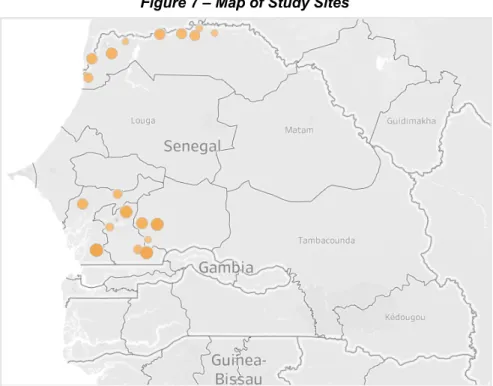
Following a purposeful, multi-stage sampling strategy, the implementation partners helped identify and recruit participants for the survey following the supply and demand operational frameworks the research team developed. The total sample size of the study was 652. The sample for phase 2 consisted of 59 participants (47 demand and 12 supply) from which data was collected through semi-structured interviews or focus group discussions. Phase 3 relied on a larger sample of 583 respondents who completed the mirror questionnaires. The sample size for phase 3 needed to be large enough for the conjoint experiment results to have sufficient statistical power. Based on sample size calculations taking into account our conjoint experiment design (number of attributes, levels, and choice rounds; sub-populations of interest), we determined that a minimum of 350 demand-side respondents was needed, with 400 or more being preferred.47
Figure 7 provides additional details about the location of data collection activities. Since the goal of the report is to provide a summary of key research findings, the following sections will focus on the results from Phase 3 of the study.
46 Partnership for Finance in a Digital Africa. (2017). Snapshot 16: Digital Finance Impact Evidence Summary. 47 Based on formulas found in Orme, B. (2010). Getting Started with Conjoint Analysis. Chapter 7, Sample Size Issues for Conjoint Analysis. Research Publishers.
21 Figure 7 – Map of Study Sites
Research Phase Demand-Side Supply-Side Total
Phase 2 47 12 59
Phase 3 438 145 583
Total 485 157 652
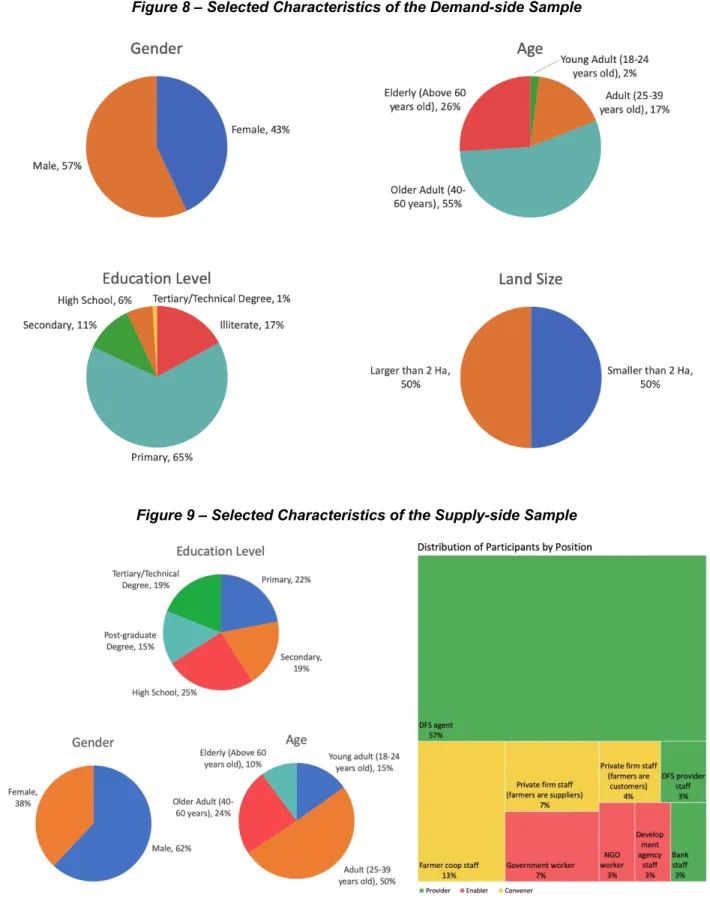
As Figure 8 shows, sampling efforts were successful in identifying a diverse group of smallholder farmers across the study sites. There was an approximately 60-40 proportion of male-to-female respondents, while most participants were above the age of 40 (71%). As expected, nearly two-thirds of all farmers interviewed had primary education, which is characteristic of that population. Half of SHF respondents worked on plots of land that were 2 Ha or less (80% on 5 Ha or less). Figure 9 describes some key characteristics of the supply-side sample, which was also successful in including a diverse group of professionals from the private, public and non-profit sectors. As expected, this group tends to have higher educational levels, is predominantly male (62%) and younger (50% between 25-39 years old).
22 Figure 8 – Selected Characteristics of the Demand-side Sample
23
3.2. Six Key Findings for Senegal
The preliminary analysis of phase 3 data produced six relevant findings for policy makers and project implementers in Senegal. Such findings are summarized below.
3.2.1. Financial inclusion: Lower than digital inclusion, especially among women
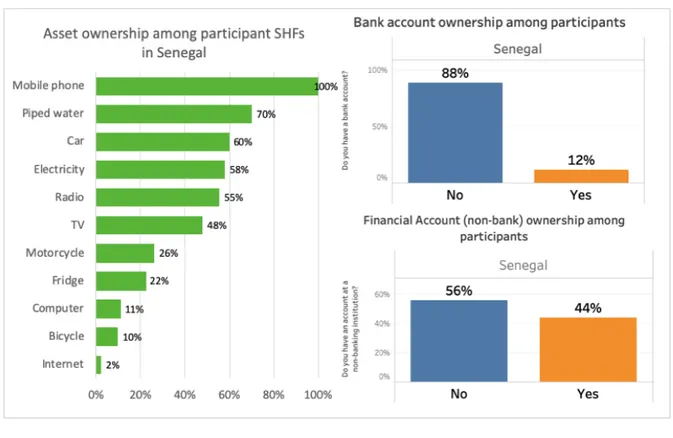
Figure 10 provides three measures of inclusion: one digital and two financial. In terms of bank account ownership, only 12% of respondents indicated having access to a bank account48, while
44% hold an account in a non-bank financial institution, such as a microfinance organization. On the other hand, all of the farmers surveyed own a mobile phone, though only 2% have household-level access to internet. The household-level of digital inclusion, measured by phone ownership, is especially significant given the fact only 58% of survey participants have electricity in their homes.
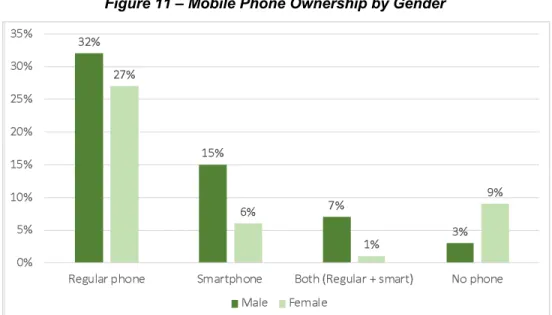
Despite high digital inclusion overall, disparities persist. As figure 11 shows, women are more likely not to own a mobile phone, especially a smartphone. SHFs are also more likely not to have a mobile phone (16%) relative to non-SHFs (> 2 Ha, 9%). From a policy and programmatic perspective, this suggests the need for targeted interventions among these populations to improve digital inclusion more broadly, in addition to digital financial inclusion.
Figure 10 – Comparative Levels of Financial Inclusion vs. Digital Inclusion
48 Such a low number may be an artifact of the collective nature of financial access among SHFs: most finance their agricultural activities through loans and credit secured at the cooperative-level, not individually.
24 Figure 11 – Mobile Phone Ownership by Gender
3.2.2. Barriers to adoption: Unclear value proposition and “fit” among non-users
Figure 12 provides evidence on the barriers to DFS use among SHF non-users (18% of our sample), while Figure 13 shows possible avenues to address some of those barriers. Nearly half of DFS non-users said that they did not know how DFS works, suggesting that the mechanics of using a phone and financial services remain a large impediment to adoption. Of those SHF DFS non-users who said they did not know how DFS works, 68% were women (39% were women 40 or older). The second largest barrier was a perceived lack of usefulness (36%), followed by not having enough money to use DFS (30%). Of those who stated that DFS is not useful for them, 78% were women (50% were women 40 or older). These results corroborate findings from previous research49,50. When asked what it would take to begin using DFS, common reasons
concerning the benefits of DFS, such as safety, convenience, and reliability, did not seem to resonate.
49 World Bank. (2017). The Global Findex Database: Measuring Financial Inclusion and the Fintech Revolution, pp. 39-41.
50 CGAP. (2017). Understanding the Demand for Financial, Agricultural, and Digital Solutions from Smallholder Households: Insights from the Household Survey in Uganda.
25 Figure 12 – Barriers to DFS Use Among SHF Non-Users
Figure 13 – Response to “What would it take for you to start using DFS?”
Taken together, these results speak to a perception among non-users that DFS does not “fit” into their lives— that DFS are not designed with them in mind. The value proposition has yet to be demonstrated, an area where policymakers, service providers, and donors alike can play a role.
26
3.2.3. Supply-side perceptions of demand-side needs and attitudes are not always accurate
In some cases, supply-side respondents and SHFs aligned closely in their responses to the mirror surveys, such as in their assessments of self-efficacy (see Figure 25 in Section 3.3.4). In other cases, however, responses diverged. Figure 14 shows that lack of bank account ownership is dominated by a (perceived) lack of having enough money among SHFs. Relative to SHFs, supply-side respondents overstate understanding how FS work and their cost, the distance of banks from members, people’s lack of trust in banks, and the usefulness of a bank account. Supply-side actors underestimated how long it took SHFs to start using DFS after they heard about it—54% of supply-side respondents thought it took SHFs less than a year while 65% of SHFs self-reported taking more than one year to adopt from when they first heard about it. This was especially pronounced in the Saloum region, where 69% of SHFs in the study said it took more than a year to adopt DFS from the time that they first heard about it (59% of SHFs in the study from the Senegal River Valley). The implication is that supply-side actors may potentially be undervaluing the amount of time and resources it takes to convert a DFS non-user to a user.
The more general point here is that the mental models and beliefs that supply-side actors hold regarding the needs and attitudes of farmers can impact the kinds of products and services they provide and promote. If these perceptions are misaligned, supply-side actors will not present SHFs with products relevant to their wants or needs.
27
3.2.4. DFS service package preferences differ somewhat by gender and age but not by region
Figure 15.1 shows the conjoint results for the entire demand-side sample, while Figure 15.2 and Figure 15.3 disaggregate this result by gender and age. Overall, SHFs prefer phone/app use to relying on agents (the strongest preference), individual to group memberships, existing to new memberships, lower fees to airtime bonuses, and better security to better transaction success rates. Men and women share largely the same preferences, though men’s preference for individual membership is far stronger than women’s. In terms of age, older adults (25 and above) prefer service provision from an organization of which they are already a member, whereas young adults 18-24 prefer joining a new organization. Preferences by region, northern versus central Senegal, are similar and bear no statistical difference.
28 Figure 15.2 – Conjoint Results, Demand Sample, by Gender
29 These results have several implications for promoting DFS among SHFs in Senegal. The first is that, at least among our sample, a broad-based consensus of the value proposition for DFS delivery exists. In terms of scaling, this is welcome news. Yet, special attention will need to be paid to the varying preferences among certain market segments, such as women and young adults. Among women, while preferring individual memberships to group memberships, they may need more convincing to do so than men. In terms of age, organizational loyalty may not be a high barrier to adoption for young adults,51 which is good news for new market entrants into the
DFS sector.
3.2.5. The type of DFS should inform program design
Figure 16 disaggregates the conjoint results by the FS that SHFs wanted digitized the most. For instance, those SHFs that wanted insurance digitized prefer an agent and group membership. One plausible explanation for this preference is that, because insurance is a relatively complex concept with low use among risk-averse groups like SHFs, those who may want to use it value greater access to people who can assist them, whether they be agents or other SHFs.
These results support the notion that while the service itself is important, it is equally important to tailor delivery to the needs and preferences of the targeted users. In our case, program features for different DFS will likely require programmatic customization. This is also likely linked to differences among the market segments who prefer each DFS and seems especially true when differentiating between DFS 1.0 (transfers and payments) and DFS 2.0 (savings, credit, and especially insurance) use cases.
51 This makes sense, given that younger adults have had less time to build organizational loyalty, and are also likely to be less risk-averse and willing to try new things than older adults.
30 Figure 16 –Conjoint Results, Demand Sample, by Preferred FS to Digitize
3.2.6. Supply-side perceptions of DFS service package preferences differed from SHF-reported preferences
Figure 17 shows how supply-side perceptions of demand-side preferences stack up. For the access and reliability attributes, supply-side respondents thought SHFs preferred the level opposite of what they self-reported. In the case of the account type attribute, even though supply-side respondents correctly thought SHFs prefer individual memberships, the difference in the magnitude of the preferences was statistically significant.
Disaggregating the supply-side results by gender and age yield further interesting findings. In some instances, male supply-side respondents’ perceptions of SHF preferences were more misaligned than women’s. Likewise, the perceptions of older supply-side respondents were more misaligned than younger respondents.
These findings provide further evidence of the value in supporting efforts aimed at aligning supply-side perceptions with demand-supply-side needs and preferences.
31 Figure 17 – Conjoint Results, Demand- and Supply-Side Comparison
3.3. Preliminary Results of the Comparative Analysis: Four Key Comparative Findings between Guatemala and Senegal
In addition to the results specific to Senegal, the study also produced additional findings based on the comparison between the data produced in Guatemala and the survey conducted in Senegal. The four findings are: 1) Digitizing government benefits can help improve government-SHF relations; 2) the nature of historical exposure to the banking sector may impact digital inclusion efforts; 3) trust in the financial system seems to be key to DFS adoption; and 4) supply-side participants may have assumptions and beliefs about SHF behavior that may adversely affect DFS interventions. As mentioned in the beginning of this report, notwithstanding their different historical, social, and geographical characteristics, there are some structural aspects that make such a comparison useful for both countries - as a reference against which they can assess their own performance. For example, the presence of a large population of low-income smallholder farmers encouraged local and international agencies to promote DFS as a scalable path for financial inclusion in both countries.52 Yet, their experiences defied expectations about DFS
adoption for opposite reasons. Guatemala, which in theory had all the preconditions for a successful expansion of DFS, has struggled to expand DFS adoption and use (see Table 8). Senegal, on the other hand, has made substantial progress in the last decade, despite much lower socioeconomic conditions and weaker digital and financial infrastructure (see Table 9). Such apparent contradiction indicates that the expansion of DFS use among smallholder farmers may be influenced, but not entirely determined by the pre-existing social, economic, and political contexts of each country.
32 Table 8 – Selected Socioeconomic and DFS Infrastructure Indicators for Guatemala and Senegal 53
Selected Indicators Year Guatemala Senegal
Socio-economic indicators
Population (Total), in millions 2017 16. 9 15.9
Population (Rural), in millions 2017 8.3 8.4
GDP per capita, PPP (current international $) 2017 8,150 2,712
Poverty headcount ratio at $3.20 a day (2011 PPP) (% of population)
2014/2011 24.0 67.0
Literacy rate, adult total (% of people ages 15 and above) 2013 77.0 43.0 Access to electricity, rural (% of rural population) 2016 86.0 38.0 Digital Infrastructure Indicators
Secure Internet servers (per 1 million people) 2017 68.2 8.6
Mobile cellular subscriptions (per 100 people) 2017 118.0 99.0
Fixed broadband subscriptions (per 100 people) 2016 3.1 0.6
Financial Infrastructure Indicators
Credit registry coverage (% of adults) 2018 17.5 0.6
Commercial bank branches (per 100,000 adults) 2016 33.0 5.0
Automated teller machines (ATMs) (per 100,000 adults) 2016 36.0 6.0
33 Table 9 – Selected DFS Indicators for Guatemala and Senegal54
Selected Indicators Year Guatemala Senegal
Mobile Money account ownership, Total (% age 15+) 2017 2.1 20.9
Mobile Money account ownership, Rural (% age 15+) 2017 1.7 19.5
Sent or received domestic remittances through a mobile phone (% age 15+) 2017 1.1 31.0 Used a mobile phone or the internet to access an account, Total (% age 15+) 2017 4.5 29.4 Used a mobile phone or the internet to access an account, Rural (% age 15+) 2017 4.1 26.3 Used the internet to pay bills in the past year, Total (% age 15+) 2017 4.0 9.0 Used the internet to pay bills in the past year, Rural (% age 15+) 2017 3.1 5.1
As a way to confirm the validity of the comparison between the two countries, Figure 18 tries to replicate the patterns described in Tables 7 and 8, using data from the study sample (see Table 10 for details of the sample in each country). The numbers show that, indeed, similar conditions were identified among the SHFs interviewed in both countries. Bank account ownership in Guatemala (47%) is significantly higher than in Senegal (12%), although Senegalese SHFs reported having more accounts in non-financial institutions (such as microcredit) when compared to Guatemalans (44% and 25%, respectively). In terms of digital inclusion, the proportion of Guatemalan SHFs who have a mobile phone is slightly higher than their Senegalese counterparts (91% and 88%). Finally, DFS use in Senegal among the survey participants is more than two times what observed in Guatemala (82% and 39%).