Activator
Spa Influences Its Pattern of Expression and Has
Pleiotropic Effects on Grain Protein Composition,
Dough Viscoelasticity, and Grain Hardness
[W][OA]
Catherine Ravel1, Pierre Martre1*, Isabelle Romeuf, Mireille Dardevet, Redouane El-Malki2, Jacques Bordes, Nathalie Duchateau, Dominique Brunel, Franc¸ois Balfourier, and Gilles Charmet
INRA, UMR1095, Genetics, Diversity, and Ecophysiology of Cereals, F–63100 Clermont-Ferrand, France (C.R., P.M., I.R., M.D., J.B., N.D., F.B., G.C.); Blaise Pascal University, UMR1095, Genetics, Diversity, and Ecophysiology of Cereals, F–63170 Aubiere, France (C.R., P.M., I.R., M.D., J.B., N.D., F.B., G.C.); INRA, UR1279 Etude du Polymorphisme des Ge´nomes Ve´ge´taux, F–91057 Evry, France (R.E.-M., D.B.); and Commissariat a` l’Energie Atomique, Institut de Ge´nomique, Centre National de Ge´notypage, F–91057 Evry, France (R.E.-M., D.B.)
Storage protein activator (SPA) is a key regulator of the transcription of wheat (Triticum aestivum) grain storage protein genes and belongs to the Opaque2 transcription factor subfamily. We analyzed the sequence polymorphism of the three homoeologous Spa genes in hexaploid wheat. The level of polymorphism in these genes was high particularly in the promoter. The deduced protein sequences of each homoeolog and haplotype show greater than 93% identity. Two major haplotypes were studied for each Spa gene. The three Spa homoeologs have similar patterns of expression during grain development, with a peak in expression around 300 degree days after anthesis. On average, Spa-B is 10 and seven times more strongly expressed than Spa-A and Spa-D, respectively. The haplotypes are associated with significant quantitative differences in Spa expression, especially for Spa-A and Spa-D. Significant differences were found in the quantity of total grain nitrogen allocated to the gliadin protein fractions for the Spa-A haplotypes, whereas the synthesis of glutenins is not modified. Genetic association analysis between Spa and dough viscoelasticity revealed that Spa polymorphisms are associated with dough tenacity, extensibility, and strength. Except for Spa-A, these associations can be explained by differences in grain hardness. No association was found between Spa markers and the average single grain dry mass or grain protein concentration. These results demonstrate that in planta Spa is involved in the regulation of grain storage protein synthesis. The associations between Spa and dough viscoelasticity and grain hardness strongly suggest that Spa has complex pleiotropic functions during grain development.
Proteins are the most important components of wheat (Triticum aestivum) grain governing its end-use value. Grain storage protein (GSP) composition is known to determine dough cohesiveness and visco-elasticity (reviewed by Weegels et al., 1996), with highly elastic (strong) dough being suited for making bread and more extensible (weak) dough being suited for making cakes and biscuits. The most abundant GSPs in wheat are the gluten-forming gliadins and glute-nins, which account for 60% to 80% of total grain protein. Gliadins are a mixture of monomeric proteins classed into four subgroups based on their amino acid sequences and molecular weights (MWs; Wieser, 2007).
Glutenins are composed of high-molecular-weight (HMW-GS) and low-molecular-weight (LMW-GS) sub-units, which form very large macropolymers during grain desiccation (Don et al., 2006). It is generally ac-cepted that glutenins have a prominent role in strength-ening wheat dough by conferring elasticity, while gliadins contribute to the viscous properties of dough by conferring extensibility.
Because of the central role of GSP in determining dough processing properties, the loci coding for these proteins have been extensively studied. Analysis of alleles at the 12 main GSP loci revealed a high level of genetic and biochemical diversity (Zhang et al., 2003, 2004; Ravel et al., 2006b), and direct relationships have been described between allelic variations at these loci and dough pro-cessing properties (Branlard et al., 2001; Be´ke´s et al., 2006). This information is now used in most wheat breeding programs. Significant quantitative genetic variations in GSP composition have also been reported for wheat (Graybosch et al., 1996; Huebner et al., 1997). However, only a few quantitative trait loci have been identified (Guillaumie et al., 2004; Charmet et al., 2005; Ravel et al., 2006c), and so far no gene or allele controlling natural variations in GSP composition has been identified.
1These authors contributed equally to the article.
2Present address: INRA, UR588 AGPF, F–45075 Orle´ans, France.
* Corresponding author; e-mail pierre.martre@clermont.inra.fr. The author responsible for distribution of materials integral to the findings presented in this article in accordance with the policy described in the Instructions for Authors (www.plantphysiol.org) is: Catherine Ravel (catherine.ravel@clermont.inra.fr).
[W]
The online version of this article contains Web-only data.
[OA]
Open Access articles can be viewed online without a sub-scription.
www.plantphysiol.org/cgi/doi/10.1104/pp.109.146076
Plant PhysiologyÒ, December 2009, Vol. 151, pp. 2133–2144, www.plantphysiol.orgÓ 2009 American Society of Plant Biologists 2133
The synthesis of GSPs during grain filling is con-trolled by several mechanisms, including transcrip-tional and posttranscriptranscrip-tional modifications, but it is generally thought that GSPs are primarily regulated through a network of interacting transcription factors (TFs; Verdier and Thompson, 2008). Three important cis-motifs are conserved in GSP promoters from wheat, barley (Hordeum vulgare), maize (Zea mays), and rice (Oryza sativa). These are the GCN4-like motif (GLM) and the prolamin box (PB), which together constitute the endosperm box (EB; Colot et al., 1989), and the AACA motif (Zheng et al., 1993). The PB and the AACA motif confer endosperm-specific expression (Colot et al., 1987; Yoshihara et al., 1996), whereas GLM is thought to play a role in the nutritional regulation of prolamin gene expression (Mu¨ller and Knudsen, 1993). Several TFs have been reported to specifically interact with the EB and the AACA motif. PBF (for prolamin box-binding factor) and SAD (for scutellum and aleurone-expressed DOF) are DOF (for DNA binding with one finger) TFs that interact with PB (Vicente-Carbajosa et al., 1997; Dong et al., 2007), while GAMYB, a gibberellic acid-dependent MYB TF, binds to the AACA motif (Mena et al., 1998). The GLM motif is recognized by basic Leu zipper (bZIP) TFs of the Opaque2 subfamily, called SPA in wheat (Albani et al., 1997). In wheat, single copies of Spa, Gamyb, and Pbf are present on the homoeologous group 1 (Guillaumie et al., 2004), 3 (Haseneyer et al., 2008), and 5 (Ravel et al., 2006a) chromosomes, respectively. Additional TFs have been identified in barley. Two regulatory proteins from the R1MYB family, MCB1 (for Myb-related CAB promoter-binding protein) and MYBS3, interact with the GA response complex and are involved in the transcriptional regulation of GSPs (Rubio-Somoza et al., 2006a, 2006b). Recently, Moreno-Risueno et al. (2008) reported the role of a B3-type TF (FUSCA3) binding to the RY box in the regulation of GSP genes. Full activation of GSP genes is achieved by the synergetic interaction of different TF combinations, suggesting that they are part of a regulatory network. Supporting this, complex mutual interactions through the formation of binary or ternary complexes mediated by PBF or other DOF proteins have been demonstrated for several of the TFs described above (Rubio-Somoza et al., 2006a, 2006b; Yamamoto et al., 2006). In maize, Opaque2 has strong pleiotropic effects on grain size and composition and is thought to be pivotal in carbon allocation and amino acid synthesis during grain de-velopment (Hunter et al., 2002; Manicacci et al., 2009).
In wheat, the regulation of GSP gene expression by SPA has been established in vitro and in vivo in tobacco (Nicotiana tabacum) and maize leaf protoplast only for a LMW-GS gene (Conlan et al., 1999). The GLM motif is well conserved in all the prolamin genes analyzed so far (Halford and Shewry, 2007), so it is possible that SPA also regulates the expression of other wheat GSP genes. This needs to be experimentally confirmed for each GSP gene, since in maize Opaque2 appears to regulate the Z22 class of a-zeins specifically,
despite the EB being present in other groups of zein genes.
Grain protein composition was one of the main targets in the genetic modification of wheat in the late 1990s, with the focus on the overexpression of HMW-GS (Blechl and Anderson, 1996) and LMW-HMW-GS (Masci et al., 2003), and more recently on the silencing of g-gliadins (Gil-Humanes et al., 2008). An alternative strategy to modify grain protein composition would be to alter the transcriptional network regulating GSP gene expression. While it remains to be demonstrated whether variations in GSP transcriptional activators affect GSP composition and dough viscoelasticity, a recent genetic association study showed that natural polymorphism in maize Opaque2 is associated with grain Lys content (Manicacci et al., 2009).
Environmentally induced changes in GSP composi-tion are associated with the altered expression of genes encoding GSPs in response to signals that indicate the relative availability of nitrogen and sulfur (Peak et al., 1997; Chiaiese et al., 2004; Hernandez-Sebastia et al., 2005). These signals trigger transduction pathways in developing grains that, in general, balance the storage of nitrogen and sulfur to maintain a homeostasis of the total amount of protein per grain (Tabe et al., 2002; Islam et al., 2005). It is emerging that these regulatory networks, still poorly understood at the molecular level, result in allometric relationships between the quantity of nitrogen per grain and the quantity of the different GSPs (Sexton et al., 1998; Triboi et al., 2003). So the gene regulatory network involved in the control of GSP synthesis is coordinated such that the grain reacts predictably to nitrogen availability, giving rise to a metamechanism at the level of the grain (Martre et al., 2003). Changes in the expression of Spa might allow a shift in grain nitrogen allocation and therefore modify the GSP composition independently of grain protein concentration.
In this study, we tested this hypothesis by investi-gating the nucleotide polymorphism of the three homoeologous copies of Spa, paying special attention to their 5# flanking sequences. The expression of each Spa homoeolog was analyzed with respect to the native haplotypes detected for the promoter. The rela-tionships between Spa haplotypes and GSP composi-tion were analyzed. Finally, the genetic relacomposi-tionship between Spa promoter haplotypes and dough visco-elastic properties was assessed in an association study. The associations between Spa polymorphisms and grain hardness were also analyzed.
RESULTS
The Promoter ofSpa Shows a High Level
of Polymorphism
To assess the nucleotide diversity (p) of wheat Spa loci, Spa genes were amplified and sequenced from 42 wheat accessions sampled from the INRA worldwide core collection with the aim of maximizing the
sity observed (Supplemental Table S1; Balfourier et al., 2007). The length of the consensus sequence for the three homoeologs is between 4,708 and 6,750 bp and starts 1,009 to 2,382 bp upstream of the start codon. Based on the bacterial artificial chromosome se-quences, the consensus sequences for Spa-A, Spa-B, and Spa-D, the three homoeologous copies of Spa, terminated 63 and 98 bp upstream and 218 bp down-stream of the stop codon, respectively. The pairwise comparison between each SPA homoeologous protein showed that they are very similar (.93%).
For Spa-A, we detected 41 single nucleotide poly-morphisms (SNPs), representing on average one mu-tation every 134 bp (Supplemental Fig. S1A). Twenty percent of the SNPs were found in only one accession (singleton). Twenty-seven SNPs are located upstream of the start codon, and three are in either exon 1 or 6. The two SNPs in exon 6 are nonsynonymous (they lead to amino acid changes). One SNP in the first intron modifies the splicing site. We also observed six insertion-deletion polymorphisms (indels), all of them in noncoding regions. The longest indel also contained one SNP.
We found 40 SNPs for Spa-B (i.e. an average of one SNP every 118 bp; Supplemental Fig. S1B). Thirteen are upstream of the start codon and six are in exons 1, 2, or 6. The three SNPs in exon 1 and the distal one in exon 6 are nonsynonymous. The most significant change at the protein level is likely to be the G/C change in exon 1 that creates a stop codon (Guillaumie et al., 2004). Of the four indels found, one is upstream of the translation start site (276 bp long; it includes two SNPs) and the others are in introns.
Spa-D contained 106 mutations (eight are singletons; i.e. an average of one SNP every 64 bp; Supplemental Fig. S1C), 44% of which are in the 5# flanking region. Of the 21 SNPs in the coding sequence, 12 were nonsynonymous. We also found 14 indels, all but one in noncoding regions. The two longest indels (173 and 214 bp long) are upstream of the translation start site. Annotation of the start site was complicated, as in some cases it was interrupted by a 21-bp indel.
Most of the mutations in the A, B, and D homoeo-logs (72.5%, 57%, and 68%, respectively) are transi-tions. The p value averaged 0.00183 and is 1.5 and 1.8
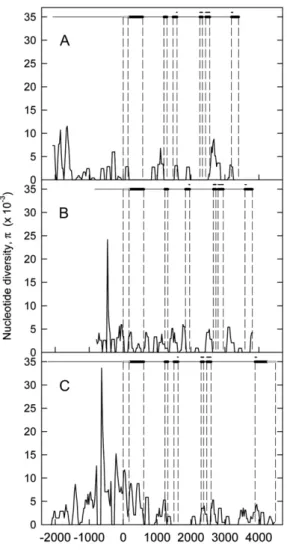
times higher for Spa-D than for Spa-B and Spa-A, respectively (Table I). The p value of Spa-D was particularly high in the coding region compared with Spa-B and Spa-A. The profiles of diversity for each homoeolog showed several similarities (Fig. 1). The highest p values were observed in the promoter, with a mean value of 0.0031. The bZIP domain, which spanned from exon 3 to exon 6, was highly conserved and contained no polymorphism in Spa-A and Spa-B and three SNPs, two synonymous plus one nonsynony-mous, in Spa-D. The basic region was perfectly con-served, but there are five amino acid changes in the Leu zipper domain (Fig. 2). One of these changes is at the position of an important hydrophobic residue in Spa-D. However, as it corresponds to the substitution of a hydrophobic residue (Ala) by another hydrophobic res-idue (Val), the functional consequences may be minimal.
The Three HomoeologousSpa Copies Show a High Level
of Intragenic Linkage Disequilibrium
The haplotype diversity is 1.9- and 2.4-fold higher for Spa-A than for Spa-B and Spa-D, respectively (Table I). Nine, seven, and six haplotypes were identified for Spa-A, Spa-B, and Spa-D, respectively. For each homoe-olog, we observed two main haplotypic groups of unequal size. For Spa-A and Spa-B, these two groups mostly reflect differences between the European and Asian accessions (Supplemental Fig. S2, A and B). For Spa-A, the European haplotypic group was subdivided into two main haplotypic groups with similar fre-quencies. This organization explains why the haplo-type diversity value found for this gene was so high. For Spa-D, all but five accessions belonged to the same haplotypic group (Supplemental Fig. S2C). The second group consisted of genotypes from near Eastern and southeast European countries and Central America, all belonging to haplotype 2.
To determine intragenic linkage disequilibrium (LD), we calculated mean square allele frequency correlation (r2) values and determined the number of significant pairwise comparisons using Fisher’s exact test (Table II). The level of LD was high along each homoeologous sequence. For Spa-A, Spa-B, and Spa-D, 38%, 26%, and 96%, respectively, of the pairs of sites
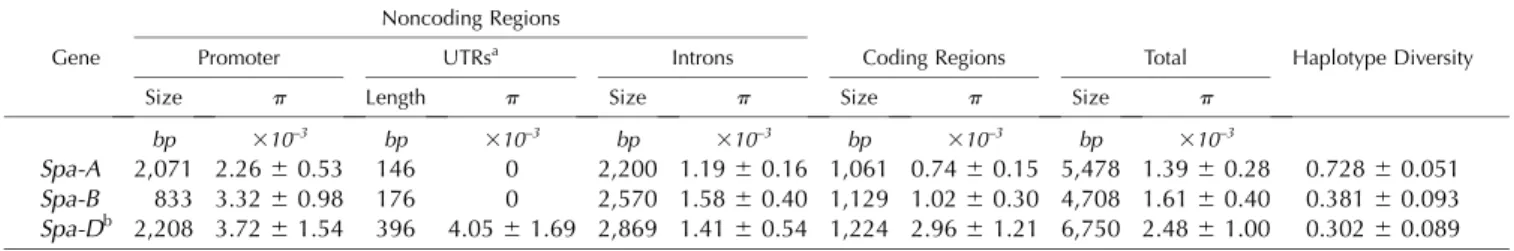
Table I. Diversity statistics for Spa homoeologs and their 5# flanking sequences for 42 accessions of hexaploid wheat sampled from the INRA worldwide core collection
Nucleotide diversity (p) and haplotype diversity values are means6 1SD.
Gene
Noncoding Regions
Haplotype Diversity
Promoter UTRsa Introns Coding Regions Total
Size p Length p Size p Size p Size p
bp 310–3 bp 310–3 bp 310–3 bp 310–3 bp 310–3
Spa-A 2,071 2.266 0.53 146 0 2,200 1.196 0.16 1,061 0.74 6 0.15 5,478 1.39 6 0.28 0.7286 0.051
Spa-B 833 3.326 0.98 176 0 2,570 1.586 0.40 1,129 1.02 6 0.30 4,708 1.61 6 0.40 0.3816 0.093
Spa-Db 2,208 3.726 1.54 396 4.056 1.69 2,869 1.41 6 0.54 1,224 2.96 6 1.21 6,750 2.48 6 1.00 0.3026 0.089 aFor Spa-D, UTRs include the 5# and 3# sequences; for Spa-A and Spa-B, no sequences were obtained for the 3# UTR, so UTRs correspond to the 5# UTR only. bNucleotides distal to the 3# UTR (53 nucleotides) were not taken into account in the calculation for noncoding regions.
were in complete LD. LD analysis confirmed the organization of polymorphic sites into a few haplo-types. In Spa-A, only 4% of polymorphic sites were in low LD (r2, 0.2; Table II). For Spa-B and Spa-D, all the sites were in high LD. These results indicated that the analysis of just one polymorphic site per gene can be used to distinguish between the main haplotypic groups. An additional SNP can be used to distinguish between the two haplotypes of Spa-A that constitute the largest haplotypic group (Supplemental Fig. S2A). Spa Polymorphisms Are Associated with
Dough Viscoelasticity
Based on the above results, we chose a single site per homoeolog for genotyping the core collection,
result-ing in two haplotypes per Spa homoeologous copy (Supplemental Table S1). For Spa-A and Spa-D, we genotyped indels 147 to 108 bp (ins3) and 21 to 1 bp (ins6) 5# to the untranslated region (UTR), respectively (Supplemental Fig. S1, A and C). For these two homoeologs, all the lines characterized by the deletion were assigned as haplotype 1 of the promoter. For Spa-B, we genotyped a nonsynonymous G/C mutation in the first exon (SNP 14 in Supplemental Fig. S1B). Haplotype 1 was characterized by the G allele. The six haplotypes were genotyped for the 372 accessions of the core collection to study their effects on average single grain dry mass, grain protein content and concentration, dough viscoelasticity, and grain hard-ness. To avoid false positives, the genetic structure of the core collection was taken into account as a co-variate.
None of the markers genotyped was associated with the average single grain dry mass, the quantity of protein per grain, or the grain protein concentration (Table III, model I). However, we found significant associations at 1% between the markers and alveo-graph parameters. The polymorphism of the Spa-A promoter was highly significantly associated with dough tenacity (P), extensibility (L), and grain hard-ness. On average, L was 1.4 times higher for haplotype 1 than for haplotype 2, while P of haplotype 1 was only 74% that of haplotype 2. In good agreement with this, we found no significant effect of Spa-A haplotypes on dough strength (W). For Spa-D, haplotype 2 (insertion) increased P, W, and grain hardness by 28%, 47%, and 29%, respectively. Although not significant for Spa-B, the haplotypes at the three loci with the lower level of Spa transcripts had harder grain textures than the haplotypes with the higher level of Spa transcripts (Table III, model I). Grain hardness was positively correlated with P and W (r2 = 0.63 and 0.49, respec-tively; both P, 0.0001) but not with L (r2= 0.073; P = 0.161). Once grain hardness was introduced in the general linear model as a covariate (Table III, model II), Spa-B and Spa-D polymorphism was no longer asso-ciated with dough viscoelasticity. However, this con-firmed the significant effect of Spa-A on L.
Spa Polymorphism Changes Its Level of Expression during Grain Development
In wheat, under normal growing conditions GSPs accumulate linearly between 250 and 700 degree days (°Cd) after anthesis (Triboi et al., 2003). We quantified the expression of each Spa gene (homoeologs and haplotypes) by quantitative reverse transcription (qRT)-PCR. No transcript was detected in the ovary (Fig. 3). Between 150°Cd and 400°Cd after anthesis, transcripts of the three Spa homoeologs were detected in all the accessions studied. In all the accessions, the transcript levels of Spa-B were significantly higher than those of Spa-A and Spa-D (fold differences in transcript levels ranged from 3.1 to 31.0, and the median fold differences in transcript abundance
Figure 1. Nucleotide diversity (p) of Spa genes of wheat. The average number of nucleotide differences per bp between sequences, p, in Spa genes are represented using the sliding-window approach (step size of 25 bp, window size of 100 bp) for the A (A), B (B), and D (C) genomes of hexaploid wheat. The structures of the Spa genes are given above each plot. The gray and black boxes show the UTRs and the coding exons, respectively. The positions of the functional bZIP domains are shown above the exons by black lines.
were 9.8 for Spa-B versus Spa-A and 6.9 for Spa-D versus Spa-A). The promoter haplotypes for Spa-A and Spa-D were associated with significant quantitative differences in transcript levels, but their patterns of expression were similar (Fig. 3, A and C). Spa-A transcript levels peaked at 300°Cd and were on aver-age 2.9 times higher for haplotype 1 than for haplotype 2 (Fig. 3A). During early to mid grain filling, Spa-D transcripts were maintained at a more constant level than Spa-A and Spa-B transcripts (Fig. 3C). For Spa-D, the transcript levels were on average 2.5 times higher for haplotype 1 than for haplotype 2. For haplotype 1, the peak in transcript accumulation was 50°Cd later and the peak value was 1.3 times higher than for haplotype 2.
Nucleotide Polymorphism in theSpa-A Promoter Affects
How Much Grain Nitrogen Is Allocated to Gliadins The protein composition of mature grains was an-alyzed for 20 accessions representing the different combinations of Spa haplotypes (Supplemental Table S2). The total quantity of nitrogen per grain varied 2-fold across all accessions (0.54–1.09 mg grain21). There was no significant effect of Spa-B and Spa-D haplotypes on the relationship between the quantity of each protein fraction and the total quantity of nitrogen per grain or on the gliadin-to-glutenin ratio (data not shown). However, clear differences were observed between Spa-A haplotypes in the allocation of grain nitrogen to the nonprolamin and gliadin protein frac-tions. The scaling exponent (aRMA) of the
nonprolamin-to-total nitrogen relationship was not significantly different (P = 0.626) for the two haplotypes (Fig. 4A), with a common fitted slope of 1.000 (95% confidence interval [CI] = 0.906–1.096). Therefore, the quantity of nonprolamin proteins varied in direct pro-portion to the total quantity of nitrogen. The allometric constant was significantly higher (P , 0.001) for the accessions with the deletion in the Spa-A promoter (haplotype 1; Supplemental Table S3), meaning that for any given quantity of total nitrogen per grain, haplo-type 1 contained more nonprolamin proteins than haplotype 2. The scaling exponent of the gliadin-to-total nitrogen relationship was significantly higher than 1 for both haplotypes, indicating that gliadins varied disproportionally with the total quantity of nitrogen. Most interestingly, the scaling exponent was signifi-cantly higher (P = 0.029) for haplotype 1 (aRMA= 1.607; 95% CI = 1.245–2.074) than for haplotype 2 (aRMA = 1.140; 95% CI = 1.014–1.281). The allometric parameters of the glutenin-to-total nitrogen relationship were sim-ilar for the two haplotypes, and the common scaling exponent was not significantly different from one aRMA = 0.962 (95% CI = 0.8603–1.0752; Fig. 4C). As a consequence, the scaling exponents of the gliadin-to-glutenin relationship were significantly different for the two haplotypes (Fig. 4C, inset) and were very close to that estimated for the gliadin-to-total nitrogen relation-ship (Supplemental Table S3). The average gliadin-to-glutenin ratio was significantly higher (P, 0.001) for haplotype 2 (0.746 0.04) than for haplotype 1 (0.55 6 0.07), independent of the total quantity of nitrogen per grain.
Figure 2. Alignment of amino acid sequences of the basic and Leu zipper domains of the three homoeologous SPA proteins. All haplotypes of the A and B homoeologs give identical amino acid sequences. SPA-D corresponds to the sequence of all the haplotypes of the D homoeolog except haplotype 2 (SPA-D_hap2). Asterisks indicate perfectly conserved amino acids, colons indicate strongly conserved amino acids, and periods indicate weakly conserved amino acids. Leu residues and hydrophobic amino acids are shown in boldface.
Table II. Linkage disequilibrium within Spa homoeologs
Parameter Spa-A Spa-B Spa-D
No. of polymorphic sitesa 36 23 102
No. of pairwise comparisons 630 253 5,151
Mean r2 0.733 0.715 0.992
No. of r2= 1 239 67 4,955
No. of 0.6, r2, 1 274 107 196
No. of r2, 0.2 28 0 0
No. of nonsignificant r2values (P. 0.001) 101 0 0
aAll the sites used for LD computation after filtering (rare allele frequency. 0.05 and number of data per polymorphic site$ 40).
DISCUSSION
Here, we demonstrate the high level of sequence diversity in the Spa genes of wheat. The many poly-morphisms found in the promoter regions lead to differential expression during grain development of the haplotypes identified. The germplasm analyzed here included accessions from different geographical origins and represents a wide range of the natural diversity of wheat (Balfourier et al., 2007; Horvath et al., 2009). Significant associations were found be-tween the alleles identified and dough viscoelasticity and grain hardness. Spa-A allelic variation also has a significant effect on the allocation of grain nitrogen to gliadin protein fractions and on the gliadin-to-glutenin ratio. As the translated sequences indicate that SPA amino acid sequences are highly conserved, we hy-pothesized that the associations detected can be ex-plained by the observed differences in Spa expression.
TheSpa Promoter Shows a High Level of
Nucleotide Polymorphism
When the three wheat genomes were considered together, we found on average one SNP every 91 bp, with a p value of 0.00183. A shorter sequence of Spa-B (2,858 bp) in a set of 27 accessions (Ravel et al., 2006b)
was shown to have a similar level of polymorphism. The three homoeologous copies of Spa were more polymorphic than has been reported for structural wheat genes (Ravel et al., 2006b). Moreover, in Spa genes, there was twice as much p in the promoter region as in the coding region, and the DNA-binding domain sequences were almost completely conserved. Such modular structures have previously been reported for other TFs (Purugganan and Wessler, 1994; Henry et al., 2005). It has been proposed that modification of the cis-regulatory regions of TFs is a predominant mode by which plant form and function evolve (Doebley and Lukens, 1998).
Spa showed a much higher level of polymorphism than other wheat TFs from different families, such as Pbf (Ravel et al., 2006a, 2006b) and Gamyb (Haseneyer et al., 2008). The translated sequences of Spa revealed few amino acid differences between homoeologs and haplotypes. The fact that the high rate of nucleotide polymorphism was associated with a very low rate of variation at the protein level might indicate that these genes are under strong constraints that limit changes to the protein sequence. The high level of intragenic LD observed for the three homoeologs suggests a low frequency of intragenic recombination consistent with the above hypothesis. Conversely, the high p of Spa and promoters might result from selection pressure
Table III. Least square mean, P value, and percentage of the phenotypic variance explained by the polymorphism in Spa genes for the average single grain dry mass, the total quantity of protein per grain, grain protein concentration, dough tenacity (P), extensibility (L), and strength (W), and grain hardness
The general linear model (model I) comprised the main effect marker and five ancestor groups used as covariates. Model II was similar to model I but grain hardness was introduced as a covariate.
Physiological and Dough Functional Traits
Spa-A Spa-B Spa-D
Least Square Mean
r2 P
Least Square Mean
r2 P
Least Square Mean
r2 P Haplotype 1 (del) Haplotype 2 (ins) Haplotype 1 (G) Haplotype 2 (C) Haplotype 1 (del) Haplotype 2 (ins) Model I
Average single grain dry mass (mg dry mass grain–1)
39.61 41.19 0.3 0.2190 39.71 40.45 0.3 0.1997 39.998 40.63 0.1 0.4558
Total quantity of protein per grain (mg nitrogen grain–1)
1.003 1.056 0.4 0.1957 1.012 1.017 0.1 0.8237 1.015 1.020 0.1 0.466
Grain protein concentration
(mg protein g–1dry mass) 144.60 146.6 0.1 0.6102 143.0 145.3 0.4 0.1850 144.5 143.4 0.1 0.093
P (mm of water) 54.41 69.63 2.0 0.0050 55.88 60.43 0.9 0.0708 55.41 67.90 3.1 0.0001
L (mm) 128.41 98.95 2.0 0.0060 120.86 124.54 0.2 0.4551 123.98 118.62 0.1 0.495
W (10–4J) 185.15 189.52 0.1 0.8639 177.01 202.15 1.2 0.0310 177.94 239.12 1.3 0.0002
Grain hardness (dimensionless) 47.15 70.59 2.8 0.0005 49.92 55.48 0.8 0.0689 49.56 63.85 1.7 0.0017 Model II
Average single grain dry mass (mg dry mass grain–1)
39.65 41.03 0.2 0.2912 39.72 40.42 0.3 0.2317 40.01 40.48 0.1 0.5998
Total quantity of protein per grain (mg nitrogen grain–1)
1.012 1.033 0.1 0.6286 1.016 1.010 0.1 0.8068 1.017 1.004 0.1 0.5566
Grain protein concentration (mg protein g–1dry mass)
145.4 143.2 0.1 0.5530 145.6 142.2 0.9 0.0415 141.8 141.1 0.4 0.1546
P (mm of water) 56.62 59.95 0.1 0.4368 56.65 58.34 0.1 0.3926 56.18 61.56 0.5 0.0621
L (mm) 129.14 95.77 2.5 0.0022 120.98 124.22 0.1 0.5132 124.19 116.89 0.3 0.3296
W (10–4J) 194.04 150.63 0.7 0.0488 179.76 194.69 0.4 0.1456 180.94 214.73 1.0 0.0247
related to grain phenotypes associated with quantita-tive and/or spatiotemporal differences in their expres-sion. The main haplotypic groups for Spa-A, and to some extent for Spa-B, correspond to the two main
routes of migration of wheat from the Middle East (Feldman, 2001). The divergence of Spa-A and Spa-B promoter sequences between European and Asian accessions supports the hypothesis that adaptive di-vergence is responsible for the differentiation of the promoter between these geographical origins. It is generally observed that the level of diversity of the D
Figure 3. Expression of Spa-A (A), Spa-B (B), and Spa-D (C) versus thermal time after anthesis. Spa homoeolog expression of the different promoter haplotypes for seven genotypes of hexaploid wheat was analyzed by qRT-PCR. Each Spa homoeolog is characterized by two haplotypes. Insets show the data for Spa-A and Spa-D with an ex-panded x axis. Data are means6 2SEfor four independent replicates per genotype. The number of genotypes analyzed for each haplotype is
indicated in parentheses after the haplotype number. Figure 4. Grain storage protein composition of Spa-A haplotypes.Quantity of nonprolamin (A), gliadin (B), and glutenin (C) proteins versus the total quantity of nitrogen per grain for Spa-A haplotypes of hexaploid wheat. The inset in C shows the quantity of gliadins per grain versus quantity of glutenins per grain. Lines show linear regressions of log-transformed data for haplotypes 1 (solid lines) and 2 (dashed lines). Data are means6 2SEfor 2 years each analyzed in duplicate.
genome is lower than that of the A and B genomes (Ravel et al., 2006b; Chao et al., 2009). However, even when the promoter region was not considered, Spa-D showed a higher level of polymorphism than Spa-A and Spa-B. SNPs in Spa-D are organized in two main haplotypic groups, supporting the existence of at least two different origins of the D genome, as has already been proposed (Caldwell et al., 2004).
Spa Haplotypes Are Associated with Differences in Their Transcript Levels and Grain Storage Protein Composition It has been estimated that for between 20% and 29% of hexaploid bread wheat unigene loci, at least one homoeoallele is not expressed (Mochida et al., 2004; Bottley et al., 2006), and a uniform level of expression of all three homoeologs is only observed for about 20% of the genes (Mochida et al., 2004). Such gene silencing is characteristic of polyploid genomes and is tissue specific and developmentally regulated. Recent stud-ies suggest that many of these changes result from the formation of allopolyploids per se and are primarily the consequences of inherited epigenetic modifications (Bottley and Koebner, 2008; Pumphrey et al., 2009). The three copies of Spa were expressed during all the stages of grain development analyzed, and they showed similar patterns of expression. However, the level of Spa-B transcripts was on average 10 and seven times higher than those of Spa-A and Spa-D, respec-tively. Spa-B was expressed at a higher level than Spa-A and Spa-D in all the accessions analyzed, suggest-ing that these differences result either from early polyploidization-induced regulatory changes or from the parent donor of the B genome.
The pattern of expression of Spa reported here is in good agreement with the profile of expression ob-served in DNA microarray analysis (Wan et al., 2008) and is also consistent with a role of SPA in the transcriptional regulation of GSPs (Dupont et al., 2006; Wan et al., 2008). Significantly, polymorphisms at the three loci were associated with differences in Spa transcript levels. The correlation between observed changes in transcript levels and protein levels still needs to be established. Nucleotide polymorphisms observed in the promoter may affect regulatory cis-motifs leading to the observed modification in tran-script levels. A functional analysis of Spa promoters using promoter deletion/mutation experiments is needed to identify the cis-regulatory motifs involved in the transcriptional changes reported here.
The fact that Spa had broadly similar patterns of expression during early to mid grain filling regardless of the loci and haplotypes, along with the high level of conservation of SPA amino acid sequences, suggests that all these genes are functionally similar. However, differences in the allocation of grain nitrogen to dif-ferent protein fractions and in dough extensibility (L) when the grain hardness effect was removed were observed only for Spa-A haplotypes. These apparently contradictory results could be due to specific spatial
patterns of expression of the three Spa homoeologs in the endosperm, which might be related to the ob-served spatial regulation of GSP expression (Tosi et al., 2009). Spatial heterogeneity in Spa expression would complicate the interpretation of results obtained from whole endosperms.
The association study showed no effect of Spa hap-lotypes on average single grain dry mass or grain protein concentration. However, the analysis of the GSP composition of 20 accessions clearly showed changes in the allocation of grain nitrogen to the nonprolamin versus gliadin protein fractions associ-ated with Spa-A. In good agreement with this result, in maize, Opaque2 mutations are associated with less Lys-poor a-zein, which is compensated for by having more Lys-rich globulin and legumin-like storage pro-teins (Hunter et al., 2002; Gibbon and Larkins, 2005). Surprisingly, the absolute allocation of grain nitrogen to the gliadin protein fraction was higher in haplotype 2, which had fewer Spa-A transcripts, than in haplo-type 1. However, the scaling exponent of the gliadin-to-total nitrogen relationship was higher in haplotype 1 than in haplotype 2. This latter result suggests that the synthesis of gliadin is more responsive to nitrogen availability in haplotype 1 than in haplotype 2, in good agreement with the putative role of SPA in the nutritional regulation of GSP synthesis (Mu¨ller and Knudsen, 1993).
The lack of variation in the allocation of grain nitrogen to the glutenin protein fraction is also sur-prising, considering that it has been shown that Spa-B can activate the expression of a LMW-GS gene in both maize and tobacco leaf protoplasts (Conlan et al., 1999). These results may also be the consequence of the spatial regulation of expression of Spa. HPLC separation and quantification of glutenin subunits and gliadin protein classes could be used to determine if there are compensatory mechanisms between dif-ferent glutenin subunits and which gliadin classes are most affected by Spa-A haplotypes. A consequence of the invariable allocation of grain nitrogen to the glu-tenin protein fraction is that the gliadin-to-gluglu-tenin ratio increases disproportionally with the total quan-tity of nitrogen per grain. The fact that nucleotide polymorphisms at the Spa-A loci resulted in clear changes in the scaling relationship between gliadins and total nitrogen supports the hypotheses that SPA is part of a transcriptional regulatory network of GSP and that the scaling relationships analyzed here un-derlie the dynamics structuring this regulatory net-work.
Spa Polymorphism Is Associated with Grain Hardness and Dough Viscoelasticity
The association study showed that nucleotide poly-morphisms at Spa-A and Spa-D have a significant effect on grain hardness. The soft texture of Opaque2 mutants has been related to increased synthesis of g-zeins and differences in starch structure (Gibbon
et al., 2003; Gibbon and Larkins, 2005). Similar mod-ifications could be involved in the association reported here between Spa polymorphism and grain hardness. Differences in puroindoline gene expression may ex-plain the association between Spa and grain hardness. Although it is not associated with PB, a GLM motif is present in the promoter of PinA coding for the puro-indoline protein expressed in the endosperm (Evrard et al., 2007).
Grain hardness is well known to affect dough vis-coelasticity independently of GSP composition (Eagles et al., 2006). The effect of Spa-D polymorphism on dough viscoelasticity is most likely related to changes in grain hardness, since the association was not sig-nificant when the grain hardness was introduced in the statistical model. Conversely, significant effects of Spa-A markers on alveograph parameters were ob-served even when grain hardness was taken into account as a covariate. Although Spa genes are located at less than 1.3 centimorgan from the loci coding for the HMW-GS (Glu-1; Guillaumie et al., 2004), we found no LD between the electrophoretic diversity of HMW-GS and Spa markers (data not shown). This strongly suggests that polymorphisms at the Glu-1 loci are not responsible for the associations observed be-tween Spa and dough extensibility. Numerous studies have shown that dough extensibility increases as the gliadin-to-glutenin ratio increases (Wieser and Kieffer, 2001). It is thus surprising that the Spa-A allele asso-ciated with a higher gliadin-to-glutenin ratio was also associated with lower dough extensibility. Analysis of the composition of the gliadin protein fractions in the accessions analyzed here could give some insight into this unexpected result. We cannot rule out the possi-bility that the association between dough extensipossi-bility and Spa-A polymorphism was caused not by the observed changes in GSP composition but by their interactions. The opaque and floury mutants show higher levels of peroxidase gene expression, and the unfolded protein response is activated in these mu-tants (Gibbon and Larkins, 2005). If such responses are induced in wheat endosperm in response to Spa poly-morphism, they could have significant effects on GSP polymerization and therefore on dough viscoelasticity.
MATERIALS AND METHODS Materials
This study was based on the INRA worldwide core collection of hexaploid wheat (Triticum aestivum) consisting of 372 accessions (Balfourier et al., 2007). The population structure of this core collection is characterized by five ancestor groups (Horvath et al., 2009). The whole core collection has recently been phenotyped for several quality traits (Bordes et al., 2008). Average single grain dry mass (mg dry mass grain21), wholemeal flour protein concentration (mg protein g21dry mass; determined by near infrared spectroscopy), the total quantity of protein per grain (mg nitogen grain21; calculated from average single grain dry mass and wholemeal flour protein concentration), grain hardness (dimensionless; determined by near infrared spectroscopy), and dough strength (W and J), tenacity (P; mm of water), and extensibility (L; mm; determined using Chopin alveography) were the phenotypes measured in this genetic association analysis.
To study the p of Spa genes, a subset of 42 lines from different origins and ancestor groups (Supplemental Table S1) was sampled from the core collection as explained by Haseneyer et al. (2008). Genomic DNA was extracted (Tixier et al., 1998) from leaves harvested from a pool of six 3-week-old seedlings per accession. Seeds used in this study were provided by the INRA-Clermont-Ferrand Genetic Resources Centre (http://www.clermont.ina.fr/umr-gdec) and came from a single self-pollinated head. All plantlets for a given accession were thus considered to be genetically identical.
Based on the polymorphism found in the promoter regions of Spa genes, seven accessions of the core collection were selected for expression studies (Supplemental Table S1). Seeds were sown in 294-cm3pots filled with a peat
moss mix and were kept in a greenhouse for 2 weeks. The plants were then vernalized for 8 weeks in a growth chamber where the temperature was maintained at 4°C 6 1°C, the photosynthetic photon flux density at the top of the canopy was 43 mmol m22d21during the 8-h photoperiod, and the relative humidity was maintained at 40%. After vernalization, the plants were transplanted to soil beds in a greenhouse with a distance between plants of 30 cm and a row spacing of 0.5 m, where they received a mean total daily photosynthetic photon flux density of 26 mol m22d21(80% of ambient solar radiation), with daily maximum/minimum air temperatures averaging 21°C/ 15°C and day/night relative humidity averaging 50%/60%. Plants were watered as needed to maintain a soil water potential in the rooting zone higher than 20.1 MPa and received 30 g m22 nitrogen:phosphorus:potassium (17:17:17) fertilizer when transferred to the greenhouse. Air temperature next to the wheat ears was measured and recorded every 30 min using four HOBO H8 data loggers (Onset Computer). Ears were tagged when the anthers of the central florets appeared (anthesis). Two ears per plant were harvested at 0°Cd (ovary), 150°Cd, 200°Cd, 250°Cd, 300°Cd, and 400°Cd after anthesis. All samples were taken at 11:00AMto avoid possible diurnal effects on gene
expression. Three independent biological replicates were used. The basal grains on the spikelets of the central third of the ear were collected, the embryo and the external pericarp were rapidly removed, and the endosperm was frozen in liquid nitrogen and stored at280°C prior to RNA extraction.
Based on the different polymorphisms found in the promoter region of Spa genes, the grain protein composition was analyzed for 20 accessions of the core collection (Supplemental Table S2) grown in the field during the 2004 to 2005 (henceforth termed 2005) and 2005 to 2006 (henceforth termed 2006) growing seasons at Clermont-Ferrand, France (45°47#N, 3°10#E, 329 m eleva-tion). The crops were sown on October 27, 2004, and November 8, 2005. In 2005, the accessions were sown at a density of 90 seeds m22in 1-m-long and three-row-wide nursery plots. In 2006, they were sown at a density of 150 seeds m22in 5-m-long and eight-row-wide experimental plots. Inorganic soil nitrogen was 9.9 and 4.0 g nitrogen m22at the end of winters 2005 and 2006, respectively. The crops were fertilized with ammonium nitrate and received 5.0 g nitrogen m22at Zadok stage 32 in 2005 and 70 g nitrogen m22at Zadok stages 30 and 45 in 2005. Crops were rain fed, and pests and diseases were controlled chemically. For each subplot, grains were harvested in bulk at grain ripeness.
Polymorphism Analysis and Genotyping
For each Spa gene, several overlapping fragments were amplified and sequenced. Homoeolog-specific primers in the coding and noncoding regions were designed using the homoeologous sequences at Spa loci in the ‘Renan’ bacterial artificial chromosome library (Salse et al., 2008). The oligonucleotides used for amplification and sequencing and the annealing temperatures used in the touchdown program for PCR are given in Supplemental Table S4. Sequences were aligned using the Staden package (Staden et al., 2000), and consensus sequences were annotated using accession number Y09013 as the reference mRNA (Albani et al., 1997).
Genotyping was based on the protocol described for simple sequence repeats (Nicot et al., 2004) using forward primers 5# tailed with the M13 forward consensus sequence (Supplemental Table S5). For SNPs, we designed primer pairs where the first primer was allele specific and the second was genome specific. For each SNP, we genotyped the 372 accessions of the core collection with two primer pairs (one for each allele). For each indel, we designed one genome-specific primer pair. The presence or absence of amplification products was read using GeneMapper software version 3.7 (Applied Biosystems). For a given SNP, lines giving no signal with primer pairs designed for each allele were recorded as missing data. For indels, the amplification products from different alleles differ in size. Amplification products were visualized using an ABI PRISM 3100 Genetic Analyzer (Ap-plied Biosystems).
Quantification of the Expression ofSpa Homoeologs Total RNA was extracted from ovaries and developing grains (without the embryo and external pericarp; Khaled et al., 2005). Transcript levels of A, B, and D homoeologs of Spa and control genes were quantified by real-time qRT-PCR with an ABI PRISM 7900HT sequence detection system using Power SYBR Green PCR Master Mix (Applied Biosystems). Details of primer pairs used for qRT-PCR are given in Supplemental Table S6. For each Spa gene, the specificity of the primer pairs was ensured by confirming that the products gave a single peak in real-time melting temperature curve and a single band after agarose gel electrophoresis and there was adequate amplification from Chinese Spring nullitetrasomic lines, as expected according to the primers used. PCR efficiency was determined using a sample dilution series as template (Rasmussen, 2001). Amplification plots and predicted threshold cycle values were obtained from three independent biological replicates with the SDS software version 2.1 (Applied Biosystems). In preliminary experi-ments, the average coefficient of variation of technical replicates was esti-mated to be 0.94% (for 1,000 independent experiments of three technical replicates each).
The genes coding for actin, glyceraldehyde 3-phosphate dehydrogenase, elongation factor 1a, b-tubulin, and 18S were used as internal controls. All primer pairs gave an amplification efficiency of 100% 6 10% and were comparable. The optimal number of internal control genes determined using the geNorm algorithm (Vandesompele et al., 2002) was four. Glyceraldehyde 3-phosphate dehydrogenase, elongation factor 1a, b-tubulin, and 18S had the most stable expression during grain development and were thus chosen for normalizing the expression of Spa. Their geometric mean was calculated, and the normalized quantity of Spa genes was then calculated (Pfaffl et al., 2004). Primer pairs amplifying a cyclophilin gene and spanning one intron were used to check for the absence of DNA contamination.
Quantification of Grain Protein Fractions
Mature grains were ground to wholemeal flour using a 6800 Cyclotec mill equipped with a 0.75-mm sieve (FOSS). The nonprolamin (mainly albumin globulin and amphiphilic proteins), gliadin, and glutenin protein fractions were sequentially extracted from 100 mg of wholemeal flour (Triboi et al., 2003). Supernatants containing each protein fraction (80 mL) were oven dried for 3 h at 45°C in 5-mm 3 8-mm tin sample capsules, and their total nitrogen concentration was determined with the Dumas combustion method (Associ-ation of Analytical Communities Intern(Associ-ational method no. 992.23) using a FlashEA 1112 N/Protein Analyzer (Thermo Electron). Two independent flour samples were extracted in duplicate for each accession and growing year. Each extract was analyzed in duplicate.
Data Analysis
The p within each Spa homoeolog was calculated as the average number of nucleotide differences per bp between sequences (Nei, 1987). Haplotype diversity, p, and the mean pairwise differences were computed using DNA-SP software version 4.10 (Rozas et al., 2003). Sites with alignment gaps were also considered. The patterns of diversity were analyzed by the sliding-windows method (window size of 100 bp, step size of 25 bp) using TASSEL software version 9.3.1 (Buckler et al., 2006). SNP information is available at http://urgi. versailles.inra.fr/GnpSNP.
LD for pairs of polymorphic sites with minor allele frequencies over 5% was estimated using squared allele frequency correlations (r2; Hill and
Robertson, 1968). The general linear model procedure of the SAS software version 9.3.1 was used to analyze genetic association. To reduce the rate of false positives, the structure components (i.e. the contribution of each line to the five ancestor groups) of the core collection (Horvath et al., 2009) were used as covariates (model I). As grain hardness is known to modify dough viscoelasticity (Eagles et al., 2006), the effects of Spa markers were then tested with grain hardness introduced into model I as covariate (model II). Signif-icant genetic associations were judged at a = 0.01.
The allocation of grain nitrogen to protein fractions was analyzed on log-transformed data using the allometric model log(Fi) = log(bRMA) + aRMA3 log
(Ntot), where Ntot is the total quantity of nitrogen per grain, Fiis the quantity
of the protein fraction i per grain, aRMAis the scaling exponent, and bRMAis the
allometric constant. Data were log transformed because it puts the variables on a multiplicative scale, allowing us to assess relative variability in a meaningful way. aRMA calculated on log-transformed variables gives the
proportional relationship between variables. Reduced major axis was used to estimate the parameters of the allometric equations. Test for homogeneity of slopes between haplotypes and calculation of common slopes were done using a likelihood ratio method, with the test statistic closely approximating a x2
distribution with Bartlett correction (Warton and Weber, 2002). Where nonheterogeneity of slopes was demonstrated, differences in elevation of slopes (y intercept) were tested using a Wald statistic (Warton et al., 2006). Curve fitting, CI calculations, and statistical analysis of the differences in slopes and intercepts were done using SMATR software version 2 (Falster et al., 2006). Statistical tests were significance tested at a = 0.05.
Supplemental Data
The following materials are available in the online version of the article. Supplemental Figure S1.Schematic representations of Spa genes showing
SNPs and indels.
Supplemental Figure S2.UPGMA trees for Spa-A, Spa-B, and Spa-D. Supplemental Table S1.Haplotypes for the three homoeologous Spa genes
of 42 accessions from the hexaploid wheat core collection used for nucleotide polymorphism and expression analysis.
Supplemental Table S2.Haplotypes for the three homoeologous Spa genes of the accessions used to analyze grain protein composition of mature grains.
Supplemental Table S3. Summary allometric analysis of grain pro-tein composition for wheat accessions belonging to Spa-A haplotypes 1 and 2.
Supplemental Table S4.Oligonucleotides and PCR conditions used for amplification of overlapping fragments and sequencing of Spa genes. Supplemental Table S5.Oligonucleotides and PCR conditions used for
genotyping Spa genes.
Supplemental Table S6.Sequences of primers used for qRT-PCR.
ACKNOWLEDGMENTS
We thank Christophe Troquier and his team for growing the plants, Florence Exbrayat and Ste´phanie Verrier for genotyping and qRT-PCR, and Sibille Perrochon for her help with grain protein extraction and quantifica-tion. We are grateful to Dr. Richard Thompson for critical reading of the manuscript. We also thank Rachel Carol from Emendo Bioscience (http:// www.emendo.co.uk) for English improvement of the manuscript.
Received August 11, 2009; accepted October 10, 2009; published October 14, 2009.
LITERATURE CITED
Albani D, Hammond-Kosack MCU, Smith C, Conlan S, Colot V, Holdsworth M, Bevan M(1997) The wheat transcriptional activator SPA: a seed-specific bZIP protein that recognizes the GCN4-like motif in the bifactorial endosperm box of prolamin genes. Plant Cell 9: 171–184 Balfourier F, Roussel V, Strelchenko P, Exbrayat-Vinson F, Sourdille P, Boutet G, Koenig J, Ravel C, Mitrofanova O, Beckert M, et al(2007) A worldwide bread wheat core collection restricted to a full 384 deep well storage plate. Theor Appl Genet 114: 1265–1275
Be´ke´s F, Keme´ny S, Morell M(2006) An integrated approach to predicting end-product quality of wheat. Eur J Agron 25: 155–162
Blechl AE, Anderson OD(1996) Expression of a novel high-molecular-weight glutenin subunit gene in transgenic wheat. Nat Biotechnol 14: 875–879
Bordes J, Branlard G, Oury FX, Charmet G, Balfourier F(2008) Agronomic characteristics, grain quality and flour rheology of 372 bread wheats in a worldwide core collection. J Cereal Sci 48: 569–579
Bottley A, Koebner RMD(2008) Variation for homoeologous gene silenc-ing in hexaploid wheat. Plant J 56: 297–302
Bottley A, Xia GM, Koebner RMD(2006) Homoeologous gene silencing in hexaploid wheat. Plant J 47: 897–906
Branlard G, Dardevet M, Saccomano R, Lagoutte F, Gourdon J(2001) Genetic diversity of wheat storage proteins and bread wheat quality. Euphytica 119: 59–67
Buckler E, Bradbury P, Kroon D, Ramdoss Y, Fink AJ(2006) Trait anal-ysis by association, evolution and linkage: TASSEL. http://www. maizegenetics.net/tassel (October 19, 2009)
Caldwell KS, Dvorack J, Lagudah ES, Akhunov E, Luo MC, Wolters P, Powell W(2004) Sequence polymorphism in polyploidy wheat and their D-genome diploid ancestors. Genetics 167: 941–947
Chao S, Zhang W, Akunov E, Sherman J, Ma Y, Luo MC, Dubcovsky J (2009) Analysis of gene-derived SNP marker polymorphism in US wheat (Triticum aestivum L.) cultivars. Mol Breed 23: 23–33
Charmet G, Robert N, Branlard G, Linossier L, Martre P, Triboi E(2005) Genetic analysis of dry matter and nitrogen accumulation and protein composition in wheat kernels. Theor Appl Genet 111: 540–550 Chiaiese P, Ohkama-Ohtsu N, Molvig L, Godfree R, Dove H, Hocart C,
Fujiwara T, Higgins TJV, Tabe LM(2004) Sulphur and nitrogen nutri-tion influence the response of chickpea seeds to an added, transgenic sink for organic sulphur. J Exp Bot 55: 1889–1901
Colot V, Bartels D, Thompson R, Flavell R(1989) Molecular characteri-zation of an active wheat LMW glutenin gene and its relation to other wheat and barley prolamin genes. Mol Gen Genet 216: 81–90 Colot V, Robert LS, Kavanagh TA, Bevan MW, Thompson RD(1987)
Localization of sequences in wheat endosperm protein genes which confer tissue-specific expression in tobacco. EMBO J 6: 3559–3564 Conlan R, Hammond-Kosack M, Bevan M(1999) Transcription activation
mediated by the bZIP factor SPA on the endosperm box is modulated by ESBF-1 in vitro. Plant J 19: 173–181
Doebley J, Lukens L(1998) Transcriptional regulators and the evolution of plant form. Plant Cell 10: 1075–1082
Don C, Mann G, Bekes F, Hamer RJ(2006) HMW-GS affect the properties of glutenin particles in GMP and thus flour quality. J Cereal Sci 44: 127–136
Dong G, Ni Z, Yao Y, Nie X, Sun Q(2007) Wheat Dof transcription factor WPBF interacts with TaQM and activates transcription of an alpha-gliadin gene during wheat seed development. Plant Mol Biol 63: 73–84 Dupont FM, Hurkman WJ, Vensel WH, Tanaka C, Kothari KM, Chung OK, Altenbach S (2006) Protein accumulation and composition in wheat grains: effects of mineral nutrients and high temperature. Eur J Agron 25: 96–107
Eagles HA, Cane K, Eastwood RF, Hollamby GJ, Kuchel H, Martin PJ, Cornish GB(2006) Contributions of glutenin and puroindoline genes to grain quality traits in southern Australian wheat breeding programs. Aust J Agric Res 57: 179–186
Evrard A, Meynard D, Guiderdoni E, Joudrier P, Gautier M-F(2007) The promoter of the wheat puroindoline-a gene (PinA) exhibits a more complex pattern of activity than that of the PinB gene and is induced by wounding and pathogen attack in rice. Planta 225: 287–300
Falster DS, Warton DI, Wright IJ(2006) SMATR: standardised major axis tests and routines, version 2.0. http://www.bio.mq.edu.au/ecology/ SMATR/ (October 19, 2009)
Feldman M(2001) Origin of cultivated wheat. In A Bonjean, W Angus, eds, The World Wheat Book. Lavoisier Publishing, Paris, pp 3–56
Gibbon BC, Larkins BA(2005) Molecular genetic approaches to develop-ing quality protein maize. Trends Genet 21: 227–233
Gibbon BC, Wang X, Larkins BA (2003) Altered starch structure is associated with endosperm modification in Quality Protein Maize. Proc Natl Acad Sci USA 100: 15329–15334
Gil-Humanes J, Pisto´n F, Hernando A, Alvarez JB, Shewry PR, Barro F (2008) Silencing of g-gliadins by RNA interference (RNAi) in bread wheat. J Cereal Sci 48: 565–568
Graybosch RA, Peterson CJ, Shelton DR, Baenziger PS(1996) Genotypic and environmental modification of wheat flour protein composition in relation to end-use quality. Crop Sci 36: 296–300
Guillaumie S, Charmet G, Linossier L, Torney V, Robert N, Ravel C(2004) Co-location between a gene encoding for the bZip factor SPA and an eQTL for a high-molecular-weight glutenin subunit in wheat (Triticum aestivum). Genome 47: 705–713
Halford NG, Shewry PR(2007) The structure and expression of cereal storage protein genes. In O-A Olsen, ed, Plant Cell Monographs 8.
Endosperm: Development and Molecular Biology. Springer-Verlag, Berlin, pp 196–218
Haseneyer G, Ravel C, Dardevet M, Balfourier F, Sourdille S, Charmet G, Brunel D, Sauer S, Geiger HH, Graner A, et al(2008) High level of conservation between genes coding for the GAMYB transcription factor in barley (Hordeum vulgare L.) and bread wheat (Triticum aestivum L.) collections. Theor Appl Genet 117: 321–331
Henry AM, Manicacci D, Falque M, Damerval C(2005) Molecular evolu-tion of the Opaque-2 gene in Zea mays L. J Mol Evol 61: 1–8
Hernandez-Sebastia C, Marsolais F, Saravitz C, Israel D, Dewey RE, Huber SC (2005) Free amino acid profiles suggest a possible role for asparagine in the control of storage-product accumulation in de-veloping seeds of low- and high-protein soybean lines. J Exp Bot 56: 1951–1963
Hill WG, Robertson A(1968) Linkage disequilibrium in finite populations. Theor Appl Genet 38: 226–231
Horvath A, Didier A, Koenig J, Exbrayat F, Charmet G, Balfourier F(2009) Diversity and linkage disequilibrium analysis along the chromosome 3B of bread wheat (Triticum aestivum L.) in contrasted plant materials. Theor Appl Genet (in press)
Huebner FR, Nelsen TC, Chung OK, Bietz JA(1997) Protein distributions among hard red winter wheat varieties as related to environment and baking quality. Cereal Chem 74: 123–128
Hunter BG, Beatty MK, Singletary GW, Hamaker BR, Dilkes BP, Larkins BA, Jung R(2002) Maize Opaque endosperm mutations create extensive changes in patterns of gene expression. Plant Cell 14: 2591–2612 Islam N, Upadhyaya NM, Campbell PM, Akhurst R, Hagan N, Higgins
TJV(2005) Decreased accumulation of glutelin types in rice grains constitutively expressing a sunflower seed albumin gene. Phytochem-istry 66: 2534–2539
Khaled AS, LeDeunff E, Ingram GC, Meeley R, Rogowsky PM(2005) Dividing maize tissues show preferential expression of two novel receptor-like cytoplasmic protein kinases. Plant Sci 169: 587–598 Manicacci D, Camus-Kulandaivelu L, Fourmann M, Arar C, Barrault S,
Rousselet A, Feminias N, Consoli L, Frances L, Mechin V, et al(2009) Epistatic interactions between Opaque2 transcriptional activator and its target gene CyPPDK1 control kernel trait variation in maize. Plant Physiol 150: 506–520
Martre P, Porter JR, Jamieson PD, Triboi E(2003) Modeling grain nitrogen accumulation and protein composition to understand the sink/source regulations of nitrogen remobilization for wheat. Plant Physiol 133: 1959–1967
Masci S, D’Ovidio R, Scossa F, Patacchini C, Lafiandra D, Anderson OD, Blechl AE(2003) Production and characterization of a transgenic bread wheat line over-expressing a low-molecular-weight glutenin subunit gene. Mol Breed 12: 209–222
Mena M, Vicente-Carbajosa J, Schmidt RJ, Carbonero P(1998) An endo-sperm-specific DOF protein from barley, highly conserved in wheat, binds to and activates transcription from prolamin-box of a native B-hordein promoter in barley endosperm. Plant J 16: 53–62
Mochida K, Yamazaki Y, Ogihara Y(2004) Discrimination of homoeolo-gous gene expression in hexaploid wheat by SNP analysis of contigs grouped from a large number of expressed sequence tags. Mol Genet Genomics 270: 371–377
Moreno-Risueno MA, Gonzalez N, Diaz I, Parcy F, Carbonero P, Vicente-Carbajosa J (2008) FUSCA3 from barley unveils a common transcriptional regulation of seed-specific genes between cereals and Arabidopsis. Plant J 53: 882–894
Mu¨ller M, Knudsen S(1993) The nitrogen response of a barley C-hordein promoter is controlled by positive and negative regulation of the GCN4 and endosperm box. Plant J 4: 343–355
Nei M(1987) Molecular Evolutionary Genetics. Columbia University Press, New York
Nicot N, Chiquet V, Gandon B, Amilhat L, Le Geai F, Leroy P, Bernard M, Sourdille P(2004) Study of simple sequence repeat (SSR) markers from wheat expressed sequence tags (ESTs). Theor Appl Genet 109: 800–805 Peak NC, Imsande J, Shoemaker RC, Shibles R(1997) Nutritional control
of soybean storage protein. Crop Sci 37: 498–503
Pfaffl MW, Tichopad A, Prgomet C, Neuvians TP(2004) Determination of stable housekeeping genes, differentially regulated target genes and sample integrity: BestKeeper. Excel-based tool using pair-wise correla-tions. Biotechnol Lett 26: 509–515
Pumphrey M, Bai J, Laudencia-Chingcuanco D, Anderson O, Gill BS
(2009) Nonadditive expression of homoeologous genes is established upon polyploidization in hexaploid wheat. Genetics 181: 1147–1157 Purugganan MD, Wessler SR(1994) Molecular evolution of the plant R
regulatory gene family. Genetics 138: 849–854
Rasmussen R(2001) Quantification on the LightCycler instrument. In S Meuer, C Wittwer, K Nakagawara, eds, Rapid Cycle Real-Time PCR, Methods and Applications. Springer Press, Heidelberg, pp 21–34 Ravel C, Nagy IJ, Martre P, Sourdille P, Dardevet M, Balfourier F, Pont C,
Giancola S, Praud S, Charmet G(2006a) Single nucleotide polymor-phism, genetic mapping, and expression of genes coding for the DOF wheat prolamin-box binding factor. Funct Integr Genomics 6: 310–321 Ravel C, Praud S, Murigneux A, Canaguier A, Sapet F, Samson D,
Balfourier F, Dufour P, Chalhoub B, Brunel D, et al(2006b) Single-nucleotide polymorphisms (SNPs) frequency in a set of selected lines of bread wheat (Triticum aestivum L.). Genome 49: 1131–1139
Ravel C, Praud S, Murigneux A, Linossier L, Dardevet M, Balfourier F, Dufour P, Brunel D, Charmet G(2006c) Identification of Glu-B1-1 as a candidate gene for the quantity of high-molecular-weight glutenin in bread wheat (Triticum aestivum L.) by means of an association study. Theor Appl Genet 112: 738–743
Rozas J, Sa´nchez-DelBarrio JC, Messeguer X, Rozas R(2003) DnaSP: DNA polymorphism analyses by the coalescent and other methods. Bioinfor-matics 19: 2496–2497
Rubio-Somoza I, Martinez M, Abraham Z, Diaz I, Carbonero P(2006a) Ternary complex formation between HvMYBS3 and other factors in-volved in transcriptional control in barley seeds. Plant J 47: 269–281 Rubio-Somoza I, Martinez M, Diaz I, Carbonero P(2006b) HvMCB1, a
R1MYB transcription factor from barley with antagonistic regulatory functions during seed development and germination. Plant J 45: 17–30 Salse J, Chague V, Bolot S, Magdelenat G, Huneau C, Pont C, Belcram H, Couloux A, Gardais S, Evrard A, et al(2008) New insights into the origin of the B genome of hexaploid wheat: evolutionary relationships at the SPA genomic region with the S genome of the diploid relative Aegilops speltoides. BMC Genomics 9: 555
Sexton PJ, Naeve SL, Paek NC, Shibles R (1998) Sulfur availability, cotyledon nitrogen:sulfur ratio, and relative abundance of seed storage proteins of soybean. Crop Sci 38: 983–986
Staden R, Beal KF, Bonfield JK(2000) The Staden package, 1998. Methods Mol Biol 132: 115–130
Tabe L, Hagan N, Higgins TJV(2002) Plasticity of seed protein composi-tion in response to nitrogen and sulfur availability. Curr Opin Plant Biol 5:212–217
Tixier MH, Sourdille P, Charmet G, Gay G, Jaby C, Cadalen T, Bernard S, Nicolas P, Bernard M(1998) Detection of QTLs for crossability in wheat using double-haploid population. Theor Appl Genet 97: 1076–1082 Tosi P, Parker M, Gritsch CS, Carzaniga R, Martin B, Shewry PR(2009)
Trafficking of storage proteins in developing grain of wheat. J Exp Bot 60:979–991
Triboi E, Martre P, Triboi-Blondel A-M(2003) Environmentally-induced changes of protein composition for developing grains of wheat are related to changes in total protein content. J Exp Bot 54: 1731–1742 Vandesompele J, De Preter K, Pattyn F, Poppe B, Van Roy N, De Paepe A,
Speleman F(2002) Accurate normalization of real-time quantitative RT-PCR data by geometric averaging of multiple internal control genes. Genome Biol 3: research0034.1–research0034.11
Verdier J, Thompson RD (2008) Transcriptional regulation of storage protein synthesis during dicotyledon seed filling. Plant Cell Physiol 49: 1263–1271
Vicente-Carbajosa J, Moose SP, Parsons RL, Schmidt RJ(1997) A maize zinc-finger protein binds the prolamin box in zein gene promoters and interacts with the basic leucine zipper transcriptional activator Opaque2. Proc Natl Acad Sci USA 94: 7685–7690
Wan Y, Poole RL, Huttly AK, Toscano-Underwood C, Feeney K, Welham S, Gooding MJ, Mills C, Edwards KJ, Shewry PR, et al(2008) Tran-scriptome analysis of grain development in hexaploid wheat. BMC Genomics 9: 121
Warton DI, Weber NC(2002) Common slope tests for bivariate errors-in-variables models. Biom J 44: 161–174
Warton DI, Wright IJ, Falster DS, Westoby M(2006) Bivariate line-fitting methods for allometry. Biol Rev Camb Philos Soc 81: 259–291 Weegels PL, Hamer RJ, Schofield JD(1996) Critical review: functional
properties of wheat glutenin. J Cereal Sci 23: 1–18
Wieser H(2007) Chemistry of gluten proteins. Food Microbiol 24: 115–119 Wieser H, Kieffer R(2001) Correlations of the amount of gluten protein types to the technological properties of wheat flours determined on a micro-scale. J Cereal Sci 34: 19–27
Yamamoto MP, Onodera Y, Touno SM, Takaiwa F (2006) Synergism between RPBF Dof and RISBZ1 bZIP activators in the regulation of rice seed expression genes. Plant Physiol 141: 1694–1707
Yoshihara T, Washida H, Takaiwa F (1996) A 45-bp proximal region containing AACA and GCN4 motif is sufficient to confer endosperm-specific expression of the rice storage protein glutenin gene, GluA-3. FEBS Lett 383: 213–218
Zhang W, Gianibelli MC, Ma W, Rampling L, Gale KR(2003) Identifica-tion of SNPs and development of allele-specific markers for g-gliadin alleles in Triticum aestivum. Theor Appl Genet 107: 130–138
Zhang W, Gianibelli MC, Rampling LR, Gale KR(2004) Characterisation and marker development for low molecular weight glutenin genes from Glu-A3 alleles of bread wheat (Triticum aestivum L). Theor Appl Genet 108:1409–1419
Zheng Z, Kawagoe Y, Xiao S, Li Z, Okita T, Hau TL, Lin A, Murai M(1993) 5# distal and proximal cis-acting regulator elements are required for developmental control of a rice seed storage protein glutelin gene. Plant J 4:357–366