Automatic Generation of Fundamental Frequency
for Text-to-Speech Synthesis
by
Aaron Seth Cohen
Submitted to the Department of Electrical Engineering and
Computer Science
in partial fulfillment of the requirements for the degrees of
Bachelor of Science in Electrical Engineering and Computer Science
and
Master of Engineering in Electrical Engineering and Computer
Science
at the
MASSACHUSETTS INSTITUTE OF TECHNOLOGY
June 1997
@
Aaron Seth Cohen, MCMXCVII. All rights reserved.
The author hereby grants to MIT permission to reproduce and
distribute publicly paper and electronic copies of this thesis
document in whole or in part, and to grant others the right to do so.
.... .. . •2 .. ::i,- : : : ";": " '
Author...
Department
Certified by...
7-)
7)
of Electrical Engineering and
0CT 2 91991
Computer Science
May 16, 1997
Senic
Victor Zue
>r Research Scientist
se upesisor
Accepted by...
....
Arthur C. Smith
Chairman, Departmental Committee on Graduate Theses
Automatic Generation of Fundamental Frequency for
Text-to-Speech Synthesis
by
Aaron Seth Cohen
Submitted to the Department of Electrical Engineering and Computer Science on May 16, 1997, in partial fulfillment of the
requirements for the degrees of
Bachelor of Science in Electrical Engineering and Computer Science and
Master of Engineering in Electrical Engineering and Computer Science
Abstract
The problem addressed by this research is the automatic construction of a model of the fundamental frequency (Fo) contours of a given speaker to enable the synthesis of new contours for use in Text-to-Speech synthesis. The parametric Fo generation model designed by Fujisaki is used to analyze observed Fo contours. The parameters of this model are used in conjunction with linguistic and lexical information to form context based prototypes. The success of the Fo generation is evaluated using both objective error measures and subjective listening tests.
Thesis Supervisor: Victor Zue Title: Senior Research Scientist
Acknowledgments
The work for this thesis was carried out at IBM's T. J. Watson Research Center in Yorktown Heights, New York. I would like to thank my direct supervisor, Robert Donovan, for providing many ideas and keeping me focussed throughout the project. I would also like to thank my manager, Michael Picheny, who allowed me to pursue this research independently. Many other members of the speech group at IBM have given me quite a bit of help, especially Raimo Bakis, Ramesh Gopinath, Mukund Padmanabhan, Lalit Bahl, and Adwait Radnaparkhi.
Contents
1 Introduction 1.1 Problem Statement ... 1.2 Outline of Thesis ... 2 Background 2.1 Models of F0 Generation ... 2.1.1 Target Models ... 2.1.2 Parametric Models . . . . 2.1.3 Fujisaki's Model ... 2.1.4 Other Models ... . .2.2 Information Used for Prediction ... 2.3 Evaluation Techniques ... 3 Training
3.1 Basic Tools ...
3.1.1 F0 Generation Model ...
3.1.2 Databases: Training and Testing 3.2 Database Annotation ... 3.2.1 Phone-level Alignment ... 3.2.2 Part-of-Speech Information .... 3.2.3 Lexical Stress ... 3.2.4 Phrase Boundaries . . . . 3.3 Parameter Extraction ... 11 12 14 15 15 15 17 17 21 21 22 24 24 25 25 27 27 27 28 29 29 : : : : : : . . . . . .
3.3.1 Fo Extraction and Stylization 3.3.2 Search Technique ...
3.3.3 Parameter Constraints . . . .
3.3.4 Searching Results ... 3.4 Pitch Accent Model ...
3.4.1 Decision Tree Description . .
3.4.2 Decision Tree Data ... 3.4.3 Decision Tree Questions . . . 3.4.4 Prototypes ... . .
3.4.5 Probabilistic Model ... 3.5 Phrase Accent Model ...
3.5.1 Prediction Information . . . . 3.5.2 Calculation of Coefficients . . 3.5.3 Calculated Coefficients . . . . 4 Synthesis 4.1 Pitch 4.1.1
Accent Prototype Selection Dynamic Programming .. 4.1.2 Intensity Variation Model
4.2 Phrase Accent Amplitude Calculation ...
5 Results
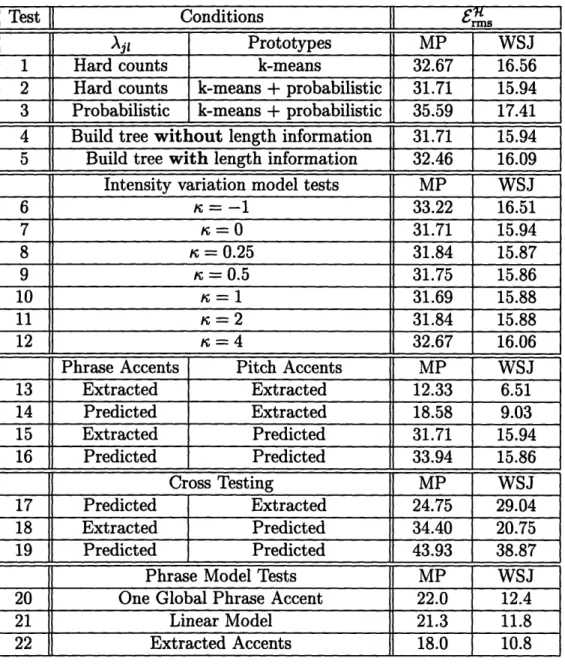
5.1 Objective Tests ... 5.1.1 Error Measure ... 5.1.2 Test Databases . . . .
5.1.3 Objective Test Results 5.2 Listening Tests . . . .
5.2.1 Description ... 5.2.2 Listening Test Results 5.3 Examples ... 47 47 48 . . . . . 53 54 55 55 55 56 57 61 62 63 64 :: ::: : 1]1 I I . . . .
6 Conclusions 69
6.1 New Concepts ... . ... .69
6.1.1 Fujisaki Parameter Searching ... 69
6.1.2 Pitch Accent Prototype Creation ... 70
6.1.3 Pitch Accent Prototype Selection ... 70
6.2 Further Research ... 70
A Database details 72 A.1 Pitch Accents ... 72
A.2 Phrase Accents ... 75
List of Figures
1-1 Overall structure of text-to-speech synthesis system . ... 13
2-1 Block diagram of Fujisaki's model . ... . . . . 18
2-2 Example output from Fujisaki's model . ... 19
3-1 Block diagram of training process . ... . 25
3-2 Graphical intensity bin variation probabilities . ... 39
4-1 Dynamic programming process before stage i . ... 51
4-2 Dynamic programming process after stage i . ... 52
5-1 Partial F0 contour of Marketplace sentence, "The new Chrysler car the Neon is just showing up in show rooms and it's being recalled, again." 65 5-2 Partial F0 contour of Marketplace sentence, "According to the San Francisco Examiner today, Pepsi is launching a mid calorie cola in Canada this month called Pepsi Max, which has about 50 calories a serving instead of 160." ... 66
5-3 Partial F0 contour of Wall Street Journal sentence, "Our current policy is still based on the Communications Act of 1934, framed when the electronic computer was still a dream." .. ... 67
5-4 Partial F0 contour of Wall Street Journal Sentence, "The advance in turn pulled up prices of delivery months representing the new crop season which will begin August first." .. ... 68
B-i Pitch accent model decision tree for the Wall Street Journal training database ... .. 79 B-2 Pitch accent model decision tree for the Marketplace training database 81
List of Tables
2.1 Description of parameters used in Fujisaki's model ... 19
3.1 Part-of-speech categories. The acronyms in the right hand column refer to labels used in the Penn Treebank project [51]. ... 28
3.2 General information about the database subsets used for comparing search techniques (average values) ... . 32
3.3 Results from parameter extraction for various search conditions, RMS error in ln(Hz) per frame between extracted and observed F0 contours 34 3.4 Simple decision tree example ... .... 37
3.5 Definition of elements of the nth row of the A matrix used for calcu-lating the phrase accent model parameters ... 45
3.6 Phrase accent coefficients for the linear model calculated from the Mar-ketplace and Wall Street Journal training databases ... 46
5.1 Results for objective tests on the Marketplace and Wall Street Journal databases with several test conditions ... 58
5.2 Results of objective tests, varying both tree sizes and number of pro-totypes per leaf. (In RMS Hz.) ... 60
5.3 Information about and objective test results from Marketplace testing databases . . . . .. . . . . .. . .. .. . . . .. . ... ... . 61
5.4 Testing conditions for listening tests ... 62
5.5 Mean Opinion Scores from listening tests ... 63
A.2 Average intensity of pitch accents by primary/secondary stress and meaning/function word categories ... . 73 A.3 Average intensity of pitch accents by distance from previous phrase
boundary (in accents) ... 74 A.4 Average intensity of pitch accents by intensity level of previous pitch
accent . . . 75 A.5 Average amplitude of phrase accents by number in sentence and type
of accent . . . .. . 76 B.1 Decision tree questions for the Wall Street Journal training database 80 B.2 Decision tree questions for the Marketplace training database ... 80
Chapter 1
Introduction
This thesis presents work on the automatic generation of fundamental frequency (Fo) contours for text-to-speech synthesis. The F0 contour conveys a great deal of
informa-tion about the meaning of a sentence, and without an appropriate one an utterance can be perceived to be quite unnatural. Researchers have been attempting to gener-ate adequgener-ate contours throughout the history of the study of text-to-speech synthesis. In an overview of the technology of twenty years ago [1], Allen indicated that very little was known about generating F0 contours besides several linguistic theories. In another extensive survey of text-to-speech technology ten years later [26], Klatt presented several generation algorithms, although the rules that determined the F0
contours were all created by hand. More recently, there has been a greater trend to-ward creating speech synthesis systems using automatic training. For example in [8], representative segments of a speech waveform are chosen from a training database and combined using the Pitch Synchronous Overlap and Add (PSOLA) algorithm [9]. There have also been some studies of generating F0 using trainable models. An
example of applying this trend to F0 generation appears in [43], which breaks up the
F0 generation problem into two parts, predicting abstract prosodic labels from text
and generating the F0 contour from the labels. One major difference between the
current work and previous research is that a hand labeled prosodic database is not needed here, only a reliable F0 extraction algorithm.
1.1
Problem Statement
The objective of this research is to predict fundamental frequency (Fo) for text-to-speech synthesis. Traditionally, this was achieved through the use of rules, which were designed by hand to capture the most important aspects of Fo generation from text. More recently, trainable approaches have been attempted in which the rules are created by statistically analyzing a training database. A trainable system is preferable for two reasons. Firstly, the properties of the text that are important for predicting Fo can be derived from the data instead of being manually imposed. Secondly, the system should capture and reproduce the training speaker's speaking style. For example, in [43], a sequence of Tones and Break Indices (ToBI) labels were predicted from text and a Fo contour generated from the ToBI labels. In [36], the relationship between parameters of the Fujisaki model and linguistic features were statistically analyzed
using regression trees.
In the current research, a trainable model is constructed to predict accents of the Fujisaki model [21]. Initially the Fujisaki model is used to analyze observed Fo contours, using a two-stage searching procedure with linguistic constraints (see Section 3.3). Models for word-level and phrase-level Fo effects are built by statistically analyzing the parameters of the Fujisaki model in relation to the linguistic and lexical contexts in which they occur (see Sections 3.4 and 3.5). In synthesis, the most likely sequence of accent prototypes is chosen using a dynamic programming algorithm (see Chapter 4).
The success of the generation of Fo contours for new text is measured by comparing those contours with observed ones using a set of sentences different from the ones used for training. In this research, this evaluation is carried out using both objective measures and subjective listening tests (see Chapter 5). The two steps of training and testing approximate the way in which a Fo generation model might be used in a text-to-speech system that tries to emulate the voice of a speaker. In the initial phase, that speaker would read sentences presented to him and his observed Fo contour would be analyzed. Then, when the text of a new sentence is given to the system, an
Figure 1-1: Overall structure of text-to-speech synthesis system appropriate Fo contour can be generated.
A block diagram of the overall text-to-speech system assumed for this research is presented in Figure 1-1. The modules with heavier lines are the ones which are imple-mented for this study. The dashed line around phrase boundary selection indicates that this is not accomplished automatically for this work, while the processes in the other boxes are. In the first layer, the text of a sentence to be synthesized is processed to generate more specific information about the text. The second layer involves tak-ing that information and productak-ing abstract information about the speech. Finally, the synthesizer combines the Fo contour, the duration and energy, plus either filters that describe the spectral characteristics or prototypical segments of actual speech to create the synthetic speech.
1.2
Outline of Thesis
The organization of the remainder of this thesis will be as follows. Chapter 2 describes background information on previous research into the generation of Fo contours. Re-search on several model types will be presented, including target and parametric methods for describing the contour. The linguistic, lexical, and other types of in-formation that similar research has used to predict Fo will be discussed. The final section in this chapter will describe some evaluation methods that other research has employed.
Chapter 3 describes the training phase of the system, in which prototypes are created for later use in synthesis. The linguistic and lexical information annotated to the database of text of speech is discussed in this chapter. Then, the method for extracting the parameters of the Fo model that describe the observed Fo contour of an utterance are described. Finally, there is a description of how prototypical parameters for the generation model are created to represent linguistic and lexical contexts.
Chapter 4 describes the synthesis phase of the system, in which Fo contours are generated for new sentences. The selection of parameters to describe the Fo contour for the new sentence is accomplished by a dynamic programming algorithm which is detailed in this chapter.
In Chapter 5, descriptions and results of both objective error measurements and subjective listening tests are presented. Some example Fo contours are shown to further illustrate the way the system works. Finally, Chapter 6 concludes the thesis with a summary of the new ideas presented and some directions for further research.
Chapter 2
Background
This chapter will describe research that has already been conducted in the generation of fundamental frequency (Fo) contours. The first section will cover several types of models of Fo generation and some of their applications. The second section will discuss information that has been used to predict the contours. Finally, methods that have been used to evaluate the success of Fo generation systems will be presented.
2.1
Models of Fo Generation
This section will introduce models of Fo generation that have been published in the scientific literature. There are two main types of models, target and parametric.
A specific parametric model described by Fujisaki will be discussed in some detail. Finally, some other models that do not fall into either category will be discussed.
2.1.1
Target Models
As proposed in [40], it is possible to abstract a Fo contour into a series of high and low targets. This idea was recently formalized into the Tones and Break Indices (ToBI) system [53], which provides a standard way to annotate prosodic phenomena. This system contains two tiers, tonal and break indices. The first tier consists of pitch accents denoted by high or low markers combined with directional identifiers, which
attempt to encode word-level prosodic events. The second tier is a seven point scale that quantifies breaks between words, modeling the phrasal structure of the utterance. There have been several other proposed labeling schemes [31], all of which attempt to annotate prosody for computer databases of speech.
Given that some abstract prosodic labeling exists, the problem of generating F0
from text can be broken up into two steps. The first step uses the text to produce the prosodic labels. For example, in [43], classification and regression trees were used to predict ToBI labels from linguistic information about the text, using a hand labeled database for training. In another example [42], a discourse-model was used to produce ToBI labels based on the context of the sentence and previous sentences in the conversation, attempting to provide distinctions in prosodic contrast between new and old words in the conversation.
Once the labels have been predicted, they can be used to produce the actual F0
contour. In [24], quantitative prosodic labels of stressed syllables were used to form piece-wise linear F0 contours. In [44], a dynamical system was described that takes
ToBI labels and produces an F0 contour, using a combination of an unobserved state
vector and a noisy observation vector of F0 and energy. In [6], ToBI labels were
combined with stress and syllable positions in a linear manner to produce three F0
values per syllable, which were smoothed to form a contour.
Some research has pursued automatic generation of such labels from both the text and the spoken utterance. This is a difficult task, because even with hand labeling, the level of agreement between labelers does not exceed 90% [41]. In one example [45], a stochastic model that used acoustical information and phrase boundary locations was used to predict ToBI labels from an utterance. With known phrase boundary locations on an independent test set, this system achieved 85% accuracy on syllable accent level in relation to the hand labeled database. In another example [56], acoustical information was used to predict pitch movements, another prosodic labeling scheme quantitatively describing rises and falls in the F0 contour.
2.1.2
Parametric Models
Another form of abstraction of fundamental frequency (Fo) contours is through pa-rameterization. In these methods, an explicit numerical model is used. The inputs to the model attempt to quantitatively describe prosodic phenomena, in a similar way to that in which targets qualitatively describe them. Therefore, any F0 generation
system using a parametric model contains the same two steps described for target models. Again, the first step consists of generating the parameters of the model from the text. However, the second step is straightforward, since these generated param-eters directly produce an F0 contour. One of the most commonly used parametric
models is that described by Hirose and Fujisaki [21]. It uses the sum of two sets of inputs and filters to produce a F0 contour. See Section 2.1.3 for a detailed
descrip-tion of Fujisaki's model. Another parametric model is the rise/fall/connecdescrip-tion (RFC) model [54], in which F0 is modeled as a sequence of quadratic and linear functions
with varying amplitude and duration. For this model, after finding the best model parameters, an RMS error of between 4 and 7 Hz was achieved between the generated and actual F0 contours. Another use of the RFC model has been as an analytical
tool to locate pitch accents in spoken utterances [55].
2.1.3
Fujisaki's Model
Fujisaki's model is one of the most commonly used parametric models. This section contains a detailed mathematical and graphical description of the model and a survey of its previous uses for analysis and synthesis.
Description
The Fujisaki model proposes that the logarithm of fundamental frequency (Fo) can be modeled as the sum of the output of two filters and a constant. See Figure 2-1 for a block diagram of the model. Each of the filters has two poles at the same location. One filter takes a series of Dirac impulse functions, and its output models phrase level effects. Each impulse and its associated output will be referred to as a phrase accent.
In(F0)
ln(Fmin)
Figure 2-1: Block diagram of Fujisaki's model
The other filter uses step functions as input in order to model the word level effects on the Fo contour. Each step function and its associated output will be referred to as a word or pitch accent. Note that this model creates a continuous Fo contour while most text-to-speech systems only require Fo at discrete times. The desired information can be obtained by sampling the generated contour at the appropriate times. The logarithm of Fo is given by
In Fo(t) =
I
In Fmin + Ap, Gp,(t - tpi)
J
+ Z Aw {Gw (t- twj) -GGwj (-(tw + Tj))},
j=l
Gp, (t) = ai2te-ait u(t) and,
G,wj(t) = (1 - (1 + p3t)e-ut) -u(t)
(2.2) (2.3) are the phrase level output and the word level output respectively. The variables in the above equations are described in Table 2.1.
where
(2.1)
Variable
I
DescriptionFmin Additive constant, minimum fundamental frequency
I, J number of phrase and pitch accents, respectively
Api, AIW amplitude of the ith phrase accent and jth pitch accent ti, t~j onset time of ith phrase and jth pitch accents
Twj length of jth pitch accent
ai, p• rate of decay of phrase and pitch accents, respectively
u(t) step function, equal to zero for t < 0, equal to one otherwise Table 2.1: Description of parameters used in Fujisaki's model
0 0.5 1 1.5 2
Seconds
Figure 2-2: Example output from Fujisaki's model
Example Output
Figure 2-2 contains an example output from Fujisaki's model with one phrase accent and two pitch accents. This contour was created by specifying the baseline F0
(Fmin = 4.2 ln(Hz)), the three parameters of the phrase accent (tp = 0.2 sec, Ap = 0.8, and a = 1 sec-'), and the four parameters of each of the pitch accents (tl = 0.5 sec,
r,1 = 0.2 sec, A~1 = 0.5, /1 = 10 sec- 1, t, 2 = 1.1 sec, Tw2 = 0.4 sec, A,2 = 0.15, and
Previous Uses
Most of the early research on Fujisaki's model focused on proving that it was capable of modeling prosodic phenomena. This was shown by demonstrating an ability to find model parameters such that generated contours were adequately close to observed contours. This capability has been shown in many languages: Japanese [21], German
[36, 37, 38], French [4], Chinese [11], Spanish [16], Swedish [30], and English [14]. More recently, research has focused on using the model to generate Fo contours, but mostly in a rule based manner. In [37], the model parameters were set by rules based on linguistic features (e.g., sentence modality and word accent). In [38], the relationships between the same linguistic features as in the previous study and the model parameters were statistically analyzed, but generation was still rule based. In [36], decision trees based on syntactic information were used, but there was no comparison of predicted and actual Fo contours for an independent test set. In [4], parameters were generated using rules based on a prosodic structure comprised of syntax and rhythm.
Fujisaki's model has been used analytically, for example to find phrase boundaries and examine the characteristics of the parameters in comparison to other features. The model has been used to detect phrase boundaries in Japanese, by finding the lo-cations of the Fujisaki phrase accents [39]. In [20], Fujisaki's model was similarly used to predict phrase boundaries resulting in correct prediction two-thirds of the time. In [13], the parameters were compared with several linguistic features of a sentence, and correlations were found between the parameters and lexical stress, syntactic structure and discourse structure. More recently, in [18], the relationship between targets such as ToBI labels and parameters of the Fujisaki model was investigated. In [17], Fu-jisaki's model was used to analyze the difference between dialogue and reading styles of speech. It was found that the model parameters during dialogue exhibit more variation than when similar speech was read.
2.1.4
Other Models
Various other techniques have also been used to model fundamental frequency (Fo). Hidden Markov Models have been used to generate Fo contours for isolated words [29]. Researchers have attempted to use neural networks to generate Fo. For example, in [47], three Fo values were predicted in each phrase based on phrase characteristics, such as number and type of surrounding phrases. And in [10], neural networks were used to model the physical properties of the body (e.g., vocal folds and thyroary-tenoid) that control Fo. In another example [7], six neural networks were used to produce durations, means, and shapes for generation of Fo contours in Mandarin, at the syllable level. In [33], a combination of neural networks and decision trees was used to predict Fo as two linear functions for every phoneme. In the log2(Hz) domain,
the average absolute value error between the predicted and the realized Fo was 0.203. In a more data driven approach [32], Fo patterns for each syllable were extracted from a prosodic database based on an independence measure that was generated by rule from information such as grammatical categories and stress positions. In [48], prosodic information was predicted from a conceptual representation of a sentence. In [2], linear models were created for several levels, from sentences down to syllables. For synthesis, these models were superimposed, based on linguistic information taken from the new sentence. In [49], a Fo contour was generated for a new sentence by ex-tracting parameters that describe the Fo contour of a similar sentence in a database, and modifying those parameters slightly.
2.2
Information Used for Prediction
The information that is used to predict the Fo contour is just as important as choosing an appropriate model. Without the salient information, prediction will fail. It is usu-ally considered that part-of-speech information is the most important in determining accent, although it can not completely determine the accent level [22]. In [46], mutual information between ToBI labels and many linguistic features was measured. It was shown that lexical stress, part-of-speech, and word class (e.g., content, function, or
proper noun) contain the most information. All of this information has been shown to be relatively easy to produce automatically from text. Some research [43] has used discourse models to find out which words were new to the conversation, indicating that these words should be stressed. However, in [22], it was shown that intona-tional prominence can be modeled well without "detailed syntactic, semantic, and discourse-level information." Intonational phrase boundaries were also important in determining the Fo contour. Some research has attempted to automatically predict phrase boundaries using a stochastic parser [52], decision trees [58], part-of-speech
trigrams [50], and even using Fo information [39]. Furthermore, in [25], descriptive
phrase accents were automatically generated using a very large training corpus of text with associated speech. However, none of these methods has proven to be completely successful.
2.3
Evaluation Techniques
Comparisons between the predicted Fo contour and the actual contour of a sentence in the test set can be made both objectively and subjectively. The ultimate test of the success of an Fo synthesis algorithm is how acceptable the synthesized contour sounds to a human listener. For such subjective tests, the test set could contain only new text, although in practice, it may be useful to assess the predicted Fo contour in relation to the a human reading. However, objective tests are useful to measure progress throughout the course of a project and are necessary for comparing with published results. Common objective tests that have been used include RMS error or average absolute value error in Hz or the logarithm of Hz [6, 33, 44, 54]. The latter is preferred because the perceptual dynamic range of Fo is expressed well in the log domain. When doing objective tests, there are two facts that one must consider; the smallest difference in Hz that can be perceived is approximately 1 Hz and that Fo perception is relative [27]. Thus, some small errors or a general shift in the Fo contour might be imperceptible. A possible subjective test [23, 37] is to synthesize the same utterance with only different Fo contours, and then have subjects rate them
on a scale of one to five. After doing this for many sentences, a mean opinion score can be calculated from the ratings of all the subjects to compare the competing Fo generation algorithms.
Some other less straightforward evaluation techniques have been proposed. In [35], the measure "resemblance to human speech" (RHS) was proposed to test the acceptability of manipulations of the prosody of human speech. Another way of measuring Fo manipulations is to ask a listener to estimate an utterance's liveliness, with more lively speech preferred [57]. In [5], several criteria commonly used to assess synthetic speech were presented, including intelligibility, quality, and cognitive load.
Chapter 3
Training
This chapter describes the training phase of the system. During this phase, a model of fundamental frequency (Fo) generation is chosen to analyze a training database of text and corresponding spoken utterances. Information is added to the database about its lexical, temporal and linguistic structure, before the salient parameters of the Fo model are extracted in an intelligent manner. Finally, models are created to capture both the word-level and the phrase-level prosodic events in a sentence.
Figure 3-1 shows a block diagram of the training process. The four boxes in the first layer of the figure represent the database annotation of Section 3.2, with the dashed line for phrase boundary selection indicating that it is the only module not implemented automatically. The second layer contains the automatic Fujisaki model parameter extraction described in Section 3.3. The final layer is the building of the pitch and phrase models described respectively in Sections 3.4 and 3.5.
3.1
Basic Tools
This section introduces some of the basic tools that are used in this research. A review of the Fujisaki Fo generation model is presented followed by details of the databases that will be used for both training and testing.
r--
I-Figure 3-1: Block diagram of training process
3.1.1
Fo Generation Model
Fujisaki's model, as described in Section 2.1.3, is one of the most commonly used Fo generation algorithms. Due to its ability to model prosodic phenomena, along with its flexibility, this model is ideal for use in this study. Fujisaki's model has almost all of the functionality of the target models discussed in Section 2.1.1. With the phrase accents providing a declining baseline, the pitch accents can be inserted with appropriate amplitudes to mimic both high and low targets. The use of Fujisaki's model allows the relationship between linguistic phenomena and the Fo contour to be determined automatically and statistically. Using a labeling system like ToBI (see Section 2.1.1) to express that relationship would require the use of a manually specified standard and the training database would have to be hand labeled.
3.1.2
Databases: Training and Testing
The database that will be used to evaluate the system is taken from the DARPA 1995 Hub 4 radio database, taken from the Marketplace program. Specifically, it consists
of the subset of those utterances that are all spoken by the anchorperson, David Bran-caccio, without any music in the background. Mr. Brancaccio is a veteran newscaster with over 10 years of experience in broadcasting [34]. The number of sentences spoken by Mr. Brancaccio is approximately 400, each about 20 words long, totaling about one hour of speech. There are many advantages to using this database. The speaker is mostly reading from a script, but he is doing so in a prosodically interesting way. In fact, radio broadcasters attempt to convey as much information as possible through their intonation [12], which makes their Fo contours more meaningful. There are very few disfluencies that make analysis difficult, while there is useful information to be gained by looking at the fundamental frequency. Several recent studies have also used radio corpora [12, 22, 43]. The amount of data from a single speaker is representative of that used in similar recent research [32, 33, 44, 58], allowing meaningful analysis to take place. Due to the declination effect from the phrase accents, Fujisaki's model is usually applied to declarative sentences [16]. Most of the sentences in the database are declarative, but they are somewhat longer than those usually analyzed with Fu-jisaki's model. Nevertheless, this research attempts to apply FuFu-jisaki's model to these prosodically rich sentences. Sentences are analyzed that have been spoken by four other announcers, two male and two female. There is not enough data to train the models for each new speaker. These sentences are used as test sets to measure the Fo generation model's ability to capture information about the Fo contours used in the domain of business radio news. If these tests give poor results, then a model that was trained on a particular speaker represents only that speaker.
Another database, taken from the Wall Street Journal database, is used for com-parison. Approximately 1150 sentences from one male speaker, each about 15 words long, are used for training and testing. These sentences should be less prosodically interesting than the ones from the Marketplace database, because the speaker is not a professional radio announcer, but rather a volunteer. As a result, the Fo contours of these sentences should be easier to analyze.
3.2
Database Annotation
The database must be annotated with prosodic, linguistic and lexical information before the F0 generation model can be trained. The extraction and stylization of
the fundamental frequency is described in Section 3.3.1. Other information to be obtained includes a phone-level alignment, part-of-speech information, lexical stress, and phrase boundary locations. This section presents the methods by which this information is obtained and describes where it is used.
3.2.1
Phone-level Alignment
The phone-level alignment is provided by supervised recognition, using the develop-ment system from the speech group at IBM's T. J. Watson Research Center. The recognizer is given both the words and the speech of the sentence. The information returned is the list of phones that occur in the utterance, together with start and end times for each phone. In Section 3.3.3, the location of the vowel phones will be used to determine the location of pitch accents. In addition, regions of silence are marked where there is no speech present. This information is used in locating phrase boundaries (see Section 3.2.4) and as part of the context in the decision tree questions
(see Section 3.4.3).
3.2.2
Part-of-Speech Information
The database is annotated with part-of-speech information for each word in a sen-tence, so that questions can be asked about the linguistic context when the decision tree is built for pitch accents (see Section 3.4.3). The 36 part-of-speech categories, as defined by the Penn Treebank Project [51], are divided into 14 subsets plus a cat-egory for silence. The subsets were created such that similar part-of-speech tags are grouped together, and so that each subset will have a significant number of words in the training data associated with it. See Table 3.1 for a complete list of all categories. These part-of-speech tags are obtained using a stochastic parser that was developed at IBM Research by Adwait Ratnaparkhi.
Number Name Tags Used 1 Noun NN, NNS 2 Proper Noun NNP, NNPS 3 Base Form Verb MD, VB
4 Participle VBD, VBG, VBN 5 Present Tense Verb VBP, VBZ
6 Adjective JJ, JJR, JJS 7 Adverb RB, RBR, RBS, WRB 8 Determiner DT, WDT 9 Pronoun PRP, PRP$, WP, WP$ 10 Preposition IN, RP 11 To TO 12 Conjunction CC 13 Number CD
14 Other EX, FW, LS, PDT, POS, SYM, UH 15 Silence
Table 3.1: Part-of-speech categories. The acronyms in the right hand column refer to labels used in the Penn Treebank project [51].
3.2.3
Lexical Stress
Each syllable is annotated with a lexical stress of primary, secondary, or unstressed, which is used as a question in building the pitch accent decision tree (see Sec-tion 3.4.3). This informaSec-tion is obtained by looking up each word in the COMLEX English Pronouncing Dictionary [28], assuming that the first pronunciation is correct. If a word is not in the (approximately 90,000 word) dictionary, then a stress pattern of primary followed by a sequence of unstressed, secondary stress pairs is assumed. A word was not found in the dictionary approximately 1.5% of the time in the Market-place database. The dictionary was designed from several databases, including the Wall Street Journal database, and therefore all words in that database were defined in the dictionary. The same dictionary provides information about classes of words. The function word designation, as defined by COMLEX, is used as a question for decision tree building. A function word is a word that does not provide any semantic meaning, such as "the," "am," "anyhow," and "but".
3.2.4
Phrase Boundaries
Phrase boundaries are hand labeled based on the lexical transcription of a supervised recognizer (see Section 3.2.1). These phrase boundary locations are used both in the pitch accent model, as questions in building the decision tree (see Section 3.4.3), and in the phrase accent model, as the basis for the location of the accents (see Section 3.5). This is the only stage in database annotation that is not done automatically. This task is reported to have been accomplished automatically in recent literature [39, 52, 50, 58], but none of these results are duplicated here.
Three types of phrase accents have been designated so that their behavior can be modeled separately. A type 1 accent is at the beginning of a sentence, and usually only occurs at the start of the utterance. Types 2 and 3 occur during the middle of the sentence at boundaries between clauses or phrases. Type 3 accents are associated with a silence, because the speaker usually pauses before beginning a new phrase. Type 2 accents are not associated with a silence, but are placed in locations where phrase boundaries might occur. Note that the only information taken from the spoken utterance is the silence locations, otherwise the phrase boundaries are determined solely by the structure of the text. Heuristics used in assigning phrase boundaries include that they should be evenly spaced, if possible, and should occur approximately every eight to ten words.
3.3
Parameter Extraction
This section describes how, given the speech and the text of an utterance, parameters for the Fujisaki model are extracted that best describe that utterance. Initially the Fo contour is extracted, and stylized to remove any outliers (see Section 3.3.1). In Sec-tion 3.3.2, a search technique based on the structure of Fujisaki's model is employed. During the search, the parameters are constrained both to associate them with rele-vant linguistic events and to make the search more efficient (see Section 3.3.3). Finally in Section 3.3.4, some results are presented using the techniques described here.
3.3.1
Fo Extraction and Stylization
The fundamental frequency (Fo) for each ten millisecond frame of the original utter-ance is extracted using an autocorrelation method. This method convolves the speech waveform with itself and finds the biggest peak away from the origin. A frame could also be found to contain silence or unvoiced speech, neither of which has a valid F0
value. In such a case the frame is assigned a Fo value of 0 Hz. Since this computed F0 contour contains a few outliers, a median filter technique is used to remove them.
The median is taken of the five Fo values taken from the current frame and the two previous and two next frames. If the current frame has been assigned a "positive" F0
value and the difference between that value and the median is greater than 15 Hz, then the computed F0 value is changed to the median. See Section 3.3.4 for some
results on how often F0 values were changed in this manner. Those frames that have
F0 values of 0 Hz are assigned positive values by linear interpolation. The new F0
value for one of these frames, f, at a particular time t, is given by
fe
= ((tW
- tc) .fp + (t - tp) fn)/(tn - tp)
(3.1)
where f, and t, are the closest previous Fo value and time and fn and t, are the closest next F0 value and time. The final step in F0 stylization is a low pass filter.
This stage further smooths the contour and reduces the number of extrema that are used later to find the best phrase accents (see Section 3.3.2).
3.3.2
Search Technique
The objective is to find Fujisaki model parameters that generate a F0 contour that
is as close as possible to the observed (stylized) contour. Although Fujisaki's model has been used extensively, there are very few specific descriptions of an algorithm for performing this task. One suggested method [19] uses a left-to-right search to determine each successive phrase and pitch accent. Even without descriptions, most researchers agree that the parameters should be chosen such that the mean squared distance between the observed and the generated contours should be minimized. In
this study, this error is only computed at those frames that were originally assigned a valid Fo value. There is no closed-form solution to this problem, thus the search for these parameters is performed iteratively, using a gradient descent algorithm. This algorithm requires starting locations for all of the parameters and partial derivatives of the error with respect to each parameter.
Searching for all of the parameters simultaneously proved to be cumbersome, and therefore the search is divided into two parts: finding the best phrase accents and finding the best pitch accents. The phrase accents are intended to describe the baseline of the Fo contour. Therefore, the error to be minimized is not computed at every frame with a valid Fo value. Instead, the minima of the stylized contour are found, and the phrase accents are chosen such that the error between the generated and observed contour at those points is minimized. Using the optimal phrase accents that have been computed, the pitch accents are found that minimize the error between the generated and observed Fo contours. For this stage, the error is calculated using all of the frames with valid Fo values, since the phrase and pitch accents comprise the entire generated contour.
3.3.3
Parameter Constraints
To perform the search described in Section 3.3.2, a specific number of phrase and pitch accents must be decided upon. This number has to be limited, otherwise any optimization algorithm will overfit the realized Fo contour and the extracted param-eters will have less significance. Each accent should be related to some linguistic phenomenon so that deriving new accents from new text will be possible. A similar idea of parameter extraction based on linguistic context was introduced in [15].
To achieve both limitation and linking of accents, the times of the phrase accents
(tp,) and the end times of the pitch accents (tzw + •'w) will be determined by
infor-mation present in the database. The times of the phrase accents are determined by the phrase boundaries, marked by hand as described in Section 3.2.4. The end times of pitch accents are placed in the vowel phones of stressed syllables, as determined by the supervised alignment described in Section 3.2.1. This reduction in freedom of
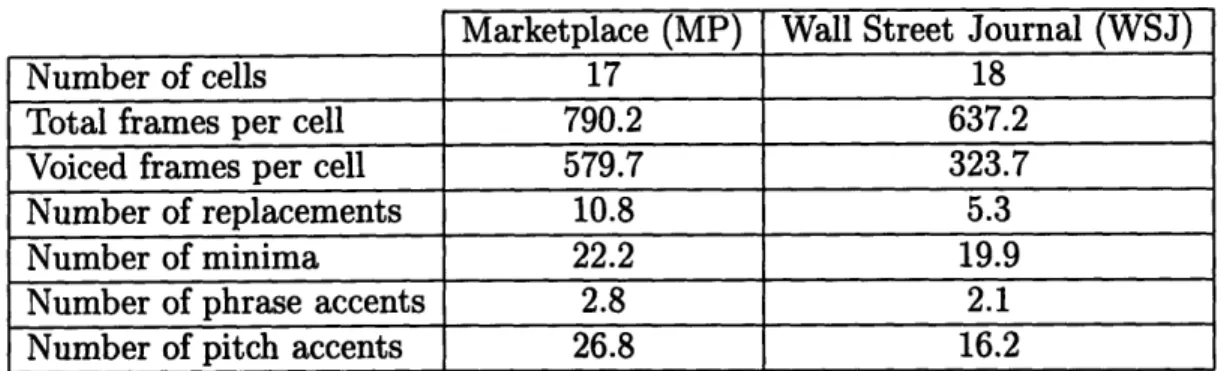
Number of cells Total frames per cell Voiced frames per cell Number of replacements Number of minima
Number of phrase accents Number of pitch accents
Marketplace (MP) 17 790.2 579.7 10.8 22.2 2.8 26.8
Table 3.2: General information about the database subsets used for comparing search techniques (average values)
the search space does not significantly increase the error when the optimal param-eters are found (see Section 3.3.4). With these limitations, each phrase accent has one parameter (amplitude) and each pitch accent has two parameters (length and
amplitude) which need to be varied to find the optimal accent parameters.
Another constraint that will be used is that the global parameters, a,
3,
andFmin, will remain constant after finding suitable values. It has been shown that these
global parameters are relatively constant for a particular speaker [16, 21, 38, 39]. The global parameters are also chosen in an iterative manner. A representative sample of sentences are picked and the search for the optimal accent parameters is carried out. This procedure is repeated, changing only the global parameter values, until a minimum is found. The decay rate for the phrase accents (a) and the baseline Fo value (Fmin) are chosen such that the error between the generated and observed Fo contours at the minima of the stylized contour is smallest. Then, the decay rate of the pitch accents (,3) is varied while searching for the optimal pitch accent parameters. The
3
which corresponds to the the smallest error between original and generated F0contours is chosen.
3.3.4
Searching Results
To compare the results of various searching techniques, twenty sentences were chosen at random from each of the two databases to be analyzed. Information about these subsets is provided in Table 3.2. Of those sentences, two from the Wall Street
Wall Street Journal (WSJ)
18 637.2 323.7 5.3 19.9 2.1 16.2
Journal (WSJ) comparison database and three from the Marketplace (MP) compar-ison database had to be discarded. For these sentences, the first searching condition on Table 3.3 reached a local minimum, and the error was approximately five times greater than than for the other searching conditions. The total frames in the cell represents the number of ten millisecond frames from beginning to end of the utter-ance, including initial and final silences. The voiced frames per cell represents the number of frames that were judged to have a valid Fo value, based on silence and voicing tests. The ratio of voiced frames to total frames is higher for the MP data because there are shorter pauses between words and because in the WSJ data there is a tendency to trail off at the end of words, causing silence to be marked incorrectly. The number of replacements is the number of times a Fo value was replaced by the median of the Fo values of its surrounding frames in Fo stylization (see Section 3.3.1). Note that this correction was only invoked for less than 2% of the voiced frames, indicating that the output of the original Fo extraction algorithm is fairly consistent. The number of minima is the number of points found in the stylized Fo contour that will be used in the first part of the two-part searching style (see Section 3.3.2). The number of phrase and pitch accents is the average number of each in the sentences used for comparison. Note that the ratio of pitch accents to phrase accents is greater for the MP data. The number of pitch accents is determined automatically, but the number of phrase accents is determined by hand. The different ratios might reflect an inconsistency in the hand-labeling of the two databases.
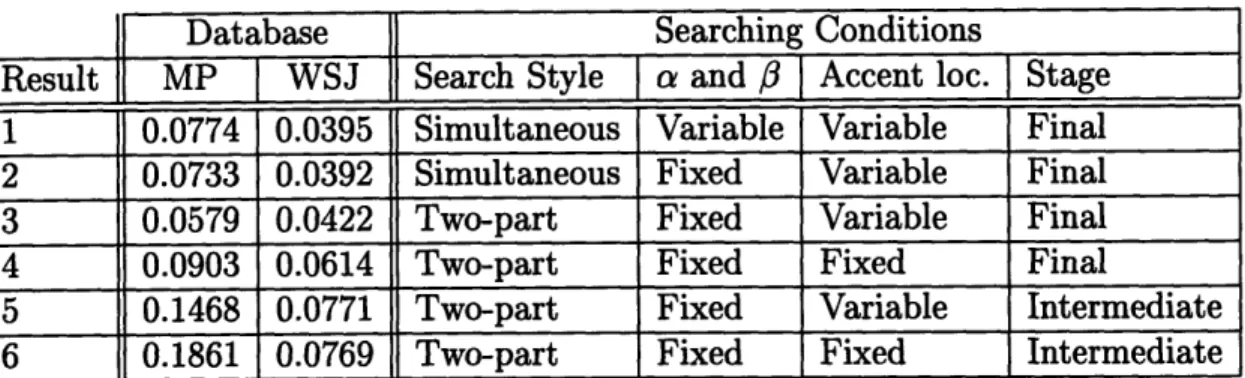
Table 3.3 presents results from several search conditions. In all conditions, the same number of phrase and pitch accents are used. The numbers in the table represent the average of the mean squared error between the stylized and generated Fo contours of all the sentences in the database subsets. The units are ln(Hz) per frame, with the first four results calculated over all frames with valid Fo, and the last two results calculated only for the minima of the stylized contour. The searching conditions refer to the techniques and parameter constraints discussed in Sections 3.3.2 and 3.3.3. Search style is either a simultaneous search where all parameters are found at the same time, or a two-part search where the phrase and pitch accent parameters are
I
Database Searching Conditions Result MP WSJ 1 0.0774 0.0395 2 0.0733 0.0392 3 0.0579 0.0422 4 0.0903 0.0614 5 0.1468 0.0771 6 0.1861 0.0769Simultaneous Variable Variable Final Simultaneous Fixed Variable Final Two-part Fixed Variable Final Two-part Fixed Fixed Final
Two-part Fixed Variable Intermediate Two-part Fixed Fixed Intermediate Table 3.3: Results from parameter extraction for various search conditions, RMS error in ln(Hz) per frame between extracted and observed Fo contours
found in separate stages. The global parameters a and P can be variable so that the search algorithm can find the optimal values for each sentence or fixed to some globally optimal values for all sentences. Note that the global parameter Fmin is fixed for all search conditions. The locations of the phrase and pitch accents can be either variable or fixed as discussed in Section 3.3.3. Finally, the first four results (final stage) contain errors computed for the entire generated contour while the last two results (intermediate stage) are errors just for the phrase accent component of the two-part search.
For both of the databases, the results indicate that restricting the search space does not lead to a serious disadvantage for finding parameters of the Fujisaki model that adequately describe the observed Fo contour. When a and P are allowed to vary, the result is just as good as when they are fixed to one optimal value for all sentences. These variables have the largest gradient with respect to the error. Therefore, the gradient descent algorithm effectively optimizes a and 8 first, and sometimes these local minima do not allow the other parameters to reduce the error further. The continued restriction of the search space by using a two-part search has surprising results. For the WSJ database, results 2 and 3 are not very different. However for the MP database, the two-part search performs significantly better than the simultaneous search, with all other conditions equal. These results indicate that both breaking up the search and finding the phrase accents based on minima are good ideas. The biggest
Search Style a and Accent loc.
I
Stageloss of performance occurs when the accent locations are fixed to values specified by phrase boundary and lexically stressed syllable locations (result 4). However, the small degradation does not outweigh the advantage of having each accent directly linked to a word or phrase. Results 5 and 6 behave differently for each database. For WSJ, it shows that fixing the locations of the phrase accents has negligible effect on the error between the generated intermediate contour and the minima of the stylized contour. However for MP, the trend observed in results 3 and 4 that fixing accent locations is detrimental to performance is observed again. Generally, the error for the MP database is higher than for the WSJ database. This is due to the higher variability of the Fo contour for trained radio commentators than for average people reading hundreds of sentences into a recorder.
3.4
Pitch Accent Model
This section describes the model of the word-level pitch accents. In order to enable an accent to be specified in a particular context at synthesis time, the context/pitch-accent pairs are clustered using binary decision trees, [3]. During synthesis (see
Chapter 4), the new contexts are dropped down the trees to determine from which leaf the accents should be generated. The trees enable both seen and unseen contexts to be handled during synthesis. Such a decision tree is built using questions and data designed specifically for this task. Although the leaves are created so that similar data are clustered together, there still is a degree of variance within each leaf. Therefore, several prototypes are created at the leaves of this tree, so that during synthesis a typical accent will be used for each leaf. Finally, probabilities are calculated for use in choosing the best prototypes to use during synthesis.
3.4.1
Decision Tree Description
A binary decision tree is built in order to cluster similar pitch accents together, by asking binary questions about context at each node in the tree. For this decision tree, similarity is measured by assuming a Gaussian distribution for the data in each node,
and maximizing the log likelihood of the data. A further assumption made is that each element (i.e., length or amplitude of a pitch accent) of the data is independent of all other elements.
The following procedure is followed at each node in the tree which has not yet been split into two nodes. This current active parent node is divided into two children nodes, henceforth known as left and right children. The division is accomplished using a binary yes-or-no question that is asked about the context of each data point. Therefore, each data point in the parent node goes into exactly one of the children nodes. For example, Xp, Xr, and X, are the sets of data at the parent, right child and left child nodes respectively. Then,
X, U Xi = Xp, and (3.2)
X, n X, = 0. (3.3)
At each of these three nodes, the mean and variance of the data in that node is calculated. For each set X,, the mean is ., and the standard deviation is a,, and for each dimension d the mean and standard deviation are py and ao . Due to the
assumption of independence of each dimension, the likelihood of element xi in set X, is given by a product of one-dimensional Gaussian probability density functions,
p,(xi)
=
I
,
(3.4)
where D is the total number of dimensions (the number of parameters associated with each accent). The total log likelihood of set X, is given by
LS = lIn(p,(x,)). (3.5)
XiEX,
From all of the possible questions, the one that is used to split the data in that node must meet the following two criteria. The first is that the size of both of the children nodes, jXI and |XII, must be greater than a set threshold. For all of the questions
Context Data
Previous Current Intensity Noun Verb 1 Verb Noun 3 Noun Noun 2 Verb Verb 4 Noun Verb 2 Total Log Likelihood = -7.25
Left Right Total Question Data Likelihood Data Likelihood Likelihood Previous = Noun 1, 2, 2 -2.11 3, 4 -1.64 -3.75
Current = Noun 2, 3 -1.64 1, 2, 4 -5.03 -6.67 Table 3.4: Simple decision tree example
that meet the first criteria, the one that maximizes the gain in total log likelihood,
L, + L1 - L,, is chosen. A node does not produce any children if no questions satisfy
the first criteria or if the gain in log likelihood does not exceed another set threshold. A node with no children is referred to as a leaf. Trees of various sizes can be grown by changing the two thresholds. See Appendix B for some example decision trees grown from actual data.
An example is illustrated in Table 3.4. In this contrived example, the current node contains five data points, the context consists of the previous and current part-of-speech, and the data is one-dimensional. Of the two questions that can be asked, clearly the first one divides the data into sets with more similar elements. This intuitive sense of similarity is reflected in the larger gain in log likelihood for the first question,
(-3.75
-
(-7.25)
=
3.5) > (-6.67
-
(-7.25)
=
0.58).
(3.6)
3.4.2
Decision Tree Data
As discussed in Section 3.3.3, the end time of a pitch accent is determined before the search for the optimal parameters takes place. With this information known, a pitch
accent can be completely described with just two values, its length and amplitude (-r, and A,). Another value that has proved useful in describing an accent is its intensity, which is the length multiplied by the amplitude. The intensity has been found to be a better quantitative measure of its effect on F0 than either of the other parameters.
Additionally, the intensity of a pitch accent is equal to the integral of the output of the pitch accent filter associated with that pitch accent.
Without intensity, any creation of prototypes through averaging will fail. For ex-ample, consider two accents, one with length 2 and amplitude 0.5, and the other with length 0.5 and amplitude 2. Both have intensity equal to 1, but a prototype accent with each dimension averaged separately will have length and amplitude equal to 1.25. This prototype's intensity is more than 50% greater than the original accents' inten-sities. Another concept introduced and used here is that of relative length. Instead of the absolute time between the start and the end of the accent, the relative length is this absolute time divided by the length of time between the end of the previous accent and the end of the current accent. This concept reduces variability and allows for similar accents at different speaking rates to have similar representations.
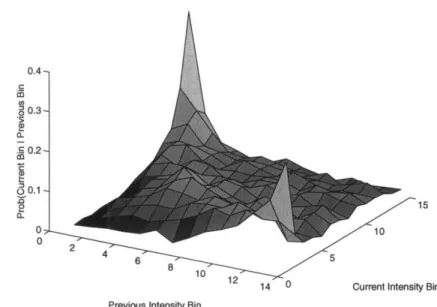
To exploit the regularity in intensity variation between accents, quantized intensity level are introduced. Once all of the accents in the training set are found, M + 1 bin markers, bo,..., bM, are found such that the number of accents from the training set in each bin is the same. A bin Bm contains those data points whose intensities are greater than b(m,-) and less than or equal to bin. These bins are created to allow information about the variation of intensity to be quantified. An example of the predictability of intensity variation is taken from the marketplace training set with 14 bins plus one for end and beginning of sentence. Figure 3-2 presents this example, with a visual description of the intensity variation when transiting from one accent to another. Note particularly that accents with the lowest and highest intensities are very likely to be followed by accents with the highest and the lowest intensity levels, respectively. While the accents in the middle intensity levels tend to be more evenly distributed, there is still a general trend of greater probability along the reverse diagonal.
0.4 0.3-0~ .- 0.2-'A oS 0.1 0 S0.1 0 0 15, /-is1 24 5 24~ 6 8 10
14 0 Current Intensity Bin Previous Intensity Bin
Figure 3-2: Graphical intensity bin variation probabilities
3.4.3
Decision Tree Questions
The questions that are used to build the tree essentially define the information that will be used to predict the level of the accents for new sentences. The information that other research has used for this task is described in Section 2.2. The questions that are used to grow the decision tree in this study are about the linguistic and lexical context of the text in which the accents originally occurred. There are five types of questions that can be asked. The first type is the part-of-speech category of the current word or the preceding and following three words. This information is obtained as described in Section 3.2.2. The second type of question asks whether or not the current word is a function word. The third type of question asks about the level of lexical stress, either primary or secondary, of the current syllable. Informa-tion used by these two quesInforma-tions is obtained as in SecInforma-tion 3.2.3. The fourth type of question asks how far the current accent is away from the previous phrase bound-ary. Phrase boundaries are located as in Section 3.2.4. The final type of question is about the intensity bin of the previous accent in the training data. The intensities are quantized into fourteen levels, as in Section 3.4.2, plus one for the beginning of
the sentence. At every node, all potential questions are asked, but only the one that produces the largest gain in log likelihood is used to split the node. The process of choosing the best question is described in Section 3.4.1. The average values of the intensity levels for both training databases in relation to the information in the first four types of questions is presented in Appendix A.1. The analysis presented there demonstrates that intensity does vary systematically with context, which establishes context clustering as a reasonable model building strategy. Additionally, Appendix B contains example decision trees with their associated questions that have been gen-erated from actual data. These examples demonstrate that questions of all types are asked, especially those about previous intensity level, surrounding part-of-speech tags, and the function word designation.
3.4.4
Prototypes
The L leaves of the decision tree, vl, v2,... , VL, divide the data points into sets for
each leaf, Y1, Y2,... , YL, where Y1, is the set of data points that match the context
defined by the leaf vl. For a particular leaf, vl, at most J prototypes are created using a combination of k-means clustering and an iterative probabilistic clustering procedure. The procedures are carried out for each leaf individually.
K-means clustering is used to partition the N data points in the set YJ of the leaf vl into J regions. This process consists of arbitrarily choosing starting prototype locations, then iteratively placing each data point with the nearest prototype and recalculating the prototypes as averages of the data points associated with it. The final D-dimensional k-means prototypes, pi, p2, ... , pJ, are used as seeds to an
itera-tive probabilistic procedure. These seed prototypes are further refined to produce the prototypes, rll, r21,. . ., Jl, necessary for synthesis of the Fo contour. This iterative
probabilistic procedure consists of several steps, which are described below. The first step is similar to part of the k-means clustering process. Each data point (a vector),


![Table 3.1: Part-of-speech categories. The acronyms in the right hand column refer to labels used in the Penn Treebank project [51].](https://thumb-eu.123doks.com/thumbv2/123doknet/14132952.469284/28.918.210.765.131.499/table-speech-categories-acronyms-column-labels-treebank-project.webp)