Publisher’s version / Version de l'éditeur:
Scientific Reports, 6, pp. 1-8, 2016-06-15
READ THESE TERMS AND CONDITIONS CAREFULLY BEFORE USING THIS WEBSITE. https://nrc-publications.canada.ca/eng/copyright
Vous avez des questions? Nous pouvons vous aider. Pour communiquer directement avec un auteur, consultez la première page de la revue dans laquelle son article a été publié afin de trouver ses coordonnées. Si vous n’arrivez pas à les repérer, communiquez avec nous à [email protected].
Questions? Contact the NRC Publications Archive team at
[email protected]. If you wish to email the authors directly, please see the first page of the publication for their contact information.
NRC Publications Archive
Archives des publications du CNRC
This publication could be one of several versions: author’s original, accepted manuscript or the publisher’s version. / La version de cette publication peut être l’une des suivantes : la version prépublication de l’auteur, la version acceptée du manuscrit ou la version de l’éditeur.
For the publisher’s version, please access the DOI link below./ Pour consulter la version de l’éditeur, utilisez le lien DOI ci-dessous.
https://doi.org/10.1038/srep27825
Access and use of this website and the material on it are subject to the Terms and Conditions set forth at
Thermally insensitive determination of the linewidth broadening factor
in nanostructured semiconductor lasers using optical injection locking
Wang, Cheng; Schires, Kevin; Osiński, Marek; Poole, Philip J.; Grillot,
Frédéric
https://publications-cnrc.canada.ca/fra/droits
L’accès à ce site Web et l’utilisation de son contenu sont assujettis aux conditions présentées dans le site LISEZ CES CONDITIONS ATTENTIVEMENT AVANT D’UTILISER CE SITE WEB.
NRC Publications Record / Notice d'Archives des publications de CNRC:
https://nrc-publications.canada.ca/eng/view/object/?id=d685ba98-eae9-4812-ae6b-c1898cc2212b
https://publications-cnrc.canada.ca/fra/voir/objet/?id=d685ba98-eae9-4812-ae6b-c1898cc2212b
thermally insensitive determination
of the linewidth broadening factor
in nanostructured semiconductor
lasers using optical injection locking
Cheng Wang
1, Kevin schires
1, Marek Osiński
1,2, philip J. poole
3& Frédéric Grillot
1,2In semiconductor lasers, current injection not only provides the optical gain, but also induces variation of the refractive index, as governed by the Kramers-Krönig relation. the linear coupling between the changes of the efective refractive index and the modal gain is described by the linewidth broadening factor, which is responsible for many static and dynamic features of semiconductor lasers. Intensive eforts have been made to characterize this factor in the past three decades. In this paper, we propose a simple, lexible technique for measuring the linewidth broadening factor of semiconductor lasers. It relies on the stable optical injection locking of semiconductor lasers, and the linewidth broadening factor is extracted from the residual side-modes, which are supported by the ampliied spontaneous emission. This new technique has great advantages of insensitivity to thermal efects, the bias current, and the choice of injection-locked mode. In addition, it does not require the explicit knowledge of optical injection conditions, including the injection strength and the frequency detuning. The standard deviation of the measurements is less than 15%.
Quantum luctuations associated with the lasing process afect both the intensity and the phase of the optical ield. While all lasers experience phase luctuations caused by spontaneous emission, carrier luctuations in semicon-ductor lasers provide a second mechanism of phase luctuations due to the coupling between the carrier density, the optical gain, and the refractive index in the optical cavity. his phase-amplitude coupling is a key feature dis-tinguishing semiconductor lasers from any other type of lasers, and is responsible for a much broader linewidth in semiconductor lasers. he parameter that quantiies the magnitude of this efect is the linewidth broadening factor (LBF), also known as α H-factor, introduced in the context of linewidth analysis by Henry1. It describes the coupling between the carrier-induced variation of real and imaginary parts of the efective susceptibility χ 2:
α χ χ π λ = − = − d dN d dN dn dN dG dN / / 4 / / , (1) H Re r Im
where N is the carrier density and λ is the lasing wavelength. he real part χRe determines the efective refractive index nr, while the imaginary part χIm determines the modal gain G of the laser. In contrast to the fundamental quantum limit originally proposed by Schawlow and Townes taking into account the spontaneous emission3, the spectral linewidth in a semiconductor laser is broadened by a factor of (1 + αH2)4. Semiconductor lasers with bulk and quantum-well (Qwell) active regions usually have LBFs of 2.0~5.0 2. Intersubband quantum cascade lasers, based on multiple-Qwell or superlattice structures, exhibit small values of LBF owing to the intersubband optical transitions and the discrete energy levels5,6. In contrast, low-dimensional nanostructured quantum dash (Qdash) and quantum-dot (Qdot) lasers have much more complex carrier dynamics7, leading to a wide spread of LBF values from near-zero up to more than 108,9.
Extensive studies have shown that the LBF also afects many other features of semiconductor lasers, such as the frequency chirping under current modulation2, mode stability against optical feedback10, nonlinear dynamics 1CNRS LTCI, Télécom ParisTech, Université Paris-Saclay, 46 Rue Barrault, 75634 Paris Cedex 13, France. 2center for High Technology Materials, University of New Mexico, 1313 Goddard St. SE, Albuquerque, NM 87106-4343, USA. 3National Research Council of Canada, Ottawa, ON, K1A 0R6 Canada. Correspondence and requests for materials should be addressed to F.G. (email: [email protected])
received: 02 March 2016 Accepted: 25 May 2016 Published: 15 June 2016
www.nature.com/scientificreports/
under optical injection11, four-wave mixing generation12, as well as the ilamentation in broad-area semiconduc-tor lasers13. Many eforts have been made for the characterization of the LBF. Osiński and Buus14 and Villafranca et al.15 overviewed various measurement techniques. hese techniques can be classiied into three types: (I) Analysis of the optical spectrum, including the optical linewidth method1 and the Hakki-Paoli method16, relying on simultaneous observation of the longitudinal mode wavelength shit and the modal gain changes with varying current below lasing threshold. (II) High-frequency modulation, including the FM/AM method17,18 and the Fiber Transfer Function method19. (III) External optical control, including the optical injection20, the optical feedback21, and the four-wave mixing methods22. Although all the above-threshold techniques can be used under the exactly controlled operating conditions of the device, the extracted LBF results from a complex combination of multiple efects. For instance, above the lasing threshold, the LBF becomes an efective parameter dependent on the optical power23,24, the type of cavity (distributed feedback vs Fabry-Perot)25,26 and the gain nonlinearities due to spec-tral hole burning, spatial hole burning, and carrier-heating efects27–29. Consequently, the LBF measured above threshold may mask the basic features of the semiconductor material. herefore, it is still of interest to access asymptotic values of the LBF parameter close to threshold, in particular to probe its dependence on carrier con-centration and photon energy that cannot be varied in the real operating conditions above threshold.
To start with, we briely review the Hakki-Paoli method and the optical injection method, which is helpful for the understanding of the novel method proposed in this paper. he Hakki-Paoli method relies on the recording of sub-threshold ampliied spontaneous emission spectrum. hrough measuring the changes of the wavelength shit and the modal gain of the Fabry-Perot (FP) modes with the current, the LBF deined in Eq. (1) is equivalently determined by30 α π δλ λ = − L d dI dG dI 2 / / , (2) H net
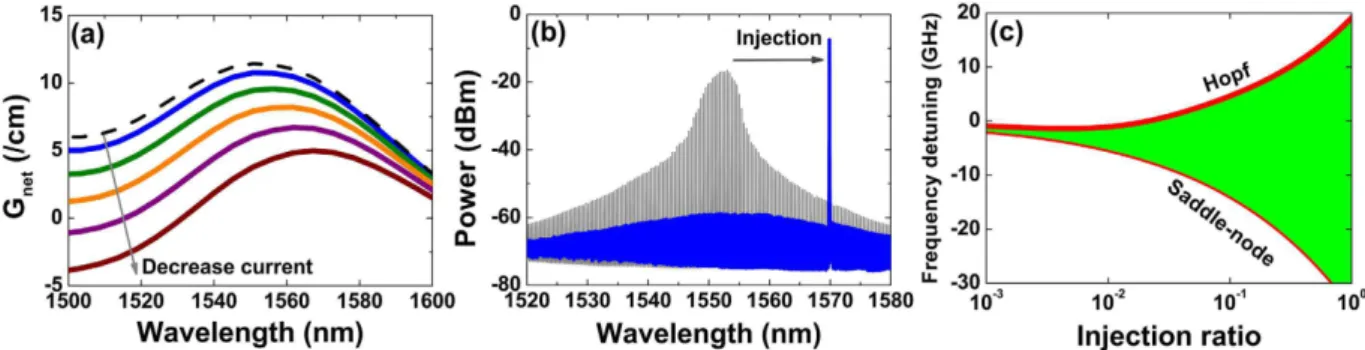
where L is the cavity length, δ λ is the mode spacing, and dλ and dGnet are respectively the mode wavelength and net modal gain variations caused by the current change dI. Figure 1a presents a set of sub-threshold gain spectra, obtained from a multipopulation rate equation model31,32. It shows that when the pump current decreases from the lasing threshold, the net modal gain Gnet is reduced gradually from its threshold value (dashed curve). his method is relatively straightforward, but severely sufers from thermal efects, which cause a red-shit of the opti-cal wavelength and thereby interfere with the tracking of the carrier-induced blue-shit efect. In order to reduce the thermal efects, a current source operated in the pulsed mode instead of the continuous-wave mode can be utilized, but this results in a low signal-to-noise ratio and even irregular spectral line shape, which can hinder the extraction of the LBF. On the other hand, the optical injection method utilizes the optical injection efects to extract the LBF of the injection-locked mode. When a free-running FP semiconductor laser is biased above the threshold, many cavity modes can lase simultaneously, as shown in Fig. 1b (gray lines). However, once the laser is stably locked to an external single-mode laser (master laser), only the mode subject to the optical injection keeps lasing, while all side-modes are suppressed (blue lines). he stable-locking range is bounded by Hopf bifurcation and the saddle-node bifurcation, as illustrated in Fig. 1c (green area)33, where the asymmetry is induced by the non-zero LBF11. herefore, the LBF of the mode subject to optical injection could in principle be determined from the slope of the two bifurcations20. However, this measurement requires the knowledge of accurate values of the frequency detuning Finj (optical frequency diference between the master and slave lasers) and the injection ratio Rinj (ratio of the injected signal power Pinj to the free-running slave laser power P0, both inside the slave laser cavity), which is very challenging to implement in practice. his is because there is a mode proile mismatch between the master beam projected onto the slave laser facet and the slave guided mode, which can substantially reduce the efective injection strength.
In this paper, we present a simple, lexible method for measuring the LBF of semiconductor lasers, based on the analysis of residual side-modes of a laser under optical injection. In contrast to the aforementioned tech-niques, the novel proposed method does not require any sophisticated high-frequency equipment and is insen-sitive to thermal efects, injection conditions, or the pump current level. he measured LBF values are compared with those obtained by the Hakki-Paoli method, and are shown to have a standard deviation of less than 15%. Figure 1. (a) Simulated sub-threshold net modal gain. he dashed curve is the gain at the threshold. (b) Measured optical spectra. he gray lines are for the free-running laser, and the blue lines are for the injection-locked laser. (c) Simulated stable injection-locking diagram (ater ref. 33).
Results and Discussion
As discussed in Fig. 1b, optical injection suppresses the side-modes in a FP semiconductor laser. In order to understand the underlying physical mechanism, Fig. 2 simulates the efects of optical injection on the net modal gain of a Qdot laser using the multipopulation rate equation model. It shows that both an enhancement of the injection ratio (Fig. 2a) and an increase in the wavelength detuning (Fig. 2b) reduce the whole net modal gain compared to that of the free-running laser (dashed curve). Consequently, in both cases the reduced gain leads to a suppression of side modes. he gain reduction efect of optical injection can be understood by examining the steady-state solutions of the classical rate equation model for injection-locked semiconductor lasers34
ϕ ∆G = − k v R P P 2 / cos , (3) net c g inj 0 S
with the phase ϕ of the laser ield expressed as
ϕ π α α = − + − . − F − k R P P sin 2 / (1 ) tan (4) inj c inj S H H 1 0 2 1
Here, kc is the coupling coeicient of the master laser to the slave laser, vg is the light group velocity, and PS is the intra-cavity power of the slave laser under optical injection. he above equations point out that the injection ratio Rinj directly reduces the net modal gain Gnet through the carrier population, while the frequency detuning Finj does the same indirectly through the phase of the laser ield. From the physics viewpoint, optical injection pushes the cavity resonance to the longer wavelength side. herefore, an increase in the wavelength detuning shits the lasing mode towards the cavity resonance, and hence reduces the gain to a lower level. In addition, Fig. 2 also demon-strates that the wavelength detuning changes the net modal gain more linearly than the injection ratio, and the gain reduction behavior is similar to that induced by the pump current in the Hakki-Paoli method in (cf. Fig. 1).
From the knowledge of Kramers-Krönig relationships, the wavelength detuning of optical injection in Fig. 2b not only changes the gain of the side-modes, but also shits the wavelengths. Consequently, we can recast the LBF expression in Eq. (2) as α π δλ λ λ λ = − L d d dG d 2 / / , (5) H m net m
with λ m being the injection wavelength of the master laser. Equation (5) provides the basis for experimental determination of the LBF using the optical injection-locking technique. A similar formula can be deduced by varying the injection power from the master laser based on Fig. 2(a). However, this approach is less lexible due to a nonlinear dependence of the gain on the injection ratio, as well as the usual power limitation of tunable laser sources. It should be noted that a method utilizing an external light to measure the LBF of a below-threshold semiconductor laser has been reported35, but that method takes advantage of the cavity resonance efect, which is diferent from the injection-locking mechanism discussed in this work.
he experiments were performed on two types of diode lasers with nanostructured active regions, incorporat-ing either Qdashes or Qdots. Owincorporat-ing to a more complex electronic structure, variations of the LBF in such lasers are more pronounced, which constitutes a better coniguration for the validation of the novel method proposed in this paper. he experimental setup and the nanostructured semiconductor lasers are described in the Methods section.
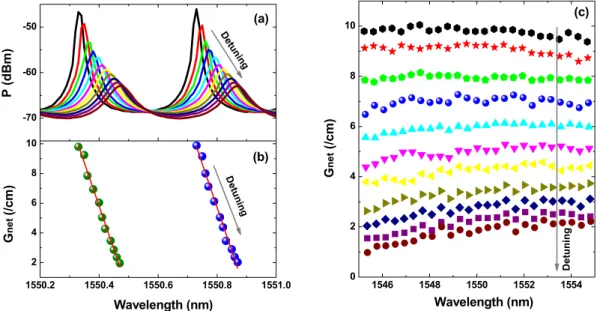
We irst illustrate the proposed technique taking an example of the Qdash laser described in the Methods section. he laser had a lasing threshold of Ith = 45 mA, and the gain peak was located around 1550 nm. Figure 3 shows the LBF measurement procedure for the Qdash laser biased at 60 mA. he optical injection with a ixed Figure 2. Efects of optical injection on the net modal gain spectrum of a Qdot laser. (a) he injection ratio Rinj increases from 0.3 to 2.7 by a step of + 0.6, with a ixed zero wavelength detuning; (b) he wavelength is detuned from − 99 pm to + 33 pm by a step of + 33 pm with a ixed injection ratio of 2.7. he dashed lines denote the gain without optical injection.
www.nature.com/scientificreports/
incident power of 6.1 mW was applied to a longitudinal mode at about 20 nm away (~1570 nm) from the gain peak. When the master laser was detuned from a shorter wavelength (Hopf point side) to a longer wavelength (saddle-node point side) within the stable-locking range, the side-modes varied correspondingly as shown in Fig. 3a. he magnitude of the side-modes decreased, indicating the gain was reduced. At the same time, the wave-length was red-shited due to an increase of the refractive index, since the optical injection reduces the carrier density. he net modal gain Gnet was extracted from the power ratios of adjacent peaks and valleys of the optical spectrum, as in the Hakki-Paoli method30. Figure 3b shows the extracted G
net for each side-mode in Fig. 3a as a function of the wavelength λ . It can be seen that Gnet was reduced almost linearly from 10 cm−1 down to 2 cm−1 with the red-shit of the wavelength. Linear itting (red line) provides the ratio of dλ /dGnet, which is used for the calculation of the LBF through Eq. (5). Figure 3c presents the net modal gain spectra of the Qdash laser within the span of 1545–1555 nm corresponding to the window for the LBF extraction. With the increase in the wavelength detuning, the whole gain spectrum falls down gradually, as in the simulation result of Fig. 2b. In addition, the gain reduces faster at shorter wavelengths than at longer ones. For the same injection conditions, Gnet at 1545.3 nm decreases from 9.8 cm−1 down to 1.0 cm−1, while G
net at 1554.8 nm decreases from 9.4 cm−1 down to 2.2 cm−1. he asymmetry of the gain spectra implies that the laser has a larger diferential gain (dG dN/ ) at the shorter wave-length side.
Figure 4 shows the measured LBF of the Qdash laser under diferent operation conditions. Generally, the LBF increases from about 2.5 at 1545 nm to about 3.0 at 1555 nm. Figure 4a demonstrates that the measured LBF values do not change much for diferent optical injection powers. he standard deviation of the measured LBFs at three injection powers of 6.1, 4.3, and 2.5 mW was about 12%. Figure 4b reveals that the measurement is not sen-sitive to the choice of the injected mode. he standard deviation of the LBFs at four injected modes (at 1570, 1560, 1540, and 1530 nm) was about 11%. In addition, the method is also insensitive to the bias current, as illustrated in Fig. 4c, and the standard deviation of the LBFs at four bias currents (80, 70, 60, 50 mA) was about 9%. he insen-sitivity to the above conditions can be attributed to the fact that the side-modes under measurement are always non-lasing, even though the injected mode is lasing, meaning that the side-modes are operated below-threshold. herefore, this technique can be a superior complement of the sub-threshold Hakki-Paoli method, with one important advantage. he Hakki-Paoli method relies on the change of the bias current, which always results in device heating and thus complicates the accurate extraction of the LBF. In contrast, the method proposed in this paper utilizes a ixed pump current with a constant associated heating, and hence remains insensitive to thermal efects.
he LBF measurements using the proposed method are compared with the Hakki-Paoli method in Fig. 5 for a Qdot laser described in the Methods section. he Qdot laser’s lasing threshold was 43 mA, with a gain peak around 1545 nm. In the Hakki-Paoli measurements, the pump current source was operated in the continuous-wave mode, and the sub-threshold heating was evaluated from that above threshold36. he LBF meas-ured under side-mode injection locking conditions at three bias currents (67, 55, and 50 mA) increases from about 2.7 at 1540 nm to about 3.2 at 1549 nm. As shown in Fig. 5, the LBF measured by the novel method is in a relatively good agreement with that obtained by the Hakki-Paoli method (black circles), albeit it is slightly higher. his can be attributed to the underestimation of the thermal efects in the latter method36. It is noted that the LBFs of the Qdot laser are similar to those of the Qdash laser shown in Fig. 4, although carriers in the Qdots are Figure 3. Illustration of the proposed LBF measurement technique for the Qdash laser. (a) Wavelength and power variations of two side-modes with detuning of the injected light from shorter to longer wavelength within the stable-locking range. (b) he corresponding net modal gain (Gnet) as a function of the mode peak wavelength (λ ). he red lines indicate the least square linear itting. (c) Measured Gnet versus λ over a span of 1545–1555 nm.
conined in all three dimensions. his can be attributed to the inhomogeneous broadening efects, originating from the large dot size dispersion37.
In conclusion, we have proposed a novel method for measuring the sub-threshold LBF of semiconductor lasers. It relies on the analysis of the residual side-modes of the laser subject to an optical injection. he method is insensitive to thermal efects, bias current, and injection conditions. he standard deviation of the measurements does not exceed 15%, and the measured values are in good agreement with those obtained using the standard Hakki-Paoli method. he proposed technique may be of prime importance for advanced types of laser devices, such as quantum cascade lasers38–40 and lasers on silicon41,42, for which the LBF behavior does require a better understanding and vivid discussions dealing with the thermal efects still persist.
Methods
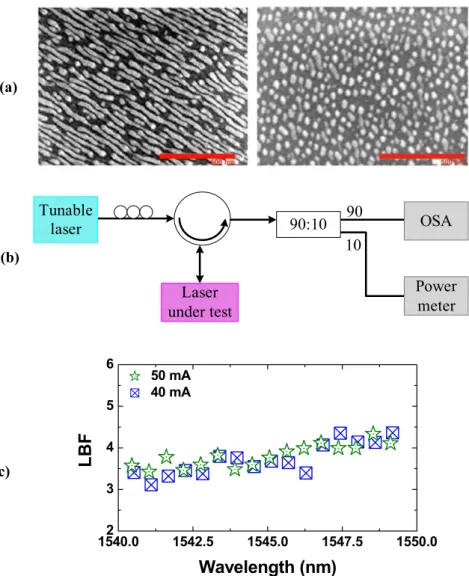
Figure 6a shows the scanning electron microscope (SEM) images of the InAs Qdashes (let) and Qdots (right), grown by chemical beam epitaxy (CBE) on InP substrates43. A thin layer of GaAs (GaP) underneath InAs was used to promote the Qdash (Qdot) morphology. he dashes were typically elongated nanostructures of a few hundreds of nanometers in length, while the dots were more symmetric in shape, with a diameter on the order of 40 nm44. he laser structures were grown on (001)-oriented n-type InP substrates. An n-type cladding was irst grown, followed by a 350-nm-thick 1.15Q waveguiding core containing 5 layers of dashes/dots. An upper p-type InP cladding layer was then grown (containing an etch stop for ridge fabrication), followed by a heavily doped Figure 4. Measured LBF of the Qdash laser under various conditions. (a) Varying optical injection power. he injected mode was around 1570 nm, and the laser was biased at 60 mA. (b) Diferent injected modes. he injection power was 6.1 mW, and the laser was biased at 60 mA. (c) Varying bias current. he injected mode was around 1570 nm, and the injection power was 6.1 mW. he standard deviations of the measurements in (a–c) are 12%, 11%, and 9%, respectively.
Figure 5. Measured LBF of the Qdot laser at diferent currents. he injected mode was around 1570 nm, and the injection power was 8.0 mW. he black circles represent the LBF measured by the Hakki-Paoli method near the lasing threshold at 43 mA.
www.nature.com/scientificreports/
p-type InGaAs contact layer. Single-mode ridge waveguide lasers were then fabricated, cleaved, and mounted for testing. Both lasers had a cavity length of 1 mm, with the Qdash FP laser having a ridge width of 2 µ m, and the Qdot FP laser having a ridge width of 3 µ m.
Figure 6b illustrates the experimental setup for measuring the LBF. A tunable external cavity laser (Anritsu FP001168) was used as the master laser, and the injected light was coupled into the laser under test (slave laser) through an optical circulator. he polarizations of both lasers were aligned by a polarization controller. he opti-cal spectrum of the output light (90%) was captured by a high resolution (10 pm) optiopti-cal spectrum analyzer (OSA), and 10% of the output power was monitored by a power meter. he temperature of the slave laser was maintained at 20 °C throughout the experiment. Figure 6c presents the measured LBF of a commercial Qwell FP laser (Alcatel-Lucent) at two bias currents (40 and 50 mA) using the experimental setup. he threshold current of the laser was 24 mA, and the peak of the optical spectrum was around 1545 nm. Within the spectral range of 1540–1550 nm, the LBFs of the Qwell laser vary between 3.1 and 4.4, which are roughly 30% larger than those of the Qdash and Qdot lasers in Figs 4 and 5.
References
1. Henry, C. H. heory of the linewidth of semiconductor lasers. IEEE J. Quantum Electron. QE-18, 259–264 (1982). 2. Coldren, L. A., Corzine, S. W. & Mašanović, M. L. Diode Lasers and Photonic Integrated Circuits (Wiley 2012). 3. Schawlow, A. L. & Townes, C. H. Infrared and optical masers. Phys. Rev. 112, 1940–1949 (1958).
4. Haug, H. & Haken, H. heory of noise in semiconductor laser emission. Zeitschrit für Physik 204, 262–275 (1967). 5. Faist, J. et al. Quantum cascade laser. Science 264, 553–556 (1994).
6. Aellen, T. et al. J. Direct measurement of the linewidth enhancement factor by optical heterodyning of an amplitude-modulated quantum cascade laser. Appl. Phys. Lett. 89, 091121 (2006).
7. Bimberg, D., Grundmann, M. & Ledentsov, N. N. Quantum Dot Heterostructures (Wiley 1998).
8. Bhowmick, S., Baten, M. Z., Frost, T., Ooi, B. S. & Bhattacharya P. High performance InAs/In0.53Ga0.23Al0.24As/InP quantum dot
1.55 µ m tunnel injection laser. IEEE J. Quantum Electron. 50, 7–14 (2014).
Figure 6. (a) SEM images of the InAs Qdash (let) and Qdot (right) nanostructures (scale bar is 500 nm). (b) Experimental setup for measuring the LBF. (c) Measured LBF of a commercial Qwell laser. he lasing threshold is 24 mA, and the lasing spectrum peaks around 1545 nm.
288. Techn. Digest, 2007 Conf. Lasers & Electro-Optics CLEO07, Baltimore, MD, USA, 6–11 May 2007, Paper ChK1.
16. Hakki, B. W. & Paoli, T. L. Cw degradation at 300°K of GaAs double-heterostructure junction lasers. II. Electronic gain. J. Appl. Phys.
44, 4113–4119 (1973).
17. Harder, C., Vahala, K. & Yariv, A. Measurement of the linewidth enhancement factor α of semiconductor lasers. Appl. Phys. Lett. 42, 328–330 (1983).
18. Provost, J.-G. & Grillot, F. Measuring the chirp and the linewidth enhancement factor of optoelectronic devices with a Mach-Zehnder interferometer. IEEE Photon. J. 3, 476–488 (2011).
19. Devaux, F., Sorel, Y. & Kerdiles, J. F. Simple measurement of iber dispersion and of chirp parameter of intensity modulated light emitter. J. Lightwave Technol. 11, 1937–1940 (1993).
20. Hui, R., Mecozzi, A., D’Ottavi, A. & Spano, P. Novel measurement technique of α factor in DFB semiconductor lasers by injection locking. Electron. Lett. 26, 997–998 (1990).
21. Yu, Y., Giuliani, G. & Donati, S. Measurement of the linewidth enhancement factor of semiconductor lasers based on the optical feedback self-mixing efect. IEEE Photon. Technol. Lett. 16, 990–992 (2004).
22. Lin, C.-H., Lin, H.-H. & Lin, F.-Y. Four-wave mixing analysis of quantum dot semiconductor lasers for linewidth enhancement factor extraction. Opt. Express. 20, 101–110 (2012).
23. Nakajima, H. & Bouley, J.-C. Observation of power dependent linewidth enhancement factor in 1.55 µ m strained quantum well lasers. Electron. Lett. 27, 1840–1841 (1991).
24. Grillot, F., Dagens, B., Provost, J. G., Su, H. & Lester, L. F. Gain compression and above-threshold linewidth enhancement factor in 1.3 µ m InAs/GaAs quantum dot lasers. IEEE J. Quantum Electron. 44, 946–951 (2008).
25. Furuya, K. Dependence of linewidth enhancement factor α on waveguide structure in semiconductor lasers. Electron. Lett. 21, 200–201 (1985).
26. Westbrook, L. D. Dispersion of the linewidth broadening factor in 1.5 µ m laser diodes. Electron. Lett. 21, 1018–1019 (1985). 27. Agrawal, G. P. Intensity dependence of the linewidth enhancement factor and its implications for semiconductor lasers. IEEE
Photon. Technol. Lett. 1, 212–214 (1989).
28. Agrawal, G. P. Efect of gain and index nonlinearities on single-mode dynamics in semiconductor lasers. IEEE J. Quantum Electron.
26, 1901–1909 (1990).
29. Zilkie, A. J. et al. Time-resolved linewidth enhancement factors in quantum dot and higher-dimensional semiconductor ampliiers operating at 1.55 µ m. J. Lightwave Technol. 26, 1498–1509 (2008).
30. Raghuraman, R., Yu, N., Engelmann, R., Lee, H. & Shieh, C. L. Spectral dependence of diferential gain, mode shit, and linewidth enhancement factor in a InGaAs-GaAs strained-layer single-quantum-well laser operated under high-injection conditions. IEEE J. Quantum Electron. 29, 69–75 (1993).
31. Gioannini, M. & Montrosset, I. Numerical analysis of the frequency chirp in quantum-dot semiconductor lasers. IEEE J. Quantum Electron. 43, 941–949 (2007).
32. Grillot, F. et al. Spectral analysis of 1.55 µ m InAs-InP(113)B quantum-dot lasers based on a multipopulation rate equations model. IEEE J. Quantum Electron. 45, 872–878 (2009).
33. Wang, C., Grillot, F. & Even, J. Impacts of carrier capture and relaxation rates on the modulation response of injection-locked quantum dot lasers. Proc. SPIE 8619, 861908 (2013).
34. Murakami, A., Kawashima, K. & Atsuki, K. Cavity resonance shit and bandwidth enhancement in semiconductor lasers with strong light injection. IEEE J. Quantum Electron. 39, 1196–1204 (2003).
35. Goulding, D., Hegarty, S. P. & Huyet, G. Phase amplitude coupling of semiconductor lasers. Proc. SPIE 6184, 618416 (2006). 36. Zhao, B. et al. Direct measurement of linewidth enhancement factors in quantum well lasers of diferent quantum well barrier
heights. Appl. Phys. Lett. 62, 1591–1593 (1993).
37. Dery, H. & Eisenstein, G. he impact of energy band diagram and inhomogeneous broadening on the optical diferential gain in nanostructure lasers. IEEE J. Quantum Electron. 41, 26–35 (2005).
38. Faist, J. Quantum Cascade Lasers (Oxford 2013).
39. Hangauer, A. & Wysocki, G. Gain compression and linewidth enhancement factor in mid-infrared quantum cascade lasers. IEEE J. Sel. Top. Quantum Electron. 21, 1200411 (2015).
40. Jumpertz, L. et al. Measurements of the linewidth enhancement factor of mid-infrared quantum cascade lasers by diferent optical feedback techniques. AIP Advances 6, 015212 (2016).
41. Liang, D. & Bowers, J. E. Recent progress in lasers on silicon. Nature Photon. 4, 511–517 (2010).
42. Liu, A. Y., Srinivasan, S., Norman, J., Gossard, A. C. & Bowers, J. E. Quantum dot lasers for silicon photonics. Photon. Res. 3, B1–B9 (2015).
43. Poole, P. J., McCafrey, J., Williams, R. L., Lefebvre, J. & Chithrani, D. Chemical beam epitaxy growth of self-assembled InAs/InP quantum dots. J. Vac. Sci. & Technol. B 19, 1467–1470 (2001).
44. Poole, P. J., Kaminska, K., Barrios, P., Lu, Z. & Liu, J. Growth of InAs/InP-based quantum dots for 1.55 µ m laser applications. J. Cryst. Growth 311, 1482–1486 (2009).
Acknowledgements
he authors would like to thank Prof. Jacky Even from Institut National des Sciences Appliquées, Rennes, France; Prof. Mariangela Gioannini from Politecnico di Torino, Italy, and Prof. Ivo Montrosset from Politecnico di Torino, Italy for helpful discussions. he authors are grateful to Mr. Heming Huang of Télécom ParisTech for assistance in Qwell laser measurements. his work was funded by the French National Research Agency (ANR) through the Nanodesign Project funded by the IDEX Paris-Saclay, ANR-11-IDEX-0003–02 and by the European Oice of Aerospace Research & Development (EOARD) under Grant FA 95550–15-1-0104.
www.nature.com/scientificreports/
Author Contributions
C.W. carried out the simulations and designed the experiments. C.W. and K.S. performed the experiments. M.O. and F.G. assisted with the experiments and simulations. P.J.P. fabricated the Qdash and Qdot lasers and performed the SEM imaging. F.G. initiated and coordinated the project. All authors contributed to the data analysis and writing of the manuscript.
Additional Information
Competing inancial interests: he authors declare no competing inancial interests.
How to cite this article: Wang, C. et al. hermally insensitive determination of the linewidth broadening factor in nanostructured semiconductor lasers using optical injection locking. Sci. Rep. 6, 27825; doi: 10.1038/ srep27825 (2016).
his work is licensed under a Creative Commons Attribution 4.0 International License. he images or other third party material in this article are included in the article’s Creative Commons license, unless indicated otherwise in the credit line; if the material is not included under the Creative Commons license, users will need to obtain permission from the license holder to reproduce the material. To view a copy of this license, visit http://creativecommons.org/licenses/by/4.0/