www.nature.com/scientificreports
In vivo monitoring of the
recruitment and activation of AP-1
by Arf1
Etienne Sauvageau
1, Peter J. McCormick
2& Stephane Lefrancois
1,3AP-1 is a clathrin adaptor recruited to the trans-Golgi Network where it can interact with specific signals found in the cytosolic tail of cargo proteins to incorporate them into clathrin-coated vesicles for trafficking. The small G protein Arf1 regulates the spatiotemporal recruitment of AP-1 and also drives a conformational change favoring an interaction with cargo proteins. A recent crystal structure and in vitro experiments highlighted potential residues mediating the AP-1/Arf1 interaction and the unlocking of the complex. We have used bioluminescence resonance energy transfer (BRET) to study the Arf1/ AP-1 interaction and AP-1 conformational changes in vivo. We identified novel residues required for this interaction in addition to those predicted in the crystal structure. We also studied the conformational changes in AP-1 driven by Arf1 in live cells and found that opening of the complex is prerequisite for oligomerization. Using Arf1 knockout cells generated by CRISPR/Cas9, we demonstrated that residue 172 in Arf1 is necessary for AP-1 activation and is required for the efficient sorting of the lysosomal protein prosaposin. We have used BRET to study the in vivo activation of AP-1. The advantages of BRET include expressing full-length proteins in their native environment that have been fully post-translationally modified.
The formation of clathrin-coated vesicles (CCVs) plays an important role in the intracellular transport of integral membrane and intraluminal proteins from one membrane compartment of the cell to another. Adaptor protein complexes perform dual roles in binding specific peptide motifs on membrane-associated cargo proteins and recruit clathrin to drive vesicle formation1.
The adaptor protein complex 1 (AP-1) is a heterotetrameric complex composed of two large subunits (β1 and γ), a medium subunit (µ1) and a small subunit (σ1) involved in traffic between the trans-Golgi network (TGN) and endosomes2, 3. Structurally, AP-1 consists of a “core” domain made of the N-terminal portions of
the β1 and γ subunits plus the entire µ1 and σ1 subunits. Outside of the core domain, the C-terminal part of β1 and γ form two “appendage” domains involved in the interaction with clathrin and other accessory proteins3.
The core domain recruits the complex to membranes and recognizes sorting sequences in the cytosolic tail of cargo proteins such as tyrosine (YXXØ, where X is any amino acids and Ø is a bulky hydrophobic amino acid) or dileucine ([D/E]XXXL[L/I])-type signals4–6. Besides interaction with cargo proteins, binding of the γ subunit to
phosphatidylinositol-4-phosphate (PI(4)P) also facilitates AP-1 recruitment to membranes7. However, the main
factor targeting AP-1 to the membrane of endosomes and the TGN are members of the ADP ribosylation factor (Arf) family of small GTPases. Arf1, for example, recruits AP-1 to TGN membranes, followed by the binding of clathrin to the adaptors and the formation of CCVs8, 9. Whereas the GDP bound form of Arf1 is cytosolic, the
exchange of GDP for GTP leads to conformational changes in Arf1 exposing a myristoyl group and an associated N-terminal amphipathic helix, critical for Arf1 membrane binding10, 11. These conformational changes extend to
the switch I-II domains of Arf1, allowing it to interact with various effectors such as AP-1.
The crystal structure of the AP-1 core domain with a GTP-bound N-terminal truncated form of Arf1, revealed two interaction interfaces between the switch I-II domains of Arf1 and the β1 and γ subunits12. In vitro binding
experiments suggest that these interfaces are necessary for high affinity binding of AP-1 to Arf112. Another
strik-ing feature of this crystal structure seems to suggest that Arf1 drives a conformational change in the AP-1 com-plex from a “locked” to an “open” conformation able to interact with tyrosine or dileucine-based signals of cargo 1Centre INRS-Institut Armand-Frappier, INRS, Laval, Canada, H7V 1B7. 2Faculty of Health and Medical Sciences, School of Veterinary Medicine, University of Surrey, Guildford, GU27XH, UK. 3Department of Anatomy and Cell Biology, McGill University, Montreal, Canada, H3A 2B2. Correspondence and requests for materials should be addressed to S.L. (email: [email protected])
Received: 21 February 2017 Accepted: 27 June 2017 Published: xx xx xxxx
www.nature.com/scientificreports/
proteins12, 13. Based on in vitro experiments, a third interaction interface between the C-terminal back-side of
Arf1 and the γ subunit of AP-1, would not be necessary for the interaction between these two proteins, but would participate in the allosteric activation of AP-112. So far, much of what is known regarding AP-1 recruitment and
activation is based on in vitro experiments using truncated forms of the proteins. However, the next step toward a more complete understanding of these mechanisms will require the study of full-length forms of AP-1 and Arf1 in their natural cellular environment.
In recent years, resonance energy transfer (RET)-based techniques like fluorescence resonance energy transfer (FRET) and bioluminescence resonance energy transfer (BRET) have increasingly been used to study protein-protein interaction14, 15, intra or inter-molecular conformational changes16–19 and ligand-binding20 in
living cells, in real time and with proteins expressed in their natural environment. RET is a phenomenon occur-ring when the emission spectrum of a donor chromophore overlaps with the excitation spectrum of an acceptor chromophore allowing for the non-radiative transfer of energy from the donor, following its excitation, to the acceptor molecule. The RET efficacy is inversely proportional to the sixth power of the distance between the donor and acceptor and will not occur if the two chromophores are separated by more than ~10 nm21. As such,
the occurrence of RET between chromophores attached to two proteins can be interpreted as a direct interaction between these proteins or their presence in a multi-protein complex. In BRET, the donor chromophore is the bioluminescent enzyme Renilla luciferase (RlucII), whereas in FRET it is a photoexcitable chromophore. Since RlucII is excited by the addition of an enzyme substrate instead of an external light beam, as is the case for FRET, the main advantage of BRET over FRET is the absence of background emission coming from non-specific cell excitation.
Therefore, we sought to study the interaction between Arf1 and AP-1 and the conformational changes in the AP-1 complex in living cells using BRET2 technology. We found that BRET2 can detect the interaction between Arf1 and AP-1 and the decreased affinity caused by mutations in Arf1 or AP-1 subunits. BRET2 was also success-fully used to detect the conformational changes associated with the activation of AP-1 and the role Arf1 plays in the unlocking of the complex. Finally, we found that Arf1 increases AP-1 oligomerization by recruiting it to membranes and changing its conformation.
Results
Detection of the Arf1/AP-1 interaction using BRET.
In order to detect the formation of a complex between Arf1 and AP-1 in living cells, Arf1 was fused at its C-terminus to the energy donor Renilla luciferase II (Arf1-RlucII) and the β1 and γ subunits of AP-1 were fused at their C-terminus to the blue-shifted green fluorescent protein 10 (β1-GFP10 or γ-GFP10) energy acceptor. Although GFP-tagged version of Arf122, 23 andβ112 have been described before, we first sought to determine if the presence of a larger tag like RlucII or GFP10
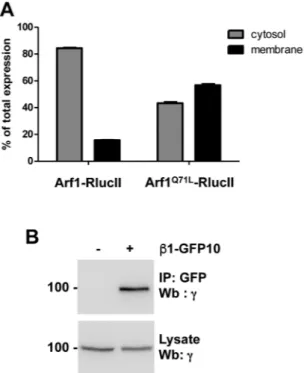
could affect the function of either Arf1 or β1. As seen in Fig. 1A, a membrane isolation assay performed in HEK293T cells transfected with Arf1-RlucII confirms that Arf1 retains its ability to bind membranes when fused to RlucII. Moreover, a GTP-locked mutant of Arf1 (Arf1Q71L-RlucII) displays increased membrane association (Fig. 1A), suggesting that the presence of RlucII at the C-terminus of Arf1 does not interfere with its activation. Nevertheless, it was previously shown that the presence of a c-terminal tag on Arf1 (GFP or HA) can affect its GTP exchange and hydrolysis24 and we cannot exclude the possibility that the presence of the RlucII tag might
influence Arf1 function. We then sought to determine if the presence of GFP10 at the C-terminus of β1 could interfere with its ability to interact with other AP-1 subunits. For this purpose, β1-GFP10 was transfected in HEK293T cells and immunoprecipitated using an antibody against GFP. Western blot analysis using an antibody against the γ subunit revealed that β1-GFP10 interacts with endogenously expressed γ (Fig. 1B), suggesting that it is integrated into AP-1 complexes.
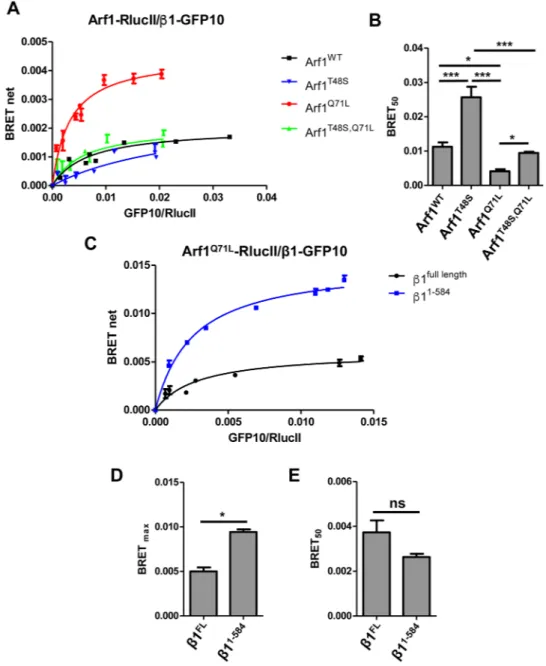
We next detected the association between Arf1 and AP-1 in living cells by generating BRET titration curves in which a fixed amount of the donor Arf1-RlucII (WT or mutant) was co-transfected in HEK293T cells with increasing quantities of the acceptor β1-GFP10. As seen in Fig. 2A (black line), the accumulation of β1-GFP10 gradually increases the BRET signal with wild-type Arf1-RlucII ultimately reaching a plateau, suggesting that the BRET signal is coming from a specific interaction and not random collision25. The highly conserved threonine
48 residue of Arf1, involved in the GDP to GTP exchange26, was mutated to serine to decrease the activation of
Arf1. This mutation did not alter the expression level of Arf1 compared to wild-type (Figure S1), but it lead to a decrease of BRET with β1-GFP10 and a linearization of the titration curve (Fig. 2A, blue line). As seen in Fig. 2A (red line), the constitutively active Arf1Q71L-RlucII displays higher BRET signal with β1-GFP10 and the BRET
50, the GFP10/RlucII ratio giving 50% of the BRETmax signal, is significantly lower than ARF1WT, suggesting a higher propensity to interact with AP-1 which is consistent with in vitro observations (Fig. 2B). Simultaneously mutating T48S and Q71L (Arf1T48S,Q71L-RlucII) brought the BRET
max (Fig. 2A) and BRET50 (Fig. 2B) to similar levels as for wild-type Arf1. The relatively low BRET signals observed between Arf1 and AP-1 are probably explained by the distance between the RlucII and GFP10 tags as Arf1 sits very close to the membrane whereas the C-terminal extension of β1 is thought to be floating in the cytosol away from the membrane. We generated BRET titration curves with full length β1 and β11–584 with Arf1Q71L-RlucII (Fig. 2C). Indeed, removing the cytosolic ear of β1 and placing the GFP10 tag just outside the trunk of AP-1 (β11–584) significantly increased the BRET
max (Fig. 2D) with Arf1Q71L whereas the BRET
50 (Fig. 2E) was unaffected, suggesting that the C-terminal extension of β1 does not influence the interaction with Arf1. Truncation of β1 did not affect its expression compared to wild-type β1 (Figure S2A). It has been suggested that the hyperbolic form of a BRET titration curve is not sufficient to con-clude that the BRET signal is coming from a specific interaction27, 28. An alternative approach is to perform the
BRET titration curves at different levels of donor expression and express the BRET ratio as a function of acceptor expression. In the case of non-specific interaction, the BRET ratio should be independent of donor levels, whereas for a specific interaction the BRET ratio should decrease with increasing levels of donor expression at similar levels of acceptor fluorescence28. As seen in Figure S3, the BRET ratios between Arf1WT-RlucII (Figure S3A) or
www.nature.com/scientificreports/
Arf1Q71L-RlucII (Figure S3B) and β1-GFP10 decrease with increasing donor concentration confirming that the BRET signal observed between Arf1 and β1 is coming from a specific interaction.
Reduced interaction between Arf1 and AP-1 mutants is detected by BRET in vivo.
The crys-tallization of a truncated form of AP-1 with a truncated form of Arf1 lacking its N-terminus conjugated to GTP revealed a potential interaction interface between the β1 subunit of AP-1 and the switch 1 and 2 regions of Arf1. Mutation of some residues in that interface led to reduced binding in vitro12. We first wanted to confirm theimpor-tance of these residues for the interaction between full-length AP-1 and Arf1 in vivo using BRET. Arf1Q71L-RlucII was transfected into HEK293T cells with increasing concentrations of wild-type β1-GFP10 or β1I85,V88D-GFP10, at similar levels of expression (Figure S2B), to perform BRET titration experiments. As shown in Fig. 3, the BRET titration curve for the mutated form of β1 (Fig. 3A, blue line) is shifted to the right leading to a higher BRET50 (Fig. 3B) confirming the importance of these residues for the interaction between Arf1 and AP-1 in vivo. In contrast, the mutation of glutamine 59 (β1Q59E-GFP10), another β1 residue suggested by the crystal structure to make contact with Arf1, had no effect on the BRET50 (Fig. 3B) indicating that mutating this residue alone is not sufficient to lead to a significant loss of binding. To ensure that the changes in the interaction of β1I85,V88D-GFP10 with Arf1 we observed in BRET were not a result of the mutant β1 not binding the other subunits of the complex and therefore not being incorporated into the complex, we performed a co-immunoprecipitation experiment (Fig. 3C). Wild-type β1 and the two mutants were able to interact with endogenous γ, suggesting that the three β1 proteins were integrated into AP-1 complexes. BRET titration experiments between β1-GFP10 and wild-type or mutated forms of Arf1-RlucII were next performed to test the role of the switch 1 domain of Arf1 in the interac-tion with AP-1 in vivo (Fig. 4A). As seen in Fig. 4B, Arf1I49D,Q71L shows reduced interaction with β1-GFP10 (larger BRET50 value) compared to Arf1Q71L, confirming results previously obtained in vitro. However, mutation of valine 53 (Arf1V53E,Q71L), which significantly decreased the interaction in vitro, had no effect on the BRET between Arf1 and β1 suggesting that this residue does not strongly contribute to the association in vivo (Fig. 4B). Two novel mutations in the switch 1 region of Arf1 (F51D and N52D) also led to a rightward shift of the BRET titration curve (Fig. 4A, red and purple lines) and a corresponding increase in their BRET50 (Fig. 4B) confirming the role of this domain in the AP-1/Arf1 association. Similar experiments were also done with mutations in the switch 2 region of Arf1 (Fig. 4C). Interestingly, Arf1Q71L,L77D,H80D, a mutant shown to lose all interaction with AP-1 in vitro, displayed similar BRET50 to Arf1Q71L in vivo, suggesting a minimal role of these residues in the AP-1/Arf1 interac-tion in vivo (Fig. 4D). However, two novel mutainterac-tions (Y74D and Y81D) showed a significant increase in BRET50 compare to wild-type (Fig. 4D), confirming that the switch 2 domain is also involved in the recruitment of AP-1 to Arf1. All Arf1 mutants used in this study maintained co-localization with the Golgi marker giantin (Figures S4 and S5) suggesting that any loss in interaction was not due to mis-localization of Arf1.
Figure 1. Functionality of the RlucII and GFP10 constructs used for BRET. (A) Arf1 recruitment to membranes was measured in HEK293T cells transfected with either Arf1-RlucII or Arf1Q71L-RlucII. Cytosol (grey bars) and membrane compartments (black bars) were separated by cell fractionation and the luminescence was measured in each fraction. Results are expressed as a % of total luminescence. (B) Co-immunoprecipitation of β1-GFP10 with endogenous γ was detected in HEK293T cells transfected with β1-GFP10. β1-GFP10 was immunoprecipitated with an antibody against GFP and endogenous γ was detected by Western blot (Wb) using an anti-γ antibody. Western blot images were cropped for space considerations.
www.nature.com/scientificreports/
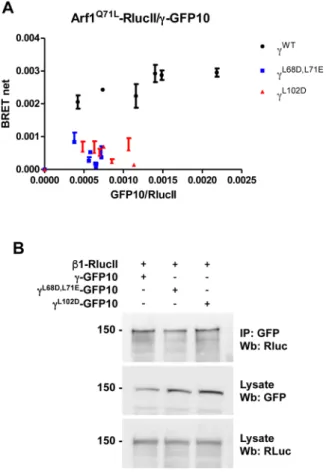
Though not visible in the crystal structure, a second binding interface between the switch 1/2 region and the N-terminus of the γ subunit has also been proposed to be involved in AP-1 recruitment to Arf112. We sought to
determine if residues in γ essential for the binding to Arf1 in vitro, are also important in vivo by performing BRET titration experiments. Wild-type γ efficiently binds to Arf1 as shown by the saturated curve (Fig. 5A, black line). The two γ mutants (γL68D,L71D and γL102D) display a significant decrease in BRET signal compare to wild-type γ, at similar levels of expression (Figure S2C), suggesting that this interface also plays a role in the AP-1/Arf1 asso-ciation in vivo (Fig. 5A). The absence of saturation for γL68D,L71D and γL102D (Fig. 5A, blue and red points) suggest these γ mutants have completely lost their ability to interact with Arf1 in cells. The change in the interaction with Arf1 was not due to the mutant γ subunits not integrating into the AP-1 complex as wild-type and mutant γ were able to co-immunoprecipitate with β1-RlucII (Fig. 5B).
Figure 2. Detection of the interaction between Arf1 and the AP-1 subunit β1 in HEK293T cells using BRET. (A) HEK293T cells were transfected with a fixed concentration of Arf1-RlucII (black curve), Arf1Q71L-RlucII (red curve), Arf1T48S-RlucII (blue curve) or Arf1T48S,Q71L-RlucII (green curve) and increasing concentrations of β1-GFP10. Fluorescence and BRET2 were measured in parallel. BRET
net levels are plotted as a function of the ratio of fluorescence over luminescence (GFP10/RlucII). Data points are mean ± SEM of triplicates. (B) BRET50 for each Arf1 construct are shown as mean ± SEM of 4 independent experiments analyzed by ANOVA followed by Tukey’s post-hoc test. *P < 0.05; ***P < 0.001; ns, not significant. (C) Arf1Q71L-RlucII was co-transfected with increasing quantities of full-length β1-GFP10 (black curve) or truncated β11–584-GFP10 (blue curve) and BRET2 signals were measured. Data points are mean ± SEM of triplicates. (D) BRET
max and (E) BRET50 are represented as the mean ± SEM of three independent experiments analyzed by paired student t-test to assess statistical significance. *P < 0.05; ns, not significant.
www.nature.com/scientificreports/
Monitoring AP-1 conformational changes by BRET.
The crystal structure of AP-1 with Arf1-GTP revealed another binding interface between the back-side of Arf1 and the γ subunit of AP-1. Based on in vitro experiments, this interface would not be necessary for AP-1 recruitment to Arf1, but would participate in the activation of AP-1 by unlocking its conformation and allowing the C-terminal domain of µ1 to interact with membrane cargo12. We first tested the role of this interface in vivo by generating BRET titration curves betweenwild-type Arf1-RlucII or various Arf1 mutants and β1-GFP10 (Fig. 6A). Mutations in this region of Arf1 (W172D or A136, 137H) resulted in no significant changes in BRET50 suggesting that this interface is not involved in AP-1 binding to Arf1 (Fig. 6B). An increase in BRETmax observed with Arf1Q71L,A136,137H-RlucII suggests that these mutations alter the conformation of Arf1 but not its ability to bind AP-1 (Fig. 6A, red line).
We next sought to monitor AP-1 conformational changes by tagging the γ subunit to RlucII (γ-RlucII) and the µ1 subunit to GFP10 (µ1-GFP10) and co-transfecting them into HEK293T cells. First, cells were treated with Brefeldin A (BFA), an Arf1 GEF inhibitor that leads to the inactivation of AP-129 or vehicle for the indicated
times and the BRET between γ-RlucII and µ1-GFP10 was measured. BFA treatment leads to an increase in BRET between the two AP-1 subunits (Fig. 7A) suggesting that the C-terminus of γ and µ1 are closer and in the “locked” conformation. It has been shown that AP-1 can oligomerize30 and to decrease the possibility that the BRET
increase observed reflects a change in the oligomerization status of AP-1 rather than a change in conformation, these experiments were performed at BRETmax where moderate changes in the oligomerization of AP-1 should have minimal effects on the BRET between γ-RlucII and µ1-GFP10. Moreover, BFA treatment should lead to a dissociation of AP-1 from the membrane and a decrease in the oligomerization of AP-1 that could not explain the increase in BRET between γ-RlucII and µ1-GFP10. Nevertheless, we also performed the BFA treatment experi-ment on cells transfected with β1-RlucII and β1-GFP10 where the BRET signal can only come from different AP-1 complexes. When performing the assay at BRETmax, we saw no changes in BRET (Fig. 7A) between β1-RlucII and Figure 3. Mutations in β1 leads to decreased interaction between Arf1 and AP-1 as detected by BRET titration experiments in living cells. (A) The effect of mutating the β1 subunit on binding was tested in HEK293T cells transfected with a low and constant amount of Arf1Q71L-RlucII and increasing concentrations of β1-GFP10 (black curve), β1I85D,V88D-GFP10 (blue curve) or β1Q59E-GFP10 (red curve). (B) BRET
50 for each β1 construct as represented as the mean ± SEM of 4 independent experiments analyzed by ANOVA followed by Tukey’s post-hoc test. ***P < 0.001; ns, not significant. (C) β1-GFP10 or the indicated mutant were immunoprecipitated using an anti-GFP antibody and the amount of endogenous γ co-immunoprecipitated was detected by western blot using an anti-γ antibody. Lysate represents 10% of the input. Western blot images were cropped for space considerations.
www.nature.com/scientificreports/
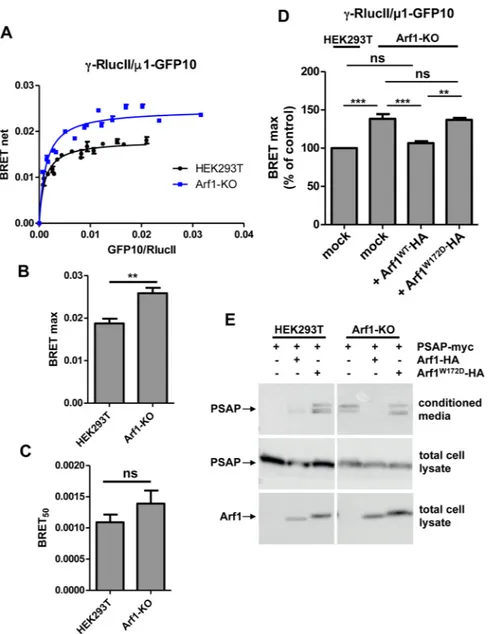
β1-GFP10, confirming that the increase in BRET between γ and µ1 comes from a conformational change of the complex and not from oligomerization. If this is true, increasing the proportion of active AP-1 in cells should lead to a decrease in BRET between γ-RlucII and µ1-GFP10. In order to test this, the two AP-1 subunits were co-transfected with a constitutively active form of Arf1 (Arf1Q71L-HA) or a mutant form (Arf1Q71L,W172D-HA) that was shown in vitro not to open the complex (Fig. 7B). As expected, expressing Arf1Q71L-HA resulted in a decrease in BRET between γ-RlucII and µ1-GFP10 (Fig. 7C). Interestingly, overexpression of Arf1Q71L,W172D-HA only slightly decreased the BRET between γ-RlucII and µ1-GFP10 (Fig. 7C) suggesting that even though this mutant binds normally to AP-1 (Fig. 6B), it is less efficient at driving AP-1 unlocking. We sought to confirm this result by performing rescue experiments in a CRISPR/Cas9 generated Arf1 knockout (Arf1-KO) cell line (Figure S6). The morphology, survival and growth rate of these cells is comparable to wild-type HEK293T cells. BRET titration curves between γ-RlucII and µ1-GFP10 were first performed in HEK293T or Arf1-KO cells (Fig. 8A). As shown in Fig. 8B, the BRETmax signal increased in Arf1-KO cells as expected as less AP-1 complex is activated whereas the BRET50 (Fig. 8C) was unaffected indicating that the association between the two subunits is normal in the absence of Arf1. Mammalian Arfs possess high levels of similarities in their primary sequences and are often localized in the same compartment suggesting they might have redundant functions. This is supported by studies showing that simultaneous depletion of multiple Arfs is required to observe certain phenotypes31–33. Our results
suggest that Arf1 plays a specific role in the recruitment and activation of AP-1, though we cannot exclude that simultaneously knocking-out another Arf could lead to a more pronounced phenotype. We next performed res-cue experiments by co-transfecting γ-RlucII and µ1-GFP10 with either Arf1WT-HA or Arf1W172D-HA in Arf1-KO cells. As shown in Fig. 8D, wild-type Arf1 brought the BRETmax signal to a level similar to HEK293T cells whereas Arf1W172D only had a partial effect. This result confirms that even though Arf1W172D interacts with AP-1 with a similar affinity as wild-type Arf1, it is less efficient in driving the conformational change of the complex. In order Figure 4. Reduced interaction between AP-1 and Arf1 mutants detected by BRET. Arf1Q71L-RlucII or various switch 1 (A) or switch 2 (C) mutated forms of Arf1 were transfected at a low and constant amount along with increasing quantities of β1-GFP10 into HEK293T cells. The BRET2 signals were measured. BRET
50 for each switch 1 (B) or switch 2 (D) mutated forms of Arf11 are shown as the mean ± SEM of 5 independent experiments analyzed by ANOVA followed by Dunnett’s post-hoc test. *P < 0.05; **P < 0.01; ***P < 0.001; ns, not significant.
www.nature.com/scientificreports/
to determine if the observed conformational change is associated with activation and normal function of AP-1, we co-expressed Arf1-HA or Arf1W172D-HA with PSAP-myc in HEK293T or Arf1-KO cells and measured their ability to rescue the quantity of PSAP secreted outside the cells, a phenotype observed when disrupting nor-mal trafficking pathways34. The overexpression of wild-type Arf1 was able to decrease the secretion of PSAP in
Arf1-KO cells, whereas Arf1W172D could not (Fig. 8E). These results show that, in addition to recruiting AP-1 to the membrane, Arf1 stimulates a conformational change necessary for the function of AP-1 in vivo.
Membrane recruitment and activation by Arf1 increases AP-1 oligomerization.
Previous exper-iments with purified adaptor proteins and synthetic liposomes showed that Arf1 can induce AP-1 oligomeri-zation30 and models of AP-1 interaction with Arf1 suggest that AP-1 would need to bind Arf1 as a monomerfirst and then oligomerize at the membrane12. We sought to determine the monomeric/oligomeric assembly of
AP-1 in the cytosol and membrane compartments. The cytosol and membrane compartments of HEK293T cells transfected with β1-RlucII and β1-GFP10 were separated by cell fractionation and BRET was measured in each fraction. As shown in Fig. 9A, the BRET signal coming from membrane compartments is significantly stronger than the BRET observed in the cytosol. The later may be explained by contamination of the cytosolic fraction with membranes or that a small proportion of AP-1 could exist as oligomer in the cytosol. We next performed BRET titration experiments in HEK293T cells expressing β1-RlucII or β1-GFP10 with Arf1Q71L-HA, Arf1Q71L,W172D-HA or mock transfected, to determine if recruitment of AP-1 to the membrane by Arf1 leads to its oligomerization (Fig. 9B and C). The BRET50 for the association between β1-RlucII and β1-GFP10 decreased by almost 4 fold in the presence of Arf1Q71L (Fig. 9D) suggesting that recruitment of AP-1 by Arf1 increases its oligomerization. Interestingly, Arf1Q71L,W172D is less efficient at driving AP-1 oligomerization (Fig. 9D), even though it is as or even more potent in increasing AP-1 membrane association than Arf1Q71L (Fig. 9E). Together, these results indicate that higher level of AP-1 oligomerization requires both the membrane association and conformational changes associated with its activation.
Figure 5. Effect of mutating the γ subunit on the interaction between AP-1 and Arf1. (A) This interaction was tested in HEK293T cells transfected with a constant amount of Arf1Q71L-RlucII and increasing concentrations of γ-GFP10 (black dots), γ L68D,L71E-GFP10 (blue dots) or γL102D-GFP10 (red dots). BRET2 signals were measured. (B) HEK293T cells were co-transfected with wild-type (WT) γ-GFP10 or the indicated mutants and β1-RLucII. γ-GFP10 was immunoprecipitated using an anti-GFP antibody and the amount of β1-RlucII co-immunoprecipitated was detected by Western blot (Wb) using an anti-RLuc antibody. Western blot images were cropped for space considerations.
www.nature.com/scientificreports/
Discussion
The interaction of the multimeric adaptor protein (APs) complexes and COPI with Arf1, and their subsequent activation have been extensively studied in vitro12, 35, 36. We took advantage of BRET to study the interaction
between Arf1 and AP-1, and how this interaction leads to the activation of the complex in live cells using full-length proteins in their native environment.
The crystal structure of Arf1 interacting with AP-1 revealed multiple interaction interfaces. The switch I/II regions of Arf1 mediates interaction interfaces with both β1 and γ subunits of AP-1. Based on structural data, at least 3 residues in β1 (Gln59, Ile85 and Asn89) should be important for binding Arf112. By overlaying β1 and
γ, a model for Arf1 bound to γ was generated and identified potentially important residues (Leu68, Leu71 and Leu102). In vitro binding experiments using mutations in both β1 and γ prevented a stable interaction with Arf1. Our in vivo data using BRET supports this conclusion. We also tested β1Q59E, which was not reported in the in vitro experiments. We found no changes in the interaction between Arf1 and AP-1 suggesting a lesser contribu-tion of this residue to the AP-1/Arf1 interaccontribu-tion in vivo.
Based on the crystal structure, several residues in the switch I/II domains of Arf1 were predicted to be impor-tant for its interaction with AP-1. In vitro studies showed that Arf1 switch I residues Ile49 and Val53 and switch II residues Lys73, Leu77 and His80 are required for its interaction with AP-1. However, other switch I residues (Phe51 and Asn52) and switch II residues (Ile74 and Tyr81) were also predicted to mediate this interaction but their roles in the interaction were not reported. Our in vivo studies confirmed the role of Ile49 in binding AP-1. Interestingly, mutations at Val53, Leu77 and His80 did not affect binding between Arf1 and AP-1 using BRET. Furthermore, when we tested Phe51, Asn52, Ile74 and Tyr81, all had significant effects on the interaction. Our in vivo experiments confirm the role of switch I/II in mediating the interaction between Arf1 and AP-1. However, the discrepancy observed between the in vitro and in vivo experiments highlights the possibility that the inter-face conformation observed in vitro is slightly different. This could be due to using truncated proteins (Arf1, β1 and/or γ), the lack of a membrane environment or the lack of post-translational modifications in the in vitro experiments.
A third interface predicted by the crystal structure between the backside of Arf1 and γ was tested using var-ious Arf1 mutations. It was predicted that Ala136, Ala137 and Trp172 of Arf1 were important in the binding to γ. In vitro, these mutations (Arf1A136,137H and Arf1W172D) did not prevent the interaction between Arf1 and AP-1, but surprisingly increased it. These residues were suggested to be involved in the activation of the complex based on an in vitro assay where Arf1W172D is less efficient in promoting cargo protein binding to AP-1. In our in vivo studies, we found no significant changes in the affinity between these Arf1 mutants and AP-1, confirming that Figure 6. The back-side region of Arf1 does not contribute to AP-1 binding in vivo. (A) BRET titration curves were generated by transfecting HEK293T cells with Arf1Q71L-RlucII (black curve), Arf1Q71L,W172D-RlucII (blue curve) or Arf1Q71L,A136,137H-RlucII and increasing quantities of β1-GFP10 and BRET signals were measured. (B) BRET50 for each Arf1 construct are shown as the mean ± SEM of 3 independent experiments analyzed by ANOVA followed by Tukey’s post-hoc test. ns, not significant.
www.nature.com/scientificreports/
they were not necessary for binding. By tagging the γ and µ1 subunits to RlucII and GFP10 respectively, we were able to directly detect the conformational changes associated with the unlocking of AP-1 in live cells and confirm the allosteric function of Trp172 in Arf1 in the activation of AP-1. Moreover, using an Arf1-KO cell line display-ing aberrant secretion of the lysosomal protein prosaposin, we were able to correlate the unlockdisplay-ing of AP-1 to its function in lysosomal trafficking, as Arf1W172D was less efficient than Arf1WT in rescuing prosaposin secretion.
Although the crystal structure of Arf1-GTP with AP-1 revealed a dimeric 2:2 Arf1: AP-1 assembly, modeling suggests that the γ/switch I/II recruitment interface is incompatible with binding of a dimer of AP-112. Therefore,
it was proposed that Arf1 first binds AP-1 in its closed state as a monomer and once on the membrane, AP-1 would dimerize. Consistent with this hypothesis, we found that AP-1 exists predominantly as a monomer in the cytosol whereas it forms dimers or oligomers when recruited to membranes. Furthermore, by overexpressing a constitutively active form of Arf1 (Arf1Q71L) we were able to increase the oligomerization of AP-1 whereas the activation deficient mutated form of Arf1 (Arf1Q71L,W172D) resulted in less oligomerization. This suggests that higher order oligomerization of AP-1 requires the conformational changes associated with the activation of the Figure 7. The back-side region of Arf1 participates in the allosteric activation of AP-1 in vivo. (A) HEK293T cells transfected with γ-RlucII/µ1-GFP10 or β1-RlucII/β1-GFP10 were treated with vehicle (grey bars) or Brefeldin A (BFA, black bars) and BRET signals were measured. Data are represented as the mean ± SEM of three independent experiments analyzed by paired student t-test to assess statistical significance. ***P < 0.001; ns, not significant.(B) γ-RlucII and µ1-GFP10 were transfected in HEK293T cells with or without Arf1Q71L-HA or Arf1Q71L,W172D-HA and BRET signals were measured. BRET signals shown are observed at similar levels of fluorescence/luminescence ratios. Data are shown as the mean ± SEM of six independent experiments analyzed by one-way ANOVA followed by Tukey’s post-hoc test to assess statistical significance. **P < 0.01; ***P < 0.001; ns, not significant. (C) The level of expression of Arf1Q71L-HA and Arf1Q71L,W172D-HA were determined by Western blot using an anti-HA antibody.
www.nature.com/scientificreports/
complex. Interestingly, a recent report on the complex between AP-1, Arf1 and the HIV Nef protein suggest that Arf1W172D is less efficient in driving higher order oligomers of AP-1 based on size exclusion chromatography35.
In summary, we have used BRET to determine the interaction sites between Arf1 and AP-1, as well as to directly study the conformational changes in AP-1 driven by Arf1 in live cells. As far as we know, this is the first time that conformational changes in AP-1 have been directly monitored in live cells. This technique could be efficiently used to study other protein complexes in vivo including the association between small GTPases and their effectors. We propose that BRET is a useful tool to study protein complexes in live cells because full-length proteins are expressed in their native environments that are post-translationally modified. BRET has the addi-tional benefit of being significantly less labor intensive than purifying proteins from bacterial lysates and can be performed in 96 or 384-well plates which makes its suitable for high-throughput screening.
Figure 8. Rescue experiments in Arf1-KO cells confirms the allosteric function of Arf1 back-side (A). A constant amount of γ-RlucII along with increasing quantities of µ1-GFP10 were transfected in HEK293T (black curve) or Arf-KO (blue curve) cells and BRET signals were measured. Data points are shown as mean ± SEM of triplicates. BRET50 (B) and BRETmax (C) are represented as mean ± SEM of 4 independent experiments analyzed by ANOVA followed by Tukey’s post-hoc test. **P < 0.01; ns, non significant.(D) HEK293T or Arf1-KO cells were transfected with γ-RlucII, µ1-GFP10 and Arf1-HA or Arf1W172D-HA and BRET signals were measured. BRET signals shown are observed at similar level of fluorescence/luminescence ratios. Data is represented as mean ± SEM of 4 independent experiments and their statistical significance were assessed by ANOVA followed with Tukey’s post-hoc test. **P < 0.01; ***P < 0.001; ns, non significant.(E) HEK293T or Arf1-KO cells were transfected with prosaposin-myc (PSAP-myc) with or without Arf1-HA or Arf1W172D-HA. The amount of PSAP-myc secreted in the media was determined by western blot using an anti-myc antibody. Western blot images were cropped for space considerations.
www.nature.com/scientificreports/
Materials and Methods
Reagents and antibodies.
All reagents, unless specified, were purchased from Fisher Scientific (Ottawa, ON). Dulbecco’s modified Eagle’s medium, fetal bovine serum and penicillin-streptomycin were purchased Figure 9. Arf1 increases AP-1 oligomerization in living cells. (A) HEK293T cells were transfected with β1-RlucII and β1-GFP10 and a membrane isolation assay was performed to separate cytosolic (C) and membrane fractions (M). BRET2 signals were measured in each fraction. BRET2 signals shown are observed at similar level of fluorescence/luminescence ratios. Data are shown as the mean ± SEM of three independent experiments analyzed by paired student t-test to assess statistical significance. ***P < 0.001. (B) The level of expression of Arf1Q71L-HA and Arf1Q71L,W172D-HA was determined by Western blot using an anti-HA antibody. (C) A low and constant amount of β1-RlucII and increasing concentrations of β1-GFP10 were co-transfected in HEK293T cells with or without Arf1Q71L-HA or Arf1Q71L,W172D-HA and BRET2 signals were measured. (D) BRET50 are displayed as mean ± SEM of 6 independent experiments and their statistical significance were assessed by ANOVA followed with Tukey’s post-hoc test. **P < 0.01; ***P < 0.001; ns, non significant. (E) A membrane isolation assay was performed on HEK293T cells transfected with β1-RlucII and Arf1Q71L-HA or Arf1Q71L,W172D-HA. The amount of β1-RlucII in cytosolic and membrane fractions was determined by measuring the luminescence coming from RlucII.www.nature.com/scientificreports/
from Wisent (St-Bruno, Qc, Canada). Linear 25 kDa polyethyleneimine (PEI) was from Polysciences Inc. (Warrington, PA). Coelenterazine 400a and coelenterazine h were purchased from Prolume Ltd. (Pinetop, AZ). Brefeldin A was purchased from Molecular Probes (Eugene, OR). The protease inhibitor cocktail was purchased from Sigma-Aldrich (Oakville, ON). The following mouse monoclonal antibodies were used: anti-hemagglu-tinin (anti-HA) antibody 101P, Cedarlane Laboratories, Burlington, ON); anti-myc antibody (MMS-105P, Cedarlane Laboratories); anti-γ antibody (A4200, Sigma-Aldrich, Oakville, ON); anti-actin (612657, BD Biosciences, Mississauga, ON); anti-Renilla luciferase (MAB4410) antibody (16932-1-AP) was purchased from EMD Millipore (Billerica, MA). The following rabbit polyclonal antibodies were used: anti-GFP antibody (ab290, Abcam, Cambridge, MA); anti-ARF1 antibody (20226-1-AP, Proteintech, Chicago, IL). Anti-mouse and anti-rab-bit horseradish peroxidase-conjugated IgG were from GE Healthcare (Chalfont St.Giles, Buckinghamshire, UK).
Eukaryotic expression vectors.
Human Arf1 was amplified by PCR minus the methionine initiation site and subcloned in-frame upstream of RlucII into the pcDNA 3.1 (+) vector to create the Arf1-RlucII construct. Human γ, β1 and µ1 were amplified by PCR minus the stop codon and subcloned in-frame 5′ of RlucII into the pcDNA 3.1 Hygro (+) vector to create γ-RlucII, β-RlucII and µ1-RlucII. Human γ, β1 and µ1 were amplified by PCR minus the stop codon and subcloned in-frame 5′ of GFP10 into the pcDNA 3.1 (+) vector to create γ-GFP10, β-GFP10 and µ1-GFP10. PSAP-myc37 and Arf1-HA38 were previously described. The various mutantswere engineered by site-directed mutagenesis from the previously described constructs. The various mutations introduced in to Arf1 (Figure S1), β1 (Figure S2A and B) or γ (Figure S2C) did not alter their expression com-pared to wild-type versions of the proteins.
Cell culture and transient transfections.
Human embryonic kidney 293 cells (HEK293T) were cultured in Dulbecco’s modified Eagle’s medium (DMEM) containing L-glutamine supplemented with 10% fetal bovine serum and 5% penicillin/streptomycin at 37 °C in a humidified chamber at 95% air and 5% CO2. The cells were seeded at a density of 2 × 10⁵/well for 12 well plates, 5 × 10⁵/well for 6 well plates or 3 × 10⁶ for 10 cm dishes, 24 hours prior to transfection. 1 µg/well for 12 well plates, 2 µg/well for 6 well plates or 8 µg for 10 cm dishes of total DNA were used for transient transfection using linear 25 kDa polyethyleneimine (3 µg PEI/µg DNA).BRET titration experiments.
The various vectors for proteins fused to RlucII were co-transfected in HEK293T cells seeded in 12-well plates at a low and constant quantity (6 ng for Ar1-RlucII constructs, 40 ng for β1-RlucII and 70 ng for γ-RlucII) with increasing quantities of the vectors for the different proteins fused to GFP10 (from 10 ng up to 600 ng). Approximately 48 hours later, the cells were washed, detached in PBS and transferred to white opaque 96-well plates (Greiner) at a density of ~100 000 cells. Total fluorescence was first measured with the infinite M1000 Pro plate reader from Tecan Group Ltd. (Mannedorf, Switzerland) with the excitation and emission set at 400 nm and 510 nm respectively. The BRET2 substrate coelenterazine 400a was then added to all wells (5 µM final concentration) and the BRET2 signal was measured 3 min later on the infinite M1000 Pro. The BRET2 signal was calculated as a ratio of the light emitted at 525 ± 15 nm over the light emitted at 410 ± 40 nm. The BRETnet signal was calculated as the difference between the BRET2 signal in cells expressing both GFP10 and RlucII constructs and the BRET2 signal from cells where only the RlucII fused construct was expressed. BRET titration curves were generated by expressing comparable levels of wild-type and mutant ver-sions of the various RlucII (Figure S1) and GFP10 constructs (Figure S2). To ensure that increasing plasmid levels resulted in an increased expression of the fluorescence signal per cell, and not the increase in the number of cells expressing a similar level of fluorescence, we transfected HEK293T cells in 6 well plates with various concentra-tions of β1-GFP10 (50, 100, 250 and 1000 ng), and determined the average fluorescence intensity per cell using immunofluorescence microscopy and image analysis (Figure S7).BRET measurements for Brefeldin A treatment.
Appropriate quantities of γ-RlucII(70 ng)/µ1-GFP10 (150–200 ng) or β1-RlucII (40ng)/β1GFP10 (300 ng) were cotransfected in HEK293T cells to obtain a BRETmax for each pair of proteins. 24 hours after transfection, the cells were detached in DMEM and transferred to sterile white opaque 96-well plates. 24 hours later, the cells were washed with DMEM without phenol red and treated with Brefeldin A (10 µM) or vehicle in DMEM without phenol red for 15 min at 37 °C. The total fluorescence and BRET2 signals were measured as described above.BRET rescue experiments.
Various quantities of plasmid coding for γ-RlucII (70 to 100 ng) and µ1-GFP10 (75 to 200 ng) were cotransfected in HEK293T WT or Arf1-KO cells with or without a low quantity (100 ηg) of a plasmid coding for Arf1-HA or Arf1W172D-HA. Approximately 48 hours after transfection, cells were washed and detached in PBS then seeded at a density of approximately 100 000 cells/well in white opaque 96-well plates. The total fluorescence and BRET2 were measured as described above. Conditions of similar luminescence and fluorescence levels were used for analysis.Membrane isolation assay.
This assay was previously described39. Briefly, approximately 48 hours aftertransfection, HEK293T cells were washed with PBS, detached with 5 mM EDTA in PBS and following centrif-ugation, the pellet was snap frozen with liquid nitrogen. The samples were then resuspended in buffer 1 (0.1 M Mes-NaOH pH 6.5, 1 mM MgAc, 0.5 mM EGTA, 200 µM sodium orthovanadate, 0.2 M sucrose) and centrifuged at 10 000 g for 5 min at 4 °C. The supernatants (cytosolic fraction) were collected and the pellets (membrane frac-tion) were resuspended in an equal volume of buffer 1. 40 µl of each fraction were transferred to a white 96 well plate (Greiner) and coelenterazine h was added to a 5 µM final concentration. Total luminescence was measured in the Infinite M1000 Pro plate reader (Tecan, Morrisville, NC).
www.nature.com/scientificreports/
Western blotting.
Approximately 48 hours after transfection with the indicated plasmids, HEK293T cells seeded in 6 or 12 well plates were washed with PBS, detached with 5 mM EDTA in PBS and lysed in TNE buffer (150 mM NaCl, 10 mM Tris-HCl pH 7.5, 5 mM EDTA, 0.5% Triton X-100, 0.5%) containing protease inhibitors for 1 hour at 4 °C under gentle agitation. Lysates were clarified by centrifugation at 13 000 rpm for 15 minutes at 4 °C and 4X SDS-PAGE loading buffer was added to the supernatants to a 1X final concentration (50 mM Tris-HCL pH 6.8, 2% SDS, 01% bromophenol blue, 10% glycerol, 1.25% β-mercapthoethanol). Proteins were then resolved on SDS-PAGE, transferred to nitrocellulose membranes and detected by immunoblotting using the indicated antibody.Secretion assay.
6 well plates seeded with WT or KO HEK293T cells were transfected with PSAP-myc and the indicated plasmids. Approximately 48 hours after transfection, cells were washed once with PBS and incu-bated with 1 ml of Opti-Mem for 5 hours at 37 °C in a humidified chamber at 95% air and 5% CO2. The Opti-Mem containing secreted proteins was collected and trichloroacetic acid was added to a final concentration of 20% to precipitate proteins. After a 1 hour incubation at 4 °C, samples were centrifuged for 5 min at 21 000 g at 4 °C. The pellets were washed with 200 µl of cold acetone, centrifuged and washed again with acetone. After evaporating the acetone at 95 °C for 1 min, the pellets were resuspended in 2X SDS-PAGE loading buffer. In parallel, total cell lysates were prepared as described before and proteins were then resolved on SDS-PAGE, transferred to nitrocel-lulose membranes and detected by immunoblotting using the indicated antibody.Co-immunoprecipitation.
HEK293T cells seeded in 10 cm dishes were transfected with the indicated plasmid and 48 hours later, the cells were washed with PBS, detached with PBS/EDTA and lysed in TNE buffer for 2 hours at 4 °C under gentle agitation. The lysates were clarified by centrifugation at 13 000 rpm for 25 min at 4 °C and then pre-cleared with protein-G sepharose for 1 hour at 4 °C. Protein-G sepharose and the indicated antibodies were added to the supernatants followed by an overnight incubation at 4 °C. The precipitates were washed five times in TNE buffer and the proteins eluted 1 h at room temperature in 50 µl of SDS-PAGE loading buffer (125 mMTris-HCl, pH 6.5, 4% SDS, 2 M urea, 5% glycerol, 0.1% bromophenol blue). Proteins were then resolved on SDS-PAGE, trans-ferred to nitrocellulose membranes and detected by immunoblotting using the indicated antibody.Immunofluorescence microscopy.
HEK293T cells seeded on 12mm coverslips were transfected with the indicated plasmid and 36 later, the cells were washed with PBS and fixed in 4% paraformaldehyde for 15 minutes. The cells were then washed with PBS, and incubated with 0.1% saponin for 10 minutes. The cells were subsequently immunostained with primary antibody for 1 hours at RT, washed in PBS and the incubated with the appropriate secondary antibody. Cells were then incubated with DAPI for 1 minute, prior to being mounted onto glass slides with Fluoromount G and sealed with nail polish. Images were acquired on a Zeiss inverted microscope. Image anal-ysis to quantify fluorescence intensity was performed using Zen Pro software (Carl Zeiss Inc, Mississauga, ON).Data and statistical analysis.
All graphs were generated and analyzed using GraphPad Prism (GraphPad Software Inc.) and the BRET50 and BRETmax were extrapolated from non-linear regression fits using the one-site saturation binding fitting. All the titration curves shown are representative of at least three independent experi-ments. Statistical analysis were done using student’s t-test or one-way analysis of variance (ANOVA) followed by Tukey’s or Dunnet’s post-hoc tests as appropriate (see figure legends).References
1. Kirchhausen, T., Bonifacino, J. S. & Riezman, H. Linking cargo to vesicle formation: receptor tail interactions with coat proteins.
Curr Opin Cell Biol 9, 488–495 (1997).
2. Robinson, M. S. Adaptable adaptors for coated vesicles. Trends in cell biology 14, 167–174, doi:10.1016/j.tcb.2004.02.002 (2004). 3. Owen, D. J., Collins, B. M. & Evans, P. R. Adaptors for clathrin coats: structure and function. Annual review of cell and developmental
biology 20, 153–191, doi:10.1146/annurev.cellbio.20.010403.104543 (2004).
4. Owen, D. J. & Evans, P. R. A structural explanation for the recognition of tyrosine-based endocytotic signals. Science 282, 1327–1332 (1998). 5. Ohno, H. et al. Interaction of tyrosine-based sorting signals with clathrin-associated proteins. Science 269, 1872–1875 (1995). 6. Doray, B., Lee, I., Knisely, J., Bu, G. & Kornfeld, S. The gamma/sigma1 and alpha/sigma2 hemicomplexes of clathrin adaptors AP-1
and AP-2 harbor the dileucine recognition site. Molecular biology of the cell 18, 1887–1896, doi:10.1091/mbc.E07-01-0012 (2007). 7. Wang, Y. J. et al. Phosphatidylinositol 4 phosphate regulates targeting of clathrin adaptor AP-1 complexes to the Golgi. Cell 114,
299–310 (2003).
8. Stamnes, M. A. & Rothman, J. E. The binding of AP-1 clathrin adaptor particles to Golgi membranes requires ADP-ribosylation factor, a small GTP-binding protein. Cell 73, 999–1005 (1993).
9. Traub, L. M., Ostrom, J. A. & Kornfeld, S. Biochemical dissection of AP-1 recruitment onto Golgi membranes. J Cell Biol 123, 561–573 (1993).
10. Donaldson, J. G. & Jackson, C. L. ARF family G proteins and their regulators: roles in membrane transport, development and disease. Nature reviews. Molecular cell biology 12, 362–375, doi:10.1038/nrm3117 (2011).
11. Antonny, B., Beraud-Dufour, S., Chardin, P. & Chabre, M. N-terminal hydrophobic residues of the G-protein ADP-ribosylation factor-1 insert into membrane phospholipids upon GDP to GTP exchange. Biochemistry 36, 4675–4684, doi:10.1021/bi962252b (1997). 12. Ren, X., Farias, G. G., Canagarajah, B. J., Bonifacino, J. S. & Hurley, J. H. Structural basis for recruitment and activation of the AP-1
clathrin adaptor complex by Arf1. Cell 152, 755–767, doi:10.1016/j.cell.2012.12.042 (2013).
13. Heldwein, E. E. et al. Crystal structure of the clathrin adaptor protein 1 core. Proceedings of the National Academy of Sciences of the
United States of America 101, 14108–14113, doi:10.1073/pnas.0406102101 (2004).
14. Angers, S. et al. Detection of beta 2-adrenergic receptor dimerization in living cells using bioluminescence resonance energy transfer (BRET). Proceedings of the National Academy of Sciences of the United States of America 97, 3684–3689, doi:10.1073/pnas.060590697 (2000). 15. Gales, C. et al. Real-time monitoring of receptor and G-protein interactions in living cells. Nature methods 2, 177–184, doi:10.1038/
nmeth743 (2005).
16. Gales, C. et al. Probing the activation-promoted structural rearrangements in preassembled receptor-G protein complexes. Nature
structural & molecular biology 13, 778–786, doi:10.1038/nsmb1134 (2006).
17. Percherancier, Y. et al. Bioluminescence resonance energy transfer reveals ligand-induced conformational changes in CXCR4 homo- and heterodimers. The Journal of biological chemistry 280, 9895–9903, doi:10.1074/jbc.M411151200 (2005).
www.nature.com/scientificreports/
18. Vilardaga, J. P., Bunemann, M., Krasel, C., Castro, M. & Lohse, M. J. Measurement of the millisecond activation switch of G protein-coupled receptors in living cells. Nature biotechnology 21, 807–812, doi:10.1038/nbt838 (2003).
19. Dacres, H. et al. Greatly enhanced detection of a volatile ligand at femtomolar levels using bioluminescence resonance energy transfer (BRET). Biosensors & bioelectronics 29, 119–124, doi:10.1016/j.bios.2011.08.004 (2011).
20. Robers, M. B. et al. Target engagement and drug residence time can be observed in living cells with BRET. Nature communications
6, 10091, doi:10.1038/ncomms10091 (2015).
21. Pfleger, K. D. & Eidne, K. A. Illuminating insights into protein-protein interactions using bioluminescence resonance energy transfer (BRET). Nature methods 3, 165–174, doi:10.1038/nmeth841 (2006).
22. Honda, A., Al-Awar, O. S., Hay, J. C. & Donaldson, J. G. Targeting of Arf-1 to the early Golgi by membrin, an ER-Golgi SNARE. The
Journal of cell biology 168, 1039–1051, doi:10.1083/jcb.200409138 (2005).
23. Rafiq, N. B. et al. Podosome assembly is controlled by the GTPase ARF1 and its nucleotide exchange factor ARNO. The Journal of
cell biology 216, 181–197, doi:10.1083/jcb.201605104 (2017).
24. Jian, X., Cavenagh, M., Gruschus, J. M., Randazzo, P. A. & Kahn, R. A. Modifications to the C-terminus of Arf1 alter cell functions and protein interactions. Traffic 11, 732–742, doi:10.1111/j.1600-0854.2010.01054.x (2010).
25. Mercier, J. F., Salahpour, A., Angers, S., Breit, A. & Bouvier, M. Quantitative assessment of beta 1- and beta 2-adrenergic receptor homo- and heterodimerization by bioluminescence resonance energy transfer. J Biol Chem 277, 44925–44931, doi:10.1074/jbc. M205767200 (2002).
26. Zhou, F. et al. The mechanism and function of mitogen-activated protein kinase activation by ARF1. Cellular signalling 27, 2035–2044, doi:10.1016/j.cellsig.2015.06.007 (2015).
27. Lan, T. H. et al. BRET evidence that beta2 adrenergic receptors do not oligomerize in cells. Scientific reports 5, 10166, doi:10.1038/ srep10166 (2015).
28. Szalai, B. et al. Improved methodical approach for quantitative BRET analysis of G Protein Coupled Receptor dimerization. PloS one
9, e109503, doi:10.1371/journal.pone.0109503 (2014).
29. Caster, A. H., Sztul, E. & Kahn, R. A. A role for cargo in Arf-dependent adaptor recruitment. The Journal of biological chemistry 288, 14788–14804, doi:10.1074/jbc.M113.453621 (2013).
30. Meyer, D. M. et al. Oligomerization and dissociation of AP-1 adaptors are regulated by cargo signals and by ArfGAP1-induced GTP hydrolysis. Molecular biology of the cell 16, 4745–4754, doi:10.1091/mbc.E05-06-0568 (2005).
31. Nakai, W. et al. ARF1 and ARF4 regulate recycling endosomal morphology and retrograde transport from endosomes to the Golgi apparatus. Molecular biology of the cell 24, 2570–2581, doi:10.1091/mbc.E13-04-0197 (2013).
32. Wang, J., Du, J. & Jin, Q. Class I ADP-ribosylation factors are involved in enterovirus 71 replication. PloS one 9, e99768, doi:10.1371/ journal.pone.0099768 (2014).
33. Kondo, Y. et al. ARF1 and ARF3 are required for the integrity of recycling endosomes and the recycling pathway. Cell structure and
function 37, 141–154 (2012).
34. Rojas, R. et al. Regulation of retromer recruitment to endosomes by sequential action of Rab5 and Rab7. J Cell Biol 183, 513–526, doi:jcb.200804048 (2008).
35. Shen, Q. T., Ren, X., Zhang, R., Lee, I. H. & Hurley, J. H. HIV-1 Nef hijacks clathrin coats by stabilizing AP-1:Arf1 polygons. Science
350, aac5137, doi:10.1126/science.aac5137 (2015).
36. Yu, X., Breitman, M. & Goldberg, J. A structure-based mechanism for Arf1-dependent recruitment of coatomer to membranes. Cell
148, 530–542, doi:10.1016/j.cell.2012.01.015 (2012).
37. Zhao, Q. & Morales, C. R. Identification of a novel sequence involved in lysosomal sorting of the sphingolipid activator protein prosaposin. J Biol Chem 275, 24829–24839 (2000).
38. Haines, E., Schlienger, S. & Claing, A. The small GTPase ADP-Ribosylation Factor 1 mediates the sensitivity of triple negative breast cancer cells to EGFR tyrosine kinase inhibitors. Cancer biology & therapy 16, 1535–1547, doi:10.1080/15384047.2015.1071737 (2015). 39. Seaman, M. N., Harbour, M. E., Tattersall, D., Read, E. & Bright, N. Membrane recruitment of the cargo-selective retromer subcomplex
is catalysed by the small GTPase Rab7 and inhibited by the Rab-GAP TBC1D5. J Cell Sci 122, 2371–2382, doi:jcs.048686 (2009).
Acknowledgements
pcDNA3.1 Hygro ( + ) RlucII-GFP10-st2 and pcDNA3.1 Hygro ( + ) GFP10-RlucII-st2 plasmids were generous gifts from Dr. Michel Bouvier (IRIC, Université de Montreal, Montreal, QC). Arf1-HA was a generous gift from Dr. Audrey Claing (Department of Pharmacology, Université de Montréal). Funding for this work was provided by the National Sciences and Engineering Research Council (NSERC) and La Fondation du Grand defi Piere Lavoie to SL. SL is supported by a salary award from Fonds de recherche du Quebec - Santé.
Author Contributions
E.S. designed experiments, performed experiments, analyzed data and wrote the manuscript. P.J.M. designed experiments, analyzed data and wrote the manuscript. S.L. obtained funding, designed experiments, analyzed data and wrote the manuscript.
Additional Information
Supplementary information accompanies this paper at doi:10.1038/s41598-017-07493-1 Competing Interests: The authors declare that they have no competing interests.
Publisher's note: Springer Nature remains neutral with regard to jurisdictional claims in published maps and institutional affiliations.
Open Access This article is licensed under a Creative Commons Attribution 4.0 International License, which permits use, sharing, adaptation, distribution and reproduction in any medium or format, as long as you give appropriate credit to the original author(s) and the source, provide a link to the Cre-ative Commons license, and indicate if changes were made. The images or other third party material in this article are included in the article’s Creative Commons license, unless indicated otherwise in a credit line to the material. If material is not included in the article’s Creative Commons license and your intended use is not per-mitted by statutory regulation or exceeds the perper-mitted use, you will need to obtain permission directly from the copyright holder. To view a copy of this license, visit http://creativecommons.org/licenses/by/4.0/.