HAL Id: tel-03166452
https://tel.archives-ouvertes.fr/tel-03166452
Submitted on 11 Mar 2021HAL is a multi-disciplinary open access archive for the deposit and dissemination of sci-entific research documents, whether they are pub-lished or not. The documents may come from teaching and research institutions in France or abroad, or from public or private research centers.
L’archive ouverte pluridisciplinaire HAL, est destinée au dépôt et à la diffusion de documents scientifiques de niveau recherche, publiés ou non, émanant des établissements d’enseignement et de recherche français ou étrangers, des laboratoires publics ou privés.
based on their associative behavior with floating objects
Yannick Diby Armel Baidai
To cite this version:
Yannick Diby Armel Baidai. Derivation of a direct abundance index for tropical tunas based on their associative behavior with floating objects. Agricultural sciences. Université Montpellier, 2020. English. �NNT : 2020MONTG031�. �tel-03166452�
i
THÈSE POUR OBTENIR LE GRADE DE DOCTEUR
DE L’UNIVERSITÉ DE MONTPELLIER
En Sciences de la Mer École doctorale GAIA
Unité de recherche : Centre pour la Biodiversité Marine, l’Exploitation et la Conservation (MARBEC)
Présentée par Yannick Diby Armel BAIDAI
Le 17 Décembre 2020
Sous la direction de Laurent DAGORN
Et Daniel GAERTNER
Devant le jury composé de
Roger PRADEL, Directeur de Recherche, CNRS, CEFE Ray HILBORN, Professeur, University of Washington Victor RESTREPO, Vice-President Science, ISSF
Allassane OUATTARA, Professeur, Université Nangui Abrogoua Carolina MINTE-VERA, Senior scientist, IATTC
Laurent DAGORN, Directeur de Recherche, IRD, UMR MARBEC Daniel GAERTNER, Chargé de Recherche, IRD, UMR MARBEC
Président Rapporteur Rapporteur Examinateur Examinateur Directeur de thèse Co-directeur de thèse Manuela CAPELLO, Chargé de Recherche, IRD, UMR MARBEC Co-encadrante de thèse Monin Justin AMANDE, Chargé de Recherche, African Marine Expertises Invité
Derivation of a direct abundance index for tropical
tunas based on their a ssociative behavior with
ii
“Amat Victoria Curam”
iii
It is with a smile that I remember today that even as a child, my answer to the question “What do you want to be when you grow up?” was almost invariably: “Scientist, Sir”! Disdaining comments and quibbles from other kids shouting that it was not a “real job”. The funny thing is that at that time, I actually had no idea of the true meaning of the word “Scientist”. I was just sublimated and obsessed by the “exploits” of my unusual heroes of the time. Rather than Tintin, I was more interested in crazy inventions of Professor Calculus. Faced with the power of Wolverine, I shuddered at Professor X's exhilarating knowledge. Do not even ask me who was my favorite ninja turtle (the nerd genius Donatello, of course). During these three years of thesis, I have been able to get a little closer to the deep meaning of this word and its real implications. Of the two hundred or so pages of this manuscript, these few lines were among the most difficult to write, as they will never be able to faithfully express the extent of my gratitude to all those people who in one way or another contribute to the achievement of this old childhood dream.
First, I would like to express my sincere gratitude to my quartet of supervisors who gave me the exciting opportunity to undertake this thesis work (in order of appearance in this adventure). I would like to address a special gratitude to Monin Justin Amandé (Doc). From “Bigeye” to today, what a long way and thrilling adventures. I still remember that endless job interview, the hours of work coding and rewriting procedures over and over again, the “Miami Law” decreed with our observers. At every stage, I have always been able to count on your support, your unfailingly and pertinent advices as a mentor and role model. The first time I met Manuela Capello was on skype. She was trying to explain to the layman that I was, a thorny story about models. At the time, the only models I knew were doing fashion shows for clothing brands. I never would have suspected that they could also be used to count such turbulent and mysterious animals as tuna. I would like to thank her for her availability and patience in answering my countless questions, and for guiding me through this thesis. I understand better now: “ABBI can also count tunas”. During this skype meeting, Laurent Dagorn was also present. I personally met him a few weeks later in this room of the IRD representation in Abidjan, where he pushed the science of tuna to the point of experiencing the famous Ivorian “Garba”. His spirit and scientific curiosity have captivated me since that day. I would like to thank him for his continuous support, ideas, and the opportunity he gave me to develop new skills, extend my expertise, and expand my collaborative network. One of my first experiences with the French
iv
scientists. It was during my very first discovery of these coffee breaks that I met Daniel Gartner, my second main supervisor, who have spared no effort for the success of this thesis. He has always been able to bring a fresh look to this thesis and each of our discussions have been rich as much in lessons as in pertinent advices. I would like to express my particular gratitude to him.
Secondly, I would like to thank Ray Hilborn, Allassane Ouattara, Victor Restrepo, Roger Pradel and Carolina Minte-Vera for contributing their knowledge as part of my PhD committee. Likewise, I would also like to express my gratitude to all those people who gave me their intellectual support throughout this process; these include Jean-Louis Denebourg, David Kaplan, Francis Marsac, Antoine Duparc, Laurent Floch, Norbert Billet, Laura Mannoci, Fabien Forget. My special thanks to Geraldine Perez with whom I found myself embarked on this tuna story, and who has never stopped helping me in these endless administrative issues, which I still, do not understand at all. Thank you also for all our fascinating discussions, which made me understand, to me who only swore by earthworms, that the trophic level above them was also full of mysteries to elucidate.
My gratitude also goes to the organizations that funded this thesis project, namely the “Institut de Recherche pour le Développement” (IRD) and the “Agence Nationale pour la Recherche” (ANR), who granted me a bursary and gave me an invaluable support during the difficult context of the COVID-19.
Last but not least, this thesis would have not been possible without the support of my family. Thank you all for being there for me.
v
This thesis is submitted as a series of manuscripts, which are to be submitted, or published in peer-reviewed journal.
Peer-reviewed articles included in this thesis
Published or accepted articles:
Baidai, Y., Dagorn, L., Amande, M.J., Gaertner, D., and Capello, M. 2020. Machine learning
for characterizing tropical tuna aggregations under Drifting Fish Aggregating Devices (DFADs) from commercial echosounder buoys data. Fisheries Research: 105613. https://doi:10.1016/j.fishres.2020.105613 (Chapter 2).
Baidai, Y., Dagorn, L., Amande, M.J., Gaertner, D., and Capello, M. 2020. Tuna aggregation
dynamics at Drifting Fish Aggregating Devices: A view through the eyes of commercial echosounder buoys. ICES Journal of Marine Science (In press):
https://doi:10.1093/icesjms/fsaa178 (Chapter 3).
Articles in preparation:
Processing data from satellite-linked buoys used in tropical tuna fisheries for scientific purposes: A standard protocol. In preparation for Deep-Sea Research Part II: Topical
Studies in Oceanography. (Chapter 1).
Direct assessment of skipjack tuna abundance in Indian Ocean based on its associative behaviour with floating objects. In preparation for Proceedings of the National Academy
of Sciences. (Chapter 4).
Peer-reviewed articles not included in this thesis
Mannocci, L., Baidai, Y., Forget, F., Tolotti, M.T., Dagorn L., and Capello M. 2020. Using machine learning to detect bycatch risk. In preparation for Biological Conservation.
vi Baidai, Y., Capello, M., Billet, N., Floch, L., Simier, M., Sabarros, P., and Dagorn, L. 2017.
Towards the derivation of fisheries-independent abundance indices for tropical tunas: Progress in the echosounders buoys data analysis. IOTC-2017-WPTT19-22.
Baidai, Y., Capello, M., Amande, J., Gaertner, D., and Dagorn, L. 2018. Supervised learning
approach for detecting presence-absence of tuna under FADs from echosounder buoys data. ICCAT-SCRS/2018/125.
Baidai, Y., Amande, M.J., Gaertner, D., Dagorn, L., and Capello, M. 2018. Recent advances
on the use of supervised learning algorithms for detecting tuna aggregations under FADs from echosounder buoys data. IOTC-2018-WPTT20-25.
Baidai, Y., Dagorn, L., Amande, M. J., Gaertner, D., and Capello, M. 2019. Aggregation
processes of tuna under Drifting Fish Aggregating Devices (DFADs) assessed through fisher’s echosounder buoy in the Indian Ocean. IOTC-2019-WPTT21-55_Rev1.
Baidai, Y., Dagorn, L., Amande, M.J., Gaertner, D., and Capello, M. 2019. Mapping tuna
occurrence under Drifting Fish Aggregating Devices from fisher’s echosounder buoys in Indian Ocean. IOTC-2019-WPTT21-56_Rev1.
A. Diallo, Baidai Y., Manocci L., Capello, M. 2019. Towards the derivation of fisheries-independent abundance indices for tropical tuna: Report on biomass estimates obtained from a multi-frequency echosounder buoy model (M3I+). IOTC-2019-WPTT21-54_Rev1. Zudaire, I., Tolotti, M., Murua, J., Capello, M., Andrés, M., Cabezas, O., Krug, I., Grande, M., Arregui, I., Uranga, J., Goñi, N., Ferarios, J.M., Ruiz, J., Baidai, Y., Ramos, M.L., Báez, J.C., Abascal, F., Moreno, G., Santiago, J., Dagorn, L., and Murua, H. 2019. Preliminary results of the BIOFAD project : testing designs and identify options to mitigate impacts of drifting Fish Aggregating Devices on the ecosystem. WCPFC-SC15-2019/EB-WP-11 (Rev.01).
Zudaire, I., Mariana Tolotti, M., Murua, J., Capello, M., Andrés, M., Cabezas, O., Krug, I., Grande, M., Arregui, I., Uranga, J., Goñi, N., Sabarros, P.S., Ferarios, M.J., Jon, R., Baidai,
vii
identify options to mitigate impacts of drifting fish aggregating devices on the ecosystem. IOTC-2019-WPTT21-52.
Baidai, Y., Dagorn, L., Amande, M. J., Gaertner, D., and Capello, M. 2020. Aggregation
processes of tuna under Drifting Fish Aggregating Devices (DFADs) assessed through fisher’s echosounder buoy in the Atlantic Ocean. Collected Volume of Scientific Papers
ICCAT 76(6): 762–776.
Baidai, Y., Dagorn, L., Amande, M.J., Gaertner, D., and Capello, M. 2020. Mapping tuna
occurrence under Drifting Fish Aggregating Devices from fisher’s echosounder buoys in Atlantic Ocean. Collected Volume of Scientific Papers ICCAT 76(6): 777–784.
Grande, M., Capello, M., Baidai, Y., Uranga, J., Boyra, G., Quincoces, I., Orue, B., Ruiz, J., Zudaire, I., and Murua, H. 2020. From fishermen to scientific tools: progress on the recovery and standardized processing of instrumented buoys data. Collected Volume of
viii
Representing the majority of the world’s tuna catches, tropical tuna species are of critical importance due to their essential role as food and economic resource. The sustainable management of this valuable resource depends on an accurate estimate of the abundance of the exploited populations and the impact of fishing pressure on them. The present thesis provides a new direct abundance index for tropical tuna populations that account for their free-swimming and associated components. Indeed, tropical tuna species are characterized by a singular behavioural trait that causes them to associate with floating objects drifting at sea. This characteristic has led to the development of a specific fishing mode widely used in tuna purse seine fishery, consisting in the capture of schools associated to floating objects. Recent decades have thus seen the massive deployment of thousands of floating objects known as fish aggregating devices (FADs), specifically designed to attract and concentrate tuna schools. The drifting FADs are equipped with satellite-linked echosounder buoys, which ensure their continuous monitoring, providing fishers with near-real time information on their location and associated tuna biomasses. This thesis presents a standard methodological framework for processing the information from echosounder buoys for scientific use, including a new approach based on supervised learning for processing the acoustic data they provide. The analysis of these data has allowed improving the general knowledge on the associative dynamics of tuna aggregations. Ocean-specific differences were evidenced, with notably longer periods of absence of tuna under FADs in the Indian Ocean than in the Atlantic Ocean. The novel index for estimating tuna abundance proposed by this thesis also exploit this associative behaviour. It relies on a modelling approach combining data on the dynamics of the occupancy of floating objects from echosounder buoys with data on the associative dynamics of tuna individuals. An initial application to the western Indian skipjack tuna population has made it possible to provide time series of absolute and relative abundances, used for stock assessments of this species. This new abundance index addresses the current critical need for complementary methods for estimating tropical tuna stocks expressed by all regional fisheries management organizations.
Keywords: Direct abundance index, Associative behaviour, Tropical tunas, Echosounder buoys,
ix
Introduction
Les thons, animaux emblématiques de nos océans, font partie des espèces de poissons les plus lucratives au monde. D’une importance socio-économique cruciale à la fois pour les pays développés et en développement, les thons fournissent une grande variété de services écosystémiques directs, notamment à travers leur rôle en tant que ressource alimentaire et économique. Ces superprédateurs occupent en outre, une place fondamentale dans les réseaux trophiques marins; et une déplétion de leurs populations pourrait se traduire par de dramatiques effets délétères sur le fonctionnement et la stabilité des écosystèmes (Sund et al., 1981; Baum and Worm, 2009; Young et al., 2010; Duffy et al., 2017). Parmi les 7 principales espèces de thon exploitées, trois espèces tropicales, à savoir le thon à nageoire jaune ou albacore (Thunnus
albacares), le thon obèse ou patudo (T. obesus) et la bonite à ventre rayé ou listao (Katsuwonus pelamis), représentent à elles seules, la majorité des captures mondiales, principalement
pêchées par les flottilles industrielles de thoniers senneurs. On estime que plus de la moitié des prises de thons de ces engins de pêches, proviennent de captures associées à des dispositifs de concentration de poissons ou DCP (Fonteneau et al., 2013). Les DCP sont des objets flottants spécifiquement conçus et déployés par les pêcheurs pour faciliter leurs prises de thons tropicaux, en exploitant leur comportement associatif avec les objets flottants en mer (Fréon and Dagorn, 2000; Castro et al., 2002). Les DCP sont généralement équipés de bouées-satellite échosondeurs qui fournissent en continu aux pêcheurs diverses informations, notamment sur leur géolocalisation et les biomasses de poissons qui leurs sont associées (Lopez et al., 2014; Moreno et al., 2019). L’essor massif de la pêche sous DCP au cours de ces dernières décennies, suscite toutefois des préoccupations majeures quant à leurs impacts, tant d’un point de vue écologique que sur la durabilité des pêcheries thonières elles-mêmes (Dagorn et al., 2013). En vertu de leurs caractéristiques hautement migratoires et de leurs vastes répartitions, la gestion des ressources thonières est sous la responsabilité d’organisations régionales de gestion de la pêche (ORGP) qui sont des organismes intergouvernementaux composés de pays possédant des intérêts en matière de pêche thonière dans une zone géographique spécifique. De manière générale, la gestion des ressources thonières repose sur un ensemble de processus regroupés sous le nom « d’évaluation de stocks », qui vise en substance à définir les niveaux d'exploitation optimale des thons, notamment à partir de l’évaluation de l’abondance de leurs
x
mécanisme de gestion est intimement lié à la disponibilité d’indicateurs d’abondances robustes capable de décrire fidèlement les changements survenant au sein de ces populations. Cependant, la plupart des méthodes d’évaluation d’abondance développées pour les populations de poissons reste relativement difficile à mettre en œuvre pour les espèces tropicales de thons en raison de leurs caractéristiques migratoires et de leur vaste distribution spatiale. En conséquence, actuellement les estimations de l'abondance de leurs populations reposent presque essentiellement sur les données de capture et d’effort associées à la pêche commerciale.
Objectifs de la thèse
Le présent travail a pour principal objet de développer une nouvelle méthodologie pour l'estimation des populations d'espèces de thon tropical, en exploitant leur comportement associatif autour d'objets flottants. Cet objectif implique une nécessaire amélioration des connaissances sur le comportement des thons et plus particulièrement une meilleure compréhension de leur dynamique associative. À cet égard, les informations sur les agrégations de poissons sous DCP, collectées par les bouées échosondeurs utilisées par les thoniers senneurs, constituent un atout majeur. La réalisation de l’objectif de cette thèse a ainsi été définie selon une stratégie de recherche articulée autour de trois axes majeurs :
(i). développer un cadre méthodologique pour l’exploitation scientifique des données enregistrées par les bouées échosondeurs équipant les DCP;
(ii). analyser les dynamiques associatives des agrégations de thons autour des DCP à partir de ces nouvelles sources de données ;
(iii). dériver un nouvel indice d'abondance des thons tropicaux sur la base de leur comportement associatif avec les objets flottants et des données des bouées échosondeurs.
xi
Chapitre 1 : Développement d’un protocole standard de traitement pour
l’exploitation scientifique des données des bouées satellites utilisées par les
thoniers senneurs tropicaux.
Ce chapitre est lié au premier des objectifs spécifiques définis. Il propose un protocole standard de collecte de données dédié aux bouées satellites utilisées dans les pêcheries thonières tropicales. Ces bouées qui équipent les dispositifs de concentration de poissons à la dérive (DCP), fournissent aux pêcheurs un flux continu d'informations tant sur certaines caractéristiques de l'océan (e.g. température de surface, vitesse des courants), que sur les communautés pélagiques de poissons associées aux DCP. Cette quantité sans précédent de données se caractérise par une large distribution à l'échelle de l'océan, une haute résolution spatiale et temporelle, mais aussi par une très forte hétérogénéité entre les natures et formats de données collectées par les différents modèles et marques de bouées. L’exploitation de ces données dans un but scientifique reste donc résolument tributaire de la disponibilité de méthodes de traitement permettant leur contrôle, leur validation et leur standardisation. Ce premier chapitre décrit les données fournies par les principaux modèles de bouées utilisés par la flotte européenne de thoniers senneurs, et propose un protocole standard de traitement visant à en améliorer leur cohérence, leur fiabilité et leur valeur. Ce protocole aborde les trois points majeurs affectant ces données : (i) les erreurs structurelles, (ii) les données collectées à terre (iii) et à bord des navires. Il fournit cinq critères de filtrage spécifiques dont trois dédiés à la résolution des erreurs structurelles, et compare différentes procédures de filtrage pour les données enregistrées sur le continent et à bord des navires.
Ces comparaisons ont révélé que l’utilisation de cartes à haute résolution de traits de côtes pour la détection des données de bouées émises sur le continent se traduisait par des performances de filtrage relativement similaires à celles à basse résolution de traits de côtes. Ce qui présente un intérêt notable en terme de coûts de calcul compte tenu des très grands volumes que représentent ces données. Deux algorithmes ont également été comparés pour la discrimination des positions enregistrées par des bouées dérivant en mer et celles émettant à bord de navires. Le premier était basé sur un moteur de règles établies à partir de l’analyse du comportement des thoniers senneurs et des patterns généraux de vitesses associés aux objets dérivant en mer. Le second reposait sur une classification automatique utilisant l’apprentissage supervisée par
xii
toutefois des spécificités liées à la résolution temporelle des données traitées.
Le protocole proposé par ce premier chapitre n’offre cependant, pas de méthodologie standard pour le traitement des données acoustiques collectées par les différentes marques de bouées échosondeurs. En effet, la grande variabilité au sein des formats des données acoustiques, et des caractéristiques matérielles et techniques des échosondeurs intégrés aux bouées constitue une limite majeure au développement d’un cadre général permettant le traitement des données acoustiques collectées en mesure d’abondance. Néanmoins, du fait de la grande quantité de données concernées, la contribution des techniques d’apprentissage automatique pourrait s’avérer être une option valable à envisager pour la mise au point d’un tel cadre méthodologique, visant à la caractérisation des agrégations de poissons sous objets flottants et la fourniture d’estimations fiables de leur abondance à partir des bouées échosondeurs
Chapitre 2 : Caractérisation des agrégations de thons tropicaux sous dispositifs
de concentration de poissons par classification automatique des données des
bouées échosondeurs.
Découlant également de l’objectif spécifique liminaire de ce travail de thèse, ce second chapitre présente une nouvelle méthodologie reposant sur l’utilisation de techniques d’apprentissage automatique pour traduire les données acoustiques collectées par les bouées échosondeurs en mesures de présence et d’abondance des thons.
L’approche couple des procédures d’agrégation spatiale et temporelle des données acoustiques collectées, à une classification supervisée utilisant l’algorithme des forêts aléatoires. Elle vise à caractériser les agrégations associées aux DCP en y déterminant la présence ou l’absence de thons, ainsi que les classes de tailles d’agrégation auxquelles elles correspondent. L’entrainement des modèles de classification s’est appuyé sur un jeu de données d’apprentissage construit par croisement des données acoustiques avec les données d’activités sur DCP issues des journaux de bord et des rapports des observateurs embarqués à bord des thoniers senneurs français dans les océans Atlantique et Indien, de 2013 à 2018. Les données acoustiques collectées la veille d’opérations de pêches sous DCP, ainsi que les captures
xiii
d’agrégation; tandis que l’absence de thons a été reliée aux données de visites sans pêche et de déploiement de DCP.
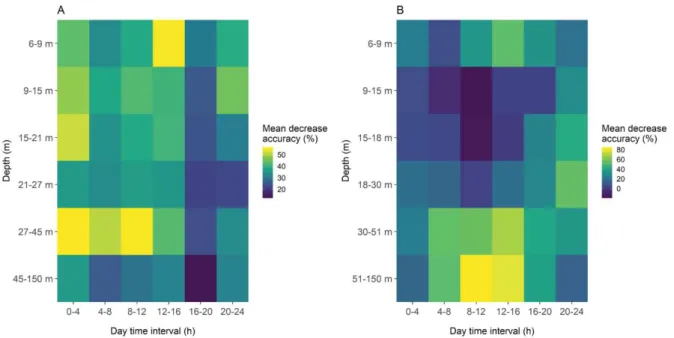
L'analyse des performances des classifications réalisées a montré des précisions satisfaisantes de l’ordre de 75 % et 85 % pour la discrimination de la présence ou de l’absence d'agrégations de thons sous DCP, respectivement dans les océans Atlantique et Indien. A l’inverse, la classification des données acoustiques en catégories de taille des agrégations de thon (à savoir, inférieure à 10 tonnes, entre 10 et 25 tonnes et supérieure à 25 tonnes) s’est traduite par une précision globale plus faible de l’ordre de 50 %, dans les deux océans. Par ailleurs, les données acoustiques enregistrées à des profondeurs (6 à 45 m dans l'Atlantique et 30 à 150 m dans l'océan Indien) et à des périodes spécifiques à l'océan (de 4 h à 16 h généralement) ont été identifiées par l'algorithme comme les variables explicatives les plus importantes dans les différentes classifications effectuées.
En fournissant, un nouvel outil permettant d’exploiter les données acoustiques des bouées échosondeurs pour la caractérisation des agrégations de thons associées aux DCP, ce travail a constitué l’une des étapes cruciales vers l'utilisation de ces nouvelles sources de données pour l’étude de l’écologie et du comportement des thons tropicaux, et le développement de nouveaux indices d’abondance pour leurs populations.
Chapitre 3 : Analyse de la dynamique associative des agrégations de thons
tropicaux autour des dispositifs de concentration des poissons à partir des bouées
échosondeurs.
L'amélioration des connaissances sur le comportement associatif des thons tropicaux avec les objets flottants est une priorité de recherche essentielle pour assurer l'exploitation durable de leurs populations. En lien avec le second objectif spécifique défini pour ce travail de thèse, le second chapitre a abordé de nouvelles questions relatives à la dynamique associative des agrégations de thons associées aux objets flottants, à partir des données collectées par les bouées échosondeurs le long de plus de 9000 trajectoires de DCP nouvellement déployés dans les océan Atlantique et Indien, entre 2016 et 2018.
xiv
procédure de classification supervisée des données acoustiques présentée au chapitre précédent, ont servi à l’évaluation de métriques clés permettant de décrire ces dynamiques associatives. Les résultats ont montré qu’en moyenne les durées de séjour à l’eau des DCP ne différaient pas significativement entre océans (de l’ordre de 60 jours). Toutefois, comparativement à l’océan Atlantique, une proportion plus élevée de DCP dans l'océan Indien n’a montré aucun signe de colonisation par les thons tout au long de leurs trajectoires (respectivement 22 et 34%).
Le temps moyen de colonisation d’un DCP nouvellement déployé par une agrégation de thons a été estimé à partir d’une nouvelle approche permettant d’éviter les biais découlant de la grande variabilité des temps de séjour à l’eau des DCP dans le jeu de données. On a ainsi déterminé qu’en moyenne la colonisation d’un DCP par une agrégation de thons survenait en moyenne au bout de 16 jours dans l'océan Atlantique, contre 40 jours dans l'océan Indien.
En moyenne, les DCP colonisés sont restés continuellement occupés par des agrégations de thon pendant 6 et 9 jours, respectivement dans les océans Indien et Atlantique. La durée moyenne entre deux agrégations consécutives autour d’un même DCP (temps d’absence d’agrégation autour du DCP) variait entre 9 jours dans l'océan Indien et 5 jours dans l'océan Atlantique. Globalement, tout au long de leur période de séjour à l’eau, les DCP colonisés sont restés occupés par les thons pendant une plus large proportion de temps dans l'océan Atlantique (63%) que dans l'océan Indien (45%).
En outre, des analyses basées sur les approches de courbes de survie ont permis de montrer que l’occupation des DCP par les agrégations de thons était déterminée par un processus indépendant du temps avec des modes de résidence à long terme de l’ordre de 2 à 3 semaines respectivement dans les océans Atlantique et Indien, et à court terme (de 4 à 5 jours), relativement proches en durée des temps continus de présence estimés au niveau des individus de thons (CRT). Cela suggère que la composition des espèces et/ou les conditions locales (par exemple les proies, les congénères ou la densité des objets flottants) pourraient jouer un rôle clé dans la dynamique d'agrégation. Des analyses évaluant ces mesures comportementales à des échelles spatio-temporelles plus restreintes pourraient aider à comprendre la dynamique des agrégations à une échelle locale, ainsi que le rôle joué par ces divers facteurs environnementaux. Ces résultats illustrent la contribution notable que les données issues des bouées échosondeurs peuvent apporter à l’amélioration des connaissances sur le comportement et l’écologie des
xv
méthodes d’estimations des populations. En effet, la taille des populations et les densités de DCP entre les deux océans sont présumées représenter les principaux facteurs causatifs à la base de la variabilité des périodes d’absence de thons sous DCP. De fait, l'intégration de ces nouvelles métriques au sein de modèles d'évaluation des populations pourrait se révéler être une voie prometteuse vers le développement de nouveaux indices d'abondance pour les thonidés tropicaux.
Chapitre 4 : Indice d’abondance basés sur le comportement associatif : une
nouvelle méthode d’estimation directe des populations de thons tropicaux.
Le quatrième chapitre de cette thèse décrit une approche de modélisation permettant de fournir des estimations directes de l'abondance des populations de thons tropicaux à partir de leur comportement associatif avec les objets flottants. Cette approche utilise cinq variables principales en entrée correspondant aux métriques reliées aux dynamiques d’occupation des objets flottants par les agrégations de thons (i.e. la proportion d’objets flottants occupés, l’abondance locale sous les objets flottants et le nombre total d’objets flottants), et à celles décrivant les dynamiques associatives individuelles des thons, à savoir les temps continus de résidence (CRT) et d'absence (CAT).
L’étude du cas du listao (Katsuwonnus pelamis) dans l’océan Indien occidental a permis de fournir des séries temporelles d’abondance absolues et relatives de la population de cette espèce pour la période 2013-2018. Cette méthode a adoptée par la Commission des Thons de l'Océan Indien (CTOI), pour les évaluations de stocks de cette espèce pour l’année 2020. L’étude s’est principalement appuyée sur les données issues des bouées échosondeurs équipant les DCP de la flottille française de thoniers senneurs. Ces données ont servi de base pour l’estimation de la densité d’objets flottants dans la zone d'étude et l’évaluation de la proportion de ceux occupés par les thons. L’abondance locale associée aux objets flottants a été déterminée à partir de la moyenne des captures de listao réalisées sous objets flottants par les thoniers senneurs. La valeur de CRT des listaos dans la zone d’étude était basée sur les travaux antérieurs de marquage électronique réalisés dans la zone par Govinden et al., (2010). L’absence de mesure
xvi
conjecture établie sur la relation de proportionnalité inverse entre cette métrique et le nombre total d’objets flottants dans la zone d’étude. La sensibilité des estimations d’abondance à différentes valeurs de coefficient de proportionnalité a ensuite été évaluée. Puis, les gammes plausibles de valeurs de ce coefficient ont été empiriquement déterminées par la comparaison des valeurs absolues d’abondance estimées avec les biomasses totales de listao pêchées dans la zone.
Les résultats montrent que les tendances d’abondance fournies demeurent peu sensibles aux variations des valeurs plausibles du coefficient de proportionnalité. Ils suggèrent en outre un net déclin de la population totale de listao dans l'océan Indien occidental au cours des années 2013 à 2015, parallèle à l'augmentation soutenue du nombre de DCP observée au cours de la même période ; suivie d’une relative stabilisation de l’abondance des populations à partir de l’année 2016. L’adoption à partir de l’année 2015 de mesures limitant le nombre de DCP par les senneurs dans l’océan Indien, couplée aux conditions environnementales et aux caractéristiques biologiques propres à cette espèce (productivité forte et variable), pourraient constituer des possibles facteurs causatifs de cette stabilisation.
Ce chapitre a ainsi montré qu’à partir d’un nombre limité d’observables décrivant les dynamiques associatives aux échelles individuelles et collectives des agrégations, il était possible de produire des estimations relativement fiables des populations de thons, capables de soutenir les évaluations de stocks. Il souligne aussi la nécessité d’une disponibilité accrue des données des bouées échosondeurs, ainsi que le développement à grande échelle de programmes de collectes de données visant à améliorer les actuelles connaissances sur les CRT et CAT des espèces thonières tropicales.
Discussion générale
Ce travail de thèse fournit un cadre méthodologique permettant d’utiliser les données issues des bouées échosondeurs dans une approche de modélisation permettant l’estimation directe de l’abondance des populations de thons tropicaux à partir de leurs dynamiques associatives avec les objets flottants. Malgré des incertitudes liées à l’absence de certaines données expérimentales (i.e. CAT) ou à leur disponibilité relativement limitée (i.e. nombre total de DCP utilisés), les estimations d’abondance réalisées au cours de cette étude se sont révélées
xvii
l’océan Indien.
L’importance des données des bouées échosondeurs pour une gestion opérationnelle des pêcheries a constitué l’un des points de discussion abordé par ce travail de thèse. En effet, les bouées offrent une source inédite d’information permettant d’évaluer en temps réel la distribution spatio-temporelle des espèces de thon tropical, et ouvrent un vaste champ d’applications possibles. Ces informations pourraient par exemple être intégrées dans une gestion opérationnelle des pêcheries et fournir des arguments scientifiques susceptibles d’appuyer en temps-réel, les prises de mesures de gestion et de conservation par les ORGP (e.g. identification des périodes et zones appropriées de fermeture spatio-temporelle de la pêche, nombre limite de DCP, etc.). Des modèles de distribution d’espèces (SDM) reliant ces nouvelles données aux conditions océaniques, pourraient offrir une compréhension accrue de l'influence de l'environnement sur la répartition des thons, aussi bien que la possibilité de prévoir les réactions des populations de thons, à divers facteurs de changement. Par ailleurs, cette nouvelle source d’informations est susceptible d'apporter un soutien intéressant à la pêche artisanale et de petite échelle. L'intégration dans les accords de pêche de mécanismes de partage des informations sur la distribution des thons et autres espèces associées, collectées par les bouées des thoniers senneurs industriels, dans les ZEE des états côtiers, pourrait très certainement contribuer à une meilleure structuration de l'accès aux ressources côtières pélagiques entre les acteurs industriels et artisanaux. En outre, le suivi quasi-constant de la circulation océanique réalisé par les bouées échosondeurs pourrait servir de base au développement ou à l’amélioration de systèmes de surveillance et d’alerte visant à réduire les impacts liés aux échouages des DCP (notamment sur les écosystèmes côtiers et récifaux), et à plus grande échelle de contrôler les mouvements des débris marins qui constituent actuellement une préoccupation environnementale majeure. Ces nouvelles données sont également susceptibles d’apporter de nouvelles connaissances sur l’écologie et le comportement des thons tropicaux. Par exemple, les estimations de populations issus de cette étude semblent être de nature à indiquer une atténuation du phénomène de fragmentation des bancs, se manifestant à travers une réduction globale du nombre de bancs dans l’océan Indien, parallèle à une augmentation de leur taille, et de celle des agrégations associées aux objets flottants.
Toutefois, les données des bouées revêtent un caractère commercial et hautement stratégique pour les compagnies de pêches qui en sont propriétaires. En conséquence, malgré l’amélioration constante de la collaboration entre le secteur industriel de la pêche thonière et les scientifiques ;
xviii
disponibilité à une communauté plus large de chercheurs. Le développement d'études soulignant leur importance et la pertinence de l’amélioration de leur accessibilité est susceptible de donner l’impulsion décisive aux ORGP et leurs parties prenantes vers un accès plus ouvert et une gestion opérationnelle et en temps réel des pêches intégrant ces nouvelles sources de données.
Conclusion
La conclusion de ce travail de thèse s’articule autour des nouvelles potentialités offertes par la nouvelle méthodologie proposée pour l’estimation des abondances des populations de thons. Elle insiste sur la pertinence de ce nouvel indice d’abondance, pour répondre aux besoins des Organismes Régionaux de Gestion de la Pêche au thon (ORGP), en matière de méthodologies complémentaires aux données de captures et d’effort pour l’estimation des stocks des thons tropicaux. Elle relève aussi que bien qu'initialement destinés aux espèces thonières tropicales, cette méthodologie pourrait potentiellement être appliquée à toute population d'espèce animale présentant un comportement associatif autour de points d'agrégation, qu'il s'agisse d’objets ou d'autres animaux vivants. La nécessité d’études complémentaires évaluant ce potentiel et permettant d’ouvrir de nouvelles perspectives pour leur application à un plus large éventail d'espèces animale, est également soulignée.
xix
Acknowledgements ... iii
Publications arising during this candidature ... v
Technical and working papers during this candidature ... vi
Abstract ... viii
Résumé substantiel (French extended abstract) ... ix
Tables of contents ... xix
List of figures ... xxii
List of tables ... xxv
Introduction ... 1
1. Introduction ... 2
2. Abundance indices in tuna fisheries management ... 5
2.1. Fisheries-independent indices ... 5
2.2. Fishery-dependent index: the Catch Per Unit of Effort ... 12
2.3. Towards the derivation of novel abundance indices for tropical tunas ... 14
3. Thesis objective ... 16
4. Thesis structure ... 16
Chapter 1: Processing data from satellite-linked buoys used in tropical tuna fisheries for scientific purposes: A standard protocol ... 18
Abstract ... 19
1.1. Introduction ... 20
1.2. Material and Methods ... 21
1.2.1. Data collection ... 21
1.2.2. Data processing protocol ... 22
1.2.2.1. Stage 1: Structural errors filtering ... 22
1.2.2.2. Stage 2: Filtering of land positions (Filter F4) ... 24
1.2.2.3. Stage 3: Filtering of water/board buoys (Filter F5) ... 24
1.3. Results ... 27
1.3.1. Dataset structure ... 27
1.3.2. Structural errors filtering outputs ... 29
1.3.3. Land filtering outputs ... 29
1.3.4. F5 outputs: water/board classifications ... 30
xx
Chapter 2: Machine learning for characterizing tropical tuna aggregations under Drifting Fish
Aggregating Devices (DFADs) from commercial echosounder buoys data ... 35
Abstract ... 36
2.1. Introduction ... 37
2.2. Material and Methods ... 38
2.2.1. Database description ... 38
2.1.2. Acoustic data pre-processing ... 41
2.1.3. Supervised learning classification ... 43
2.3. Results ... 46
2.3.1. Pre-processing of sampled depth layers ... 46
2.3.2. Presence/absence classification ... 47
2.3.3. Classification of aggregation sizes ... 48
2.3.4. Predictor importance ... 48 2.4. Discussion ... 51 2.5. Conclusion ... 54 Supplementary information S1 ... 56 Supplementary information S2 ... 63 Supplementary information S3 ... 69
Chapter 3: Tuna aggregation dynamics at Drifting Fish Aggregating Devices: A view through the eyes of commercial echosounder buoys ... 73
Abstract ... 74
3.1. Introduction ... 75
3.2. Material and methods ... 76
3.2.1. Echosounder Data ... 76
3.2.2. Data cleaning process ... 77
3.2.3. Classification of tuna presence/absence ... 77
3.2.4. Newly deployed DFADs ... 78
3.2.5. Soak time and colonization time ... 79
3.2.6. Aggregation stability ... 81
3.2.7. Survival analyses of FOB-aCRT and FOB-aCAT ... 82
3.3. Results ... 82
xxi
3.3.3. DFAD occupancy rate ... 87 3.4. Discussion ... 88 3.5. Conclusion ... 93 Supplementary information S4 ... 95 Chapter 4: Assessing tropical tuna populations from their associative behaviour with floating objects: A novel abundance index for skipjack tuna (Katsuwonus pelamis) in the Western Indian Ocean ... 103 Abstract ... 104 4.1. Introduction ... 105 4.2. Materials and methods ... 107 4.2.1. Model Definition ... 107 4.2.2. Application to skipjack tuna in the Indian Ocean ... 108 4.3. Results ... 115
4.3.1. Time series of proportion of inhabited FOBs (f) and FOB-associated biomass (m)... ... 115 4.3.2. Time series of the estimated number of FOBs (p) ... 116 4.3.3. Time series of continuous absence time (CAT) ... 117 4.3.4. Abundance indices of the skipjack tuna population ... 117 4.4. Discussion ... 121 Supplementary information S5 ... 126 Supplementary information S6 ... 129 Supplementary information S7 ... 132 Supplementary information S8 ... 134 Supplementary information S9 ... 140 General Discussion ... 144 5.1. Overview and synthesis of main results ... 145 5.2. Implications on tuna behaviour: Structure of tuna aggregations under floating
objects. ... 147 5.3. Associative Behaviour Based abundance Index (ABBI): What next? ... 149 5.4. Echosounder buoy data in an operational management of fisheries... 154 5.5. Conclusion and Perspectives ... 157 References ... 159
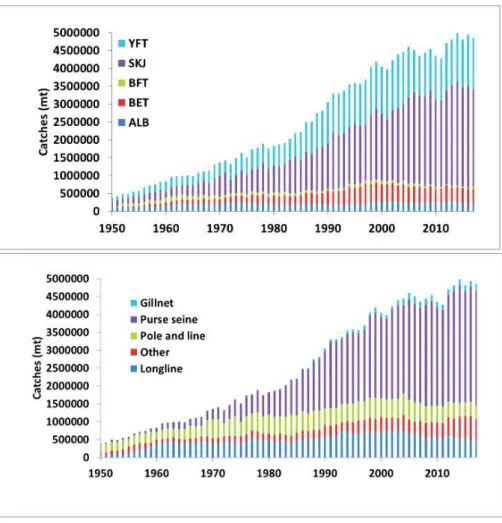
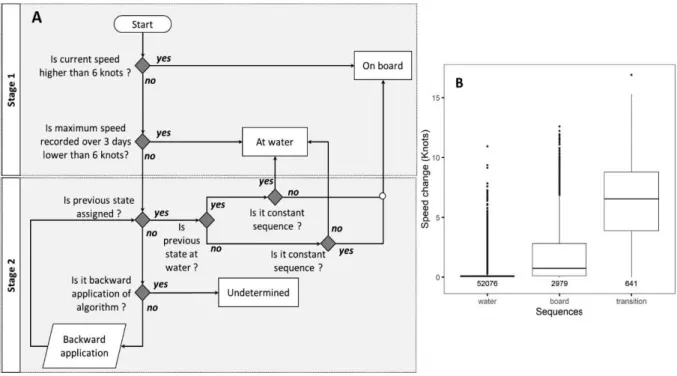
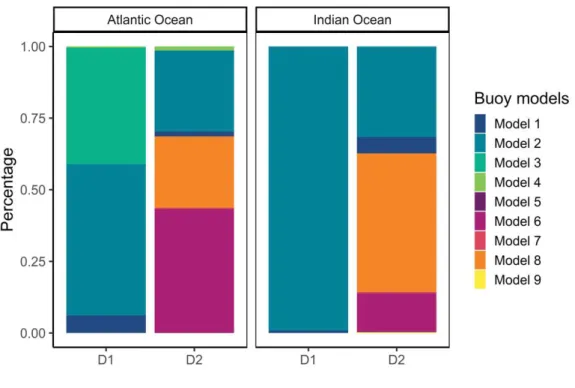
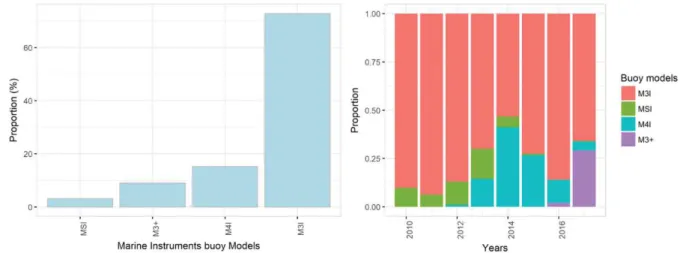
xxii Figure I.1 Global trends in catch (tonnes) of major commercial tunas, by species (top) and gear (bottom), 1950-2017. Source: ISSF, (2019). ... 4 Figure I.3: Schematic drawing illustrating Atlantic bluefin tuna (Thunnus thynnus) aerial surveys under perfect (left side) and impaired (right side) survey conditions. (1) aircraft on transect line; (2) tuna school feeding with multiple jumpers; (3) small tuna school feeding with single tuna jumping; (4) large tuna school aggregation zones extending over several miles; (5) perpendicular distance; (6) tuna schools chasing in deeper waters; (7) waves with whitecaps; (8) blind spot for lateral detection. Source: Bauer et al., (2015). ... 7 Figure I.4: Schematic of parent-offspring pairs (POPs) relationships. Juveniles are the small fish at the top, and lines to larger fish represent parent-offspring connections; dark and light shades correspond to sampled and non-sampled individuals respectively. Solid lines represent the number of matches between adults and juveniles. Source: Bravington et al., (2016b). ... 12 Figure 1.1: Workflow of the standard processing protocol for satellite-linked echosounder buoys used in tropical purse seine fisheries...26 Figure 1.2: Description of the kinetic classification algorithm (panel A), and speed changes in constant (board: board-board, water: water-water), and transition state (board-sea, sea-board) from the D1 dataset in Atlantic Ocean (panel B), Values represent the number of data in each sequences. ... 26 Figure 1.3: Percentage of buoy model constituting the datasets in the Atlantic and Indian Oceans. ... 28
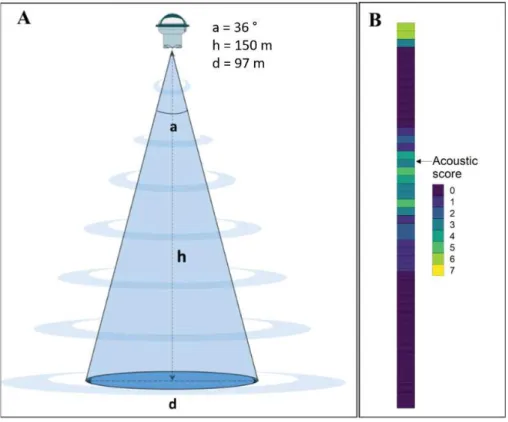
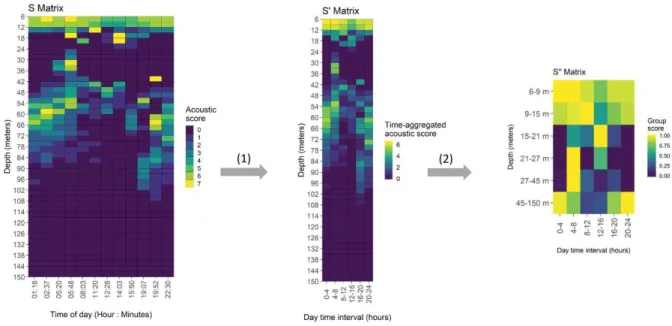
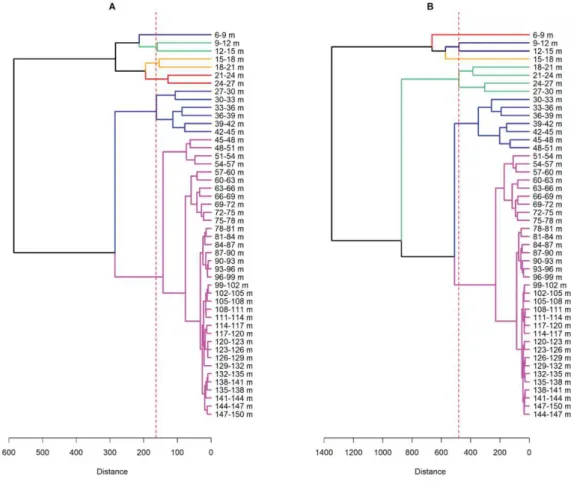
Figure 1.4: Average and standard deviation of the temporal resolution of the data provided by the different buoy models in the Atlantic and Indian Ocean datasets. ... 28 Figure 2.1: Technical specifications of the Marine Instruments M3I echosounder buoy. (A): beam width or cover angle (a), depth range (h), and diameter (D) at 150 m, (B): example of an acoustic sample.………..39 Figure 2.2: Schematic view of the acoustic data pre-processing. (1) Temporal resolution reduction, averaging acoustic samples over a 4-hour period. (2) Layer aggregation combining the 48 vertical layers into 6 layers based on cluster analysis. The final output is a 6×6 matrix summarizing the acoustic signal recorded over 24 hours between 6 and 150 m. Acoustic scores are integer values (ranging from 0 to 7), representing the intensity of the acoustic backscattered signal per 3 m depth layer. Time-aggregated acoustic scores represent the average value of the acoustic scores over the 4-hour interval. Group scores represent the sum of layer scores (scaled between 0 and 1) per homogeneous group of layers identified from the clustering analysis. ... 42 Figure 2.3: Dendrogram from the cluster analysis of raw acoustic data for the Atlantic (A) and Indian (B) Oceans. The red horizontal line indicates the height at which the dendrogram was sliced to create the 6 groups of layers. Colors identify the different groups of depth layers used to pre-process the acoustic data ... 46
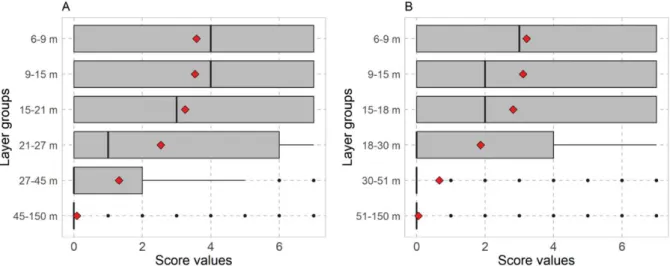
xxiii each layer group. ... 47 Figure 2.5: Importance of depth layers and day period in presence/absence classification for the Atlantic (A) and Indian (B) Oceans. Each cell represents a combination of depth and time period. Colours indicates the importance of the predictor in the classification. ... 50 Figure 2.6: Importance of depth layers and day period in multiclass classification for the Atlantic (A) and Indian (B) Oceans. Each cell represents a combination of depth and time period. Colours indicates the importance of the predictor in the classification... 50 Figure 3.1: Presence/absence of tuna aggregations along the course of the trajectories of newly deployed DFADS monitored in Western Indian Ocean and Eastern Atlantic Ocean from 2016 to 2018. Orange dots indicate days when tuna aggregations were present, white dots represent days with no tuna aggregations... 79 Figure 3.2: Schematic representation of the timeline of tuna aggregation dynamics at a DFAD. The term “end of trajectory” denotes here the first operation carried out on FADs likely to affect the aggregation (e.g. either a fishing set or the retrieval of the buoy)... 79 Figure 3.3: Daily colonization rates (bars) and percentage of equipped DFADs available (solid lines) over time in the Atlantic Ocean (Panel A) and the Indian Ocean (Panel B). Red dashed lines indicate the number of days after deployment at which 30 DFADs were still available. ... 81 Figure 3.4 : Distribution of FOB-aCATs (left) and FOB-aCRTs (right) in the Atlantic Ocean (top) and Indian Ocean (bottom). FOB-aCRT and FOB-aCAT denote the aggregation’s continuous residence time at a floating object and the continuous absence time of aggregation at a floating object, respectively. 84 Figure 3.5: Survival curves of FOB-aCRTs (Panel A) and FOB-aCATs (Panel B) recorded on trajectories of newly deployed DFADs in Atlantic Ocean (black dots) and Indian Ocean (white dots). The y-axis is on a logarithmic scale. FOB-aCRT and FOB-aCAT denote the aggregation’s continuous residence time at a floating object and the continuous absence time of aggregation at a floating object, respectively. ... 85 Figure 3.6: Survival curves of FOB-aCAT (left) and FOB-aCRT (right) observed in Atlantic Ocean (top) and Indian Ocean (bottom) fitted with single exponential, double exponential and power law models. The red line indicates the best fit. FOB-aCRT and FOB-aCAT denote the aggregation’s continuous residence time at a floating object and the continuous absence time of aggregation at a floating object, respectively. ... 87 Figure 3.7: Distribution of the DFAD occupancy rates in the Atlantic Ocean (Panel A) and the Indian Ocean (Panel B)... 87 Figure 4.1: Spatial boundaries (red dashed line) of study area zone and kernel density of skipjack tuna catches operated by the French purse seiners on FOBs over the period 2013-2018. ... 109 Figure 4.2: Time series of the average daily proportion of FOBs inhabited by tuna aggregations in the study area over 2013-2018. The red dashed line represents the average proportion of inhabited FOBs over 2013-2018... 115
xxiv Figure 4.4: Proportions of drifting fish aggregating devices (DFADs) and other types of natural and artificial objects (Other) reported by observers on board French tuna seiners. ... 116 Figure 4.5: Temporal evolution of the number of active French buoys (French FOBs equipped with buoys), the estimated numbers of drifting fish aggregating devices (DFADs) and others objects (Other), and the estimated total number of floating objects (FOBs) in the study area. ... 116 Figure 4.6: Average CATs estimated for different values of ϕ. ... 117
Figure 4.7: Time series of the absolute abundances of associated (panel A), unassociated (panel B) and total skipjack population (panel C) under different values of ϕ during 2013-2018... 119 Figure 4.8: Evolution of relative abundance of associated (panel A), unassociated (panel B) and total skipjack population (panel C), compared to the first quarter of 2013, under different values of ϕ...120 Figure 5.1: Evolution of the ratio between the numbers of skipjack tuna catches on free-swimming schools and under floating objects by the French fleet of tuna seiners from 1990 to 2019.. ... 149 Figure 5.2: Trends in the relative abundance of skipjack tuna in the Indian Ocean derived from the Associative Behaviour Based Index (ABBI) under the most plausible ϕ values, and from standardised catch and effort data from Maldives pole and line fishing (PL-CPUE), corrected or not by expert opinions. ... 152
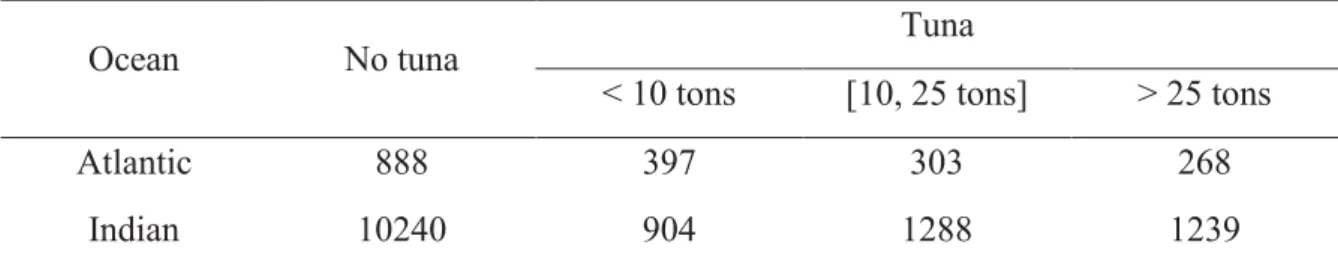
xxv Table 1.1: Description of the raw acoustic data received depending on buoy manufacturers and the different data-exchange agreements (DEA1 and DEA2). ... 23 Table 1.2: Number and percentage (in brackets) of structural errors for the different datasets in the Atlantic Ocean (AO) and the Indian Ocean (IO). ... 29 Table 1.3: Number and percentage (in brackets) of data recorded on land for the different datasets in the Atlantic Ocean (AO) and Indian Ocean (IO). ... 29 Table 1.4: Simple matching coefficients (percentage of agreement) between the random forest and the kinetic algorithm classifications for the different datasets in Atlantic and Indian Oceans... 30 Table 1.5: Number and percentage (in brackets) of water, board and unclassified positions from kinetic classification (KiC) and random forest (RF) algorithm in the different datasets for Atlantic (AO) and Indian (IO) Oceans. ... 30 Table 2.1: Number of fishing sets (with catch ≥ 1 ton), visit and deployment data collected from 2013-2018 and used in the presence-absence classification for the Atlantic and Indian Oceans. ... 41 Table 2.2: Structure of the training dataset used in the presence-absence and multiclass classification for the Atlantic and Indian Oceans (over the period 2013-2018). ... 43 Table 2.3: Summary statistics of major tuna catches (in tons) from DFAD fishing operations collected from observer and logbook databases from 2013 to 2018, in the Atlantic and Indian Oceans. ... 43 Table 2.4: Summary of tuna presence/absence classification performances for the Atlantic and Indian Oceans: mean and standard deviation values (in brackets) of evaluation metrics... 47 Table 2.5: Summary of multiclass classification performances for the Atlantic and Indian Ocean. Mean and standard deviation (in brackets) of evaluation metrics ... 49 Table 3.1: Summary of tuna aggregation metrics measured in the Atlantic Ocean ... 83
Table 3.2: Summary of tuna aggregations metrics measured in the Indian Ocean ... 83
Table 3.3: Summary of the model fits of the survival curves of aggregation continuous residence and absence times (FOB-aCRTs and FOB-aCATs) obtained in Atlantic and Indian Oceans...86 Table 3.4: Summary of main findings from previous studies on continuous residence time of individual tunas at drifting FADs. (FL: fork length, YFT: Thunnus albacares, SKJ: Katsuwonus pelamis, BET:
Thunnus obesus). ... 91
Table 4.1 : Number of fishing sets on FOB per trimester used to estimate the average biomass of skipjack tuna at FOBs. ... 110 Table 4.2: Average number of daily M3I buoys in the study region per quarter. ... 112
Table 4.3: Summary of main findings from previous studies on skipjack tuna individual CRT assessed under anchored and drifting FADs (FL: Fork length). ... 113
Introduction
“Vous arrivez devant la nature avec des théories, la nature flanque tout par terre. You come to the nature with theories, the nature blows them away”. Pierre-Auguste Renoir
2
1.
Introduction
It is said that the word “calculus” (from the Latin word for “stone”) comes from an ancient pastoral practice of counting sheep leaving the pens, using stones placed in a basket whose count was later checked when the animals returned from the meadows. For these ancient shepherds, as for any wildlife manager nowadays, knowing the precise size of populations is a crucial issue for the optimal control, conservation or exploitation of resources. Unfortunately, estimating the size of a natural population is much more complex than the ancient shepherd method of counting stones. Exhaustive census is rarely possible for natural populations, since very often, there is no practical way to access all individuals or the entire distribution area of the population. As a result, mathematical models supported by a set of assumptions are rather used to link the population size with indicative metrics of its status, called indices of abundance. The core underlying assumption is based on the expected relationship between the overall population and measurements made on samples of that population. The whole art of population assessment therefore lies in identifying the nature of the relationships between abundance indices (A) measured on given spatial and temporal units, and the overall population (N). Fundamentally, these two quantities can be related by a proportionality parameter (p), according to the following equation:
!" = "#$ (I. 1) In practice, numerous models going from a simple constant parameter to much more complex formulas can be used to describe this proportionality relationship. Similarly, abundance indices can be expressed in different forms, depending on the characteristics of the species (Skalski et
al., 2005). For species that are easily accessible (e.g. noisy, visible or not very mobile), the
abundance estimates can be made by direct observation and census of the number of individuals (e.g. large mammal herbivores: (Varman and Sukumar, 1995; Jachmann, 2002); birds: (Gregory
et al., 1992); insects: (Yoo et al., 2003); etc.). A review of direct wildlife census methods can
be found in Lewis (1970). Abundance may also be assessed indirectly by means of signs or evidences left by the animals, which provide relative indices whose variations over a defined period, reflect changes in the same direction in the overall population (Schwarz and Seber, 1999; Wilson and Delahay, 2001). When the species are difficult to observe directly because they are fast-moving, highly migratory, or distributed over large areas, an accurate measurement of their population size is difficult to implement. Providing reliable indices of
3
abundance can quickly become more difficult, and very often the latter alternative (relative indices) may turn out to be the privileged or sometimes the only one available.
With their extensive oceanic distribution and their highly migratory behaviour, tuna species are particularly illustrative of this situation. However, the health and sustainability of these iconic species strongly depend on the availability of reliable methods to estimate the status of their populations and their vulnerability to overfishing. Tuna are among the world’s most lucrative fish species, with an estimated global market value of more than $42 billion per year (Galland
et al., 2016); and belong to species of crucial socio-economic importance to both developed
and developing countries. They provide a wide variety of direct ecosystem services by supporting food security for many countries, generating employment in tuna fisheries and creating vital coastal livelihoods and economies (Bell et al., 2009, 2015; Gilman et al., 2014). As apex predators, tunas also have an ecological role recognized as key in the health and functioning of the ecosystem; and their depletion could lead to dramatic cascading ecological effects (Sund et al., 1981; Baum and Worm, 2009; Young et al., 2010; Duffy et al., 2017). Of the 15 species of tuna, seven species commonly referred to as “principal market tunas”, occupy a major economic importance in the global market (Majkowski, 2007). These principal market tunas include albacore (Thunnus alalunga), Atlantic bluefin tuna (T. thynnus), bigeye tuna (T.
obesus), Pacific bluefin tuna (T. orientalis), southern bluefin tuna (T. maccoyii), yellowfin tuna
(T. albacares), and skipjack tuna (Katsuwonus pelamis). They represented an estimated catch volume of 4.9 million tonnes in 2017, heavily dominated by catches of the three tropical tuna species (i.e. skipjack, yellowfin and bigeye tuna, representing 56%, 30%, and 8% of the total tuna catches respectively) (ISSF, 2019). Industrial tuna fishing began in the 1940s and 1950s due to a growing demand for canned tuna, with longline and pole and line as the main fishing gears (Figure I.1). Currently, purse seine represents the major gear capturing tropical tunas worldwide (65 % of the global tuna catches), followed by longline (11%), pole-and-line (8%), gillnets (4%) and miscellaneous gears (12%). This shift occurred during the 1980s as a result of the rapid development and global expansion of the tropical tuna purse seine fishery.
Management of tuna species and other large species such as swordfish and marlin is under the responsibility of intergovernmental arrangements known as Regional Fishery Management Organizations (RFMOs). The five main tuna RFMOs in the world, from the oldest to the most recent, are: (1) the Inter-American Tropical Tuna Commission (IATTC) for the Pacific Ocean, (2) the International Commission for the Conservation of Atlantic Tunas (ICCAT) for the Atlantic Ocean, (3) the Indian Ocean Tuna Commission (IOTC) for the Indian Ocean, (4) the
4 Commission for the Conservation of Southern Bluefin Tuna (CCSBT) and the Western and Central Pacific Fisheries Commission (WCPFC).
Figure I.1 Global trends in catch (tonnes) of major commercial tunas, by species (top) and gear (bottom), 1950-2017. Source: ISSF, (2019).
These organizations face the ongoing challenge of sustainable management of tuna resources through specific processes called “stock assessment”. A fish stock is defined as a unit of a fish population considered in fisheries management. It may be all or a part of the population defined on the basis of spatial distribution or other biological or ecological coherences. Stock assessment is the part of fisheries science that aims to provide support for decision making by (1) evaluating the abundance of the stock and the impact of fishing on it, (2) identifying the potential effects of alternative harvest scenarios, and (3) defining the level of exploitation that would ensure an optimal exploitation of the fish stock (Sparre and Venema, 1998; Hilborn, 2003). Fishery stock assessment primarily relies on data relating to total removal, age and length structure, and abundance indices of the population (Hilborn, 2012). However, a critical issue in
5
tuna fisheries management lies in the availability of abundance indices capable of reliably depict changes in tuna populations. Indeed, in spite of the significant progress made throughout history of marine fisheries science, a wide range of methods developed for assessing abundance of fish populations remain unfortunately difficult to implement for tuna species, or limited to a few species, or certain stages of development (early life stages or spawning stages with a more limited spatial distribution). The following paragraphs review the main population assessment techniques and abundance indices used in tuna management, and discuss their relevance, strengths and limitations particularly in relation to the three major tropical tuna species (namely skipjack tuna (Katsuwonnus pelamis), bigeye tuna (Thunnus obsesus) and yellowfin tuna (Thunnus albacares) as they account for most of the world’s commercial tuna catches (ISSF, 2019).
2.
Abundance indices in tuna fisheries management
Abundance indices used for the assessment of fish populations, including tunas, are mainly based on two types of data sources: fisheries-dependent and fisheries-independent data. Fisheries-dependent data are related to the fishing process itself, and mainly consist of usually mandatory information on catches and fishing activities (e.g. fishing effort) provided by the fishers themselves.On the other hand, fishery-independent data are mostly based on scientific surveys and involve a wide variety of techniques whose relevance for collecting data on the abundance and composition of fish stocks is largely dependent on species characteristics (e.g. acoustic or aerial surveys, etc.).
2.1.
Fisheries-independent indices
Fishery-independent indices are constructed from data collected during periodic or episodic surveys conducted by scientists or fisheries management agencies. Although high quality data can be obtained through scientifically designed and standardized sampling and data collection carried out in independent surveys (National Research Council, 2000); fisheries-independent data may be affected by deficiencies related to their expensive cost and limited spatial and temporal coverage (Hilborn and Walters, 1992).
6
Fishery-independent assessments of tuna population are typically based on direct observations through visual or acoustic surveys, or indirectly through larval censuses. Mark and recapture methods are also commonly used in tuna population assessments. However, they deserve a special status as “semi-independent” surveys, since in the case of tuna population studies they are partly dependent on fishing activities, especially for information retrieval. These different survey techniques and the derived abundance indices are presented in the following sections.
2.1.1.
Aerial surveys
The very first series of scientific aerial surveys to assess tuna populations were conducted from the 1990s onwards in the North-Western Atlantic (Lutcavage, 1995; Lutcavage et al., 1997), and along the Southern Australian coasts (Cowling and O’Reilly, 1999; Eveson et al., 2016). Before, spotting tuna schools from aircrafts was primarily used by the commercial tuna fishery as a fishing-assistance operation with the aim to improve their efficiency although some surveys were conducted for scientific purposes (Stéquert and Marsac, 1989; Petit, 1991; Basson and Farley, 2014). Aerial surveys consist of transects carried out in an aircraft at a constant speed and altitude, during which schools or aggregations of tuna (several schools) are visually detected, geolocated and roughly estimated in size by human observers (Figure I.2). Detection is made possible by the surface activity of tunas (jumping, fast swimming) related to their feeding or foraging activity (Bauer et al., 2020). The estimation of an abundance index from aerial surveys data is typically based on the distance sampling theory (Buckland et al., 2015). The transect is defined in a given area within which the estimate of the density of tuna schools (D) is usually calculated using the following formula:
% = &2'*+ ,1 (I. 2) where n denotes the number of detected tuna schools, L the transect length and w the width of the detection from the line of the transect. Aerial survey data also offer substantial information on the spatial distribution of the species concerned, and their ecology, especially when related to environmental data (Royer et al., 2004).
Despite the relative simplicity of its methodological framework, the use of aerial surveys for tuna population assessment has limitations in terms of the spatial coverage that can be achieved by the method. Indeed, aerial surveys on the scale of large oceanic regions remain hardly
7
conceivable, both technically and economically. The method is therefore suitable for tuna species with a geographically limited distribution at one or another life stage. Nearly all its applications have been carried out on juvenile bluefin tuna, a temperate species known to assemble during this life stage at specific locations and periods (Eveson et al., 2016, 2018a; Bauer et al., 2020; Rouyer et al., 2020).
Figure I.2:Schematic drawing illustrating Atlantic bluefin tuna (Thunnus thynnus) aerial surveys under perfect (left side) and impaired (right side) survey conditions. (1) aircraft on transect line; (2) tuna school feeding with multiple jumpers; (3) small tuna school feeding with single tuna jumping; (4) large tuna school aggregation zones extending over several miles; (5) perpendicular distance; (6) tuna schools chasing in deeper waters; (7) waves with whitecaps; (8) blind spot for lateral detection. Source: Bauer
et al., (2015).
The reliability of abundance indices constructed from aerial surveys is related to a good knowledge of the surface and vertical behaviour of the species of interest. Variability over time in the vertical behaviour of the species in response to the prevailing environmental conditions, is likely to induce significant biases in the interpretation of the aerial survey time-series (Bauer
et al., 2015, 2020). The detectability of animals can also be strongly impeded by both
environmental conditions and the sighting prowess of human observers (Eveson et al., 2018b). In practice, aerial surveys are generally limited to favourable weather conditions. For instance, aerial surveys of juvenile bluefin tuna in the Western Mediterranean Sea are conducted only during the summer season (Fromentin et al., 2003; Rouyer et al., 2020). On the other hand, observer rotation and assistance with video camera or unmanned aerial vehicles (UAVs) could
8
potentially help to reduce the perception bias in tuna spotting (Colefax et al., 2018; Žydelis et
al., 2019; Jech et al., 2020).
Finally, despite attempts to infer the number of fish from the size of the detected school (Bauer
et al., 2015), aerial surveys still only provide a qualitative or semi-quantitative index of
abundance, since they only give information on the density of schools and not on the biomass or density of individuals. The contribution of remote sensing techniques with LIDAR (Light Detection and Ranging) systems for the detection of tuna (Oliver et al., 1994; Churnside et al., 1998; Larese, 2005), as well as acoustic surveys coupled with underwater observations are seen as promising prospects for improving this approach (Weber et al., 2013; Rouyer et al., 2018).
2.1.2.
Acoustic surveys
The Allied fleet's need for a detection system against German submarines during the First World War constituted the first significant impetus to the progress in underwater acoustics, resulting in the development and first effective use of passive acoustic detection systems. Since then, there have been substantial advances in underwater acoustics techniques that have greatly benefited fisheries research. The use of acoustic techniques for observing fish and estimating fish abundance, described in detail by many authors (e.g. Maclennan, 1990; Simmonds and MacLennan, 2005), has become increasingly important over time.
Estimating abundance of marine species through acoustic techniques relies on the use of active acoustic detection systems, specifically scientific echosounders that emit a sound pulse and measure the backscattered echoes from targets. Acoustic abundance estimation is then carried out following two approaches depending on whether the targets are dense schools or scattered individuals (Fernandes et al., 2002). When targets are sufficiently dispersed to allow their individual detection, absolute estimates of their abundance can then be made simply by counting their individual echoes (e.g. marine mammals: (Barlow and Taylor, 2005; Lewis et
al., 2007)). For fish schools or shoals, the so-called “echo-integration” approach is used (Foote,
1983). It consists of a quantitative estimation of the biomass based on the linearity relationship between the specific acoustic energy backscattered by a single fish and the total acoustic backscatter of the group of fish. Echo-integration thus implies an appropriate knowledge on the acoustic characteristic of fish species studied, namely their target strength value (acoustic reflection coefficient of the fish).