RESEARCH OUTPUTS / RÉSULTATS DE RECHERCHE
Author(s) - Auteur(s) :
Publication date - Date de publication :
Permanent link - Permalien :
Rights / License - Licence de droit d’auteur :
Bibliothèque Universitaire Moretus Plantin
Institutional Repository - Research Portal
Dépôt Institutionnel - Portail de la Recherche
researchportal.unamur.be
University of Namur
Covering SPL Behaviour with Sampled Configurations
Devroey, Xavier; Perrouin, Gilles; Legay, Axel; Schobbens, Pierre-Yves; Heymans, Patrick
Published in:
Proceedings of the Ninth International Workshop on Variability Modelling of Software-intensive Systems
DOI:
10.1145/2701319.2701325
Publication date:
2015
Document Version
Peer reviewed version
Link to publication
Citation for pulished version (HARVARD):
Devroey, X, Perrouin, G, Legay, A, Schobbens, P-Y & Heymans, P 2015, Covering SPL Behaviour with
Sampled Configurations: An Initial Assessment. in Proceedings of the Ninth International Workshop on
Variability Modelling of Software-intensive Systems. vol. 21-23-January-2015, VaMoS '15, ACM Press,
Hildesheim, Germany, pp. 59:59-59:66, 9th International Workshop on Variability Modelling of
Software-intensive Systems (VaMoS '15), Hildesheim, Germany, 21/01/15. https://doi.org/10.1145/2701319.2701325
General rights
Copyright and moral rights for the publications made accessible in the public portal are retained by the authors and/or other copyright owners and it is a condition of accessing publications that users recognise and abide by the legal requirements associated with these rights. • Users may download and print one copy of any publication from the public portal for the purpose of private study or research. • You may not further distribute the material or use it for any profit-making activity or commercial gain
• You may freely distribute the URL identifying the publication in the public portal ? Take down policy
If you believe that this document breaches copyright please contact us providing details, and we will remove access to the work immediately and investigate your claim.
Covering SPL Behaviour with Sampled Configurations:
An Initial Assessment
Xavier Devroey
PReCISE, University of Namur, Belgium [email protected]Gilles Perrouin
∗ PReCISE, University of Namur, Belgium [email protected]Axel Legay
INRIA Rennes Bretagne Atlantique, FrancePierre-Yves Schobbens
PReCISE, University of Namur, Belgium [email protected]Patrick Heymans
PReCISE, University of Namur, Belgium [email protected]ABSTRACT
Structural approaches to Software Product Lines (SPL) test-ing (such as pairwise testtest-ing) have gained momentum as they are able to scale to larger SPLs described as feature diagrams (FD). However, these methods are agnostic with respect to behaviour: the sampled configurations have thus no reason to satisfy any given behavioural criterion. In this paper, we investigate the behavioural coverage of two structural test-ing criteria: pairwise and similarity. To do so, we modelled four SPLs in terms of feature diagrams and associated fea-tured transitions systems (FTSs). We then computed state, action and transition coverage for a set of generated configu-rations. Preliminary results indicate that for relatively small variability models with few cross-tree constraints, structural coverage-driven tools tend to cover large parts of behaviour with less than 8 configurations. Though structural coverage cannot be used directly as a replacement for behavioural driven SPL test generation, opportunities to mix structural and behavioural coverage for efficient and effective SPL test-ing do exist.
Categories and Subject Descriptors
D.2.5 [Software Engineering]: Testing and Debugging; D.2.13 [Software Engineering]: Reusable Software
General Terms
Reliability, Verification, Algorithms, Measurement
Keywords
SPL Testing, Structural Coverage, Featured Transition Sys-tem
∗FNRS Postdoctoral Researcher
Permission to make digital or hard copies of all or part of this work for personal or classroom use is granted without fee provided that copies are not made or distributed for profit or commercial advantage and that copies bear this notice and the full citation on the first page. Copyrights for components of this work owned by others than ACM must be honored. Abstracting with credit is permitted. To copy otherwise, or republish, to post on servers or to redistribute to lists, requires prior specific permission and/or a fee. Request permissions from [email protected].
VaMoS’15, January 21 - 23 2015, Hildesheim, Germany Copyright 2015 ACM 978-1-4503-3273-6/15/01 ...$15.00.
http://dx.doi.org/10.1145/2701319.2701325.
1.
INTRODUCTION
Software Product Line (SPL) testing is an intrinsically difficult activity [30]. One of the main challenges is the combinatorial explosion of the number of products to be tested. To bypass this explosion, sampling techniques have been defined to select configurations of interest from a Fea-ture Diagram (FD). These techniques involve the definition of structural coverage criteria on the FD, such as t-wise cov-erage [6, 11, 20, 33] where the set of sampled products must contain all combinations of t features, or more recently sim-ilarity testing [15], where the goal is to select products that are as different as possible. These methods became attrac-tive because they usually produce small numbers of config-urations to test, scale up to thousands of features [15, 20], have demonstrated their bug-finding abilities on real cases such as Eclipse [21] or automotive systems [36] and are being integrated in popular feature modelling environments, such as FeatureIDE or Pure::Variants. Additionally, they can be combined with other criteria (such as the cost of testing or the maximum number of products to consider) acknowledg-ing the multi-objective nature of a testacknowledg-ing budget [17, 22]. Such approaches do not take SPL behaviour into account. In contrast, variability-aware testing [23] embraces the whole SPL code to perform test case generation. At the model level, there is a growing body of work on behavioural SPL coverage [2, 7–10]. Yet these criteria may be expensive to compute on large SPLs. Thus, we formulate a simple re-search question:
Practically, which behavioural coverage sim-ilarity and pairwise sampling do achieve? To address this question, we modelled four SPLs mixing “academic” examples and real cases: each is composed of a behavioural model (given in terms of FTS) and its related FD. We then applied t-wise [20] and similarity [15] tech-niques to extract a set of configurations. By projecting the FTS for each selected configuration, we get a transition sys-tem from which it is possible to compute the coverage of the FTS representing the whole SPL. Preliminary results indi-cate that full coverage of states, transitions and actions can indeed be achieved with few configurations (no more than 3) and that 3-wise sampling worked best in these cases. Sim-ilarity worked better than t-wise for t = {1, 2}, although a detailed comparison is beyond the scope of this paper.
VendingMachine v CancelPurchase c Beverages b FreeDrinks f Currency cur Soda s Tea t Euro eur Dollar usd Or Xor
(a) Feature Diagram (FD)
S1 S2 S3 S4 S5 S6 S7 S8 S9 pay/¬f change/¬f free / f take / f close/¬f open/¬f take/¬f cancel / c return / c soda / s serveSoda / s tea / t serveTea / t
(b) Featured Transition System (FTS)
Figure 1: The soda vending machine example [4]
All these samplings obtain full coverage with more products than needed. In [10], we proposed a dedicated behavioural heuristic requiring less configurations to compute all-states coverage on our larger model. We therefore see potential for mixing structural/behavioural coverage rather than system-atically considering them in isolation.
The rest of this research in progress contribution is struc-tured as follows: Section 2 introduces structural and be-havioural coverage-driven test case generation for SPLs. Sec-tion 3 presents our experimental set-up and results obtained so far and Section 4 provides initial insights into these re-sults. Section 5 covers related works while Section 6 con-cludes the paper.
2.
BACKGROUND
We focus on model-based testing of SPLs [29, 32]. In this context, roughly two categories of approaches can be consid-ered: structural approaches, which samples configurations of interest from the FD only, and behavioural approaches that uses behavioural models (e.g. state machines, transition sys-tems, automata, sequence diagrams) to generate test cases.
2.1
Structural SPL Testing
To tackle the combinatorial explosion of the number of configurations to consider for a given FD, sampling tech-niques have been proposed. They rely on the satisfaction or maximisation of a criteria. Here, we consider t-wise feature coverage and (dis)similarity.
2.1.1
T-Wise Coverage
Combinatorial Interaction Testing (CIT) [5,24,39] is a rel-evant approach to reduce the number of products for test-ing. CIT techniques sample large domains of test data. It is
based on the observation that most of the faults are triggered by the interactions between a small number of features [24]. An interaction between t features denotes the possible im-pact of one functionality on the others. Kuhn et al. [24] have shown that covering all interactions between two fea-tures are able to disclose 80% of the bugs. In some cases, higher interaction strengths may be needed [25]. Consider-ing all possible interactions between t features is called t-wise coverage. Such approaches have been adapted to SPL testing [19, 31, 33], generating configurations from the FD covering all the valid 2-wise combinations of features. Some of them, like [19], also consider higher values of t. Gener-ally, no more than few dozens configurations are necessary for pairwise coverage.
However, computing all the t-wise interactions in the pres-ence of constraints, as it is the case for FDs, is NP-complete in the general case [19, 34]. As a result, although t-wise gen-eration techniques from FDs have greatly improved, now relying on efficient satisfiability (SAT) solvers [20], higher interaction strengths (t > 2) may remain inaccessible for large FDs. This is particularly problematic since 3-wise in-teractions were shown to commonly appear in SPL testing practice [36].
2.1.2
Similarity-Based SPL Testing
In model-based testing, it has been found that test suites containing dissimilar test cases have a higher fault detection power than similar ones [12, 13]. At the FD level, it means that a set of configurations that have few selected/unselected features in common is more likely to find faults (through as-sociated test cases) than a configuration set that has more commonalities in feature choices. This hypothesis has been empirically validated [16]. To select such dissimilar config-urations, we rely on a distance function. The advantage over explicit t-wise coverage, is that the function is easy to compute, allowing to scale easily to large FDs while still achieving a decent t-wise coverage even for high interaction strengths (t=6). Henard et al. proposed a search-based technique for selecting and prioritising configurations ac-cording to a similarity heuristic [15] for large FDs. Sub-sequently, Al-Hajjaji et al. followed this direction [1], sug-gesting that similarity testing has appeal even for smaller FDs.
2.2
Behavioural Coverage Driven Testing
In our previous work [7–10], we defined and partially im-plemented an approach to generate test cases from a be-havioural model of the SPL. In particular, we defined the notion of test case for a SPL as a sequence of actions to perform on a valid product of the SPL [9, 10]. Let us call such test case a behavioural test case to differentiate them from configurations (products) to test in t-wise coverage and similarity-based driven approaches. Behavioural test cases are selected from Featured Transition Systems (FTSs), a mathematical and compact representation of the behaviour of a SPL [4]. FTSs are Transition Systems where transi-tions have been labelled with feature expressions defining which products may fire the transition. For instance Fig. 1 presents the FTS of a soda vending machine with its FD. If we consider the transition s3
cancel/c
−→ s4, only products that
do have the CancelP urchase feature (abbreviated as c) may abort a transaction and return money. A behavioural test case in the soda vending machine corresponds to a sequence
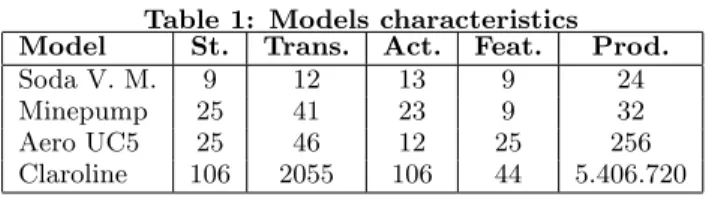
Table 1: Models characteristics Model St. Trans. Act. Feat. Prod.
Soda V. M. 9 12 13 9 24
Minepump 25 41 23 9 32
Aero UC5 25 46 12 25 256
Claroline 106 2055 106 44 5.406.720
of actions in the FTS of Fig. 1: e.g., (f ree, tea, serveT ea, take). We make the distinction between executable and non-executable behavioural test cases, i.e., behavioural test cases that may be executed by at least one valid product of the product line or not.
Using those notions, we re-defined classical TS coverage criteria for FTSs as a function giving for a set of executable test cases and a FTS, a value between 0.0 and 1.0 giving the coverage percentage of the set over the FTS [10]. All-states, all-transitions, all-transition-pairs, and all-path cri-teria states that (resp.) all states, all transitions, all incom-ing/outgoing transitions for each state, and all paths in the FTS have to be covered (to read a coverage of 1.0) when executing the set of executable test-cases. The executable test cases selection problem may be seen as an optimiza-tion problem where the coverage has to be maximized and either the number of executable test cases or the number of products needed to execute all the test cases has to be minimized according to the wish of the test engineer. In a first implementation, we designed an algorithm to select a set of executable behavioural test cases that cover all states (i.e., when executing all the test cases of the set, all states are visited at least once) and executed it on different FTSs.
3.
SET-UP AND RESULTS
To assess behavioural coverage of structural criteria, we consider 4 models1 presented in Tab. 1: the Soda Vending Machine is presented in Fig. 1; the Minepump model has been presented by Classen et al. [3], it models the behaviour of a SPL of pumps for a mine that has to be kept safe from flooding and avoid explosions; we adapted the Aero UC5 model from Samih et al. [35], a SferionTM’s industrial sit-uational awareness suite for helicopters flying in degraded visual environments, to the FTS formalism; we adapted the Claroline model, representing the navigational usages of a lo-cal instance of this online course management platform, pre-sented in our previous work [8], to the FTS formalism. Re-garding t-wise generation, we elicited the SPLCAT tool [20] for its performance [15] and PLEDGE [18] for similarity test-ing.
Behaviour of the different models is represented using FTSs. To measure the behavioural coverage and respond to the research question of section 1, we used state, transi-tion and actransi-tion coverage for each product selected using the different structural criteria.
3.1
Set-up
To perform our assessment, we carried out the following steps for each model and each tool (SPLCAT and PLEDGE): 1. Generate a set of configurations from the FD using
each tool.
1All models may be downloaded from https://projects.
info.unamur.be/vibes/.
Table 2: SPLCAT and PLEDGE parameters Model SPLCAT PLEDGE Nb. Config.
t x d Soda V. M. 1 3 30 sec. 3 2 6 30 sec. 6 3 14 30 sec. 14 Minepump 1 2 30 sec. 2 2 7 30 sec. 7 3 13 30 sec. 13
Aero UC5 1 2 60 sec. 2
2 8 60 sec. 8
3 15 60 sec. 15 Claroline 1 6 60 sec. 6
2 21 60 sec. 21 3 71 60 sec. 71
2. Project the FTS model f ts on each configuration c, to get the behavioural model (Transition System) ts cor-responding to c. The projection operator for FTSs has been defined by Classen et al. [4]. It creates a new tran-sition system ts from f ts by removing all trantran-sitions that may not be executed by c, all states that may not be reached in c, and all actions that are never executed in c. Feature expressions are dropped during the pro-cess to give a behavioural model ts for c without any variability information. For instance, the projection of the configuration {V endingM achine, Beverages, Soda, T ea, Currency, Euro} on the FTS f ts in Fig. 1b will give a transition system corresponding to f ts with no feature expressions on the transitions, with-out: states 2 and 4; their incoming and outgoing tran-sitions; transition s4
take
−→ s1; and pay, change, return,
and cancel actions.
3. For each configuration, compute the coverage of its ts on f ts: divide the number of states, transitions, and actions in ts by the number of states, transitions, and actions (resp.) in f ts. The cumulated coverage is cal-culated by dividing the number of states, transitions, and actions in the union of the configurations’ ts by the number of states, transitions, and actions (resp.) in f ts. The states, transitions, and actions appearing more than once in the different configurations’ ts are thus counted only once.
The FD of each model has been used as input to the SPLCAT and PLEDGE tools to generate sets of configu-rations. The SPLCAT tool can generate, for a given FD and a given t between 1 and 3, a set of valid configurations satisfying the 1-wise, 2-wise, or 3-wise FD coverage crite-ria. The PLEDGE tool can generate, for a given FD and a given number of configurations x, a certain time d, a set of x configurations using an evolutionary algorithm maximising the distance amongst configurations of the set. We used as x the number of configurations generated by SPLCAT for each model. The d parameter has the default value 60 sec., except for smaller models where it had (after several trials) to be reduced to 30 sec. to avoid memory errors during ex-ecution. Table 2 presents the different parameters used for each model and the number of generated configurations. We ran the tools on a Ubuntu Linux machine with an Intel Core i3 (3.10GHz) processor and 4GB of memory.
1 2 3 4 5 6 7 0.4 0.6 0.8 1.0 Nb. of Config. Co v.
Claroline: State Cov.
PLEDGE 6 P. PLEDGE 21 P. PLEDGE 71 P. SPLCAT 1−W 6P. SPLCAT 2−W 21 P. SPLCAT 3−W 71 P. 1 2 3 4 5 6 7 0.4 0.6 0.8 1.0 Nb. of Config. Co v.
Minepump: State Cov.
PLEDGE 2P. PLEDGE 7P. PLEDGE 13P. SPLCAT 1−W 2P. SPLCAT 2−W 7P. SPLCAT 3−W 13P. 2 4 6 8 10 12 14 0.2 0.4 0.6 0.8 1.0 Nb. of Config. Co v.
Claroline: Trans. Cov.
PLEDGE 6 P. PLEDGE 21 P. PLEDGE 71 P. SPLCAT 1−W 6P. SPLCAT 2−W 21 P. SPLCAT 3−W 71 P. 2 4 6 8 10 12 14 0.2 0.4 0.6 0.8 1.0 Nb. of Config. Co v.
Minepump: Trans. Cov.
PLEDGE 2P. PLEDGE 7P. PLEDGE 13P. SPLCAT 1−W 2P. SPLCAT 2−W 7P. SPLCAT 3−W 13P. 1 2 3 4 5 6 7 0.2 0.4 0.6 0.8 1.0 Nb. of Config. Co v.
Claroline: Action Cov.
PLEDGE 6 P. PLEDGE 21 P. PLEDGE 71 P. SPLCAT 1−W 6P. SPLCAT 2−W 21 P. SPLCAT 3−W 71 P. 1 2 3 4 5 6 7 0.2 0.4 0.6 0.8 1.0 Nb. of Config. Co v.
Minepump: Action Cov.
PLEDGE 2P. PLEDGE 7P. PLEDGE 13P. SPLCAT 1−W 2P. SPLCAT 2−W 7P. SPLCAT 3−W 13P.
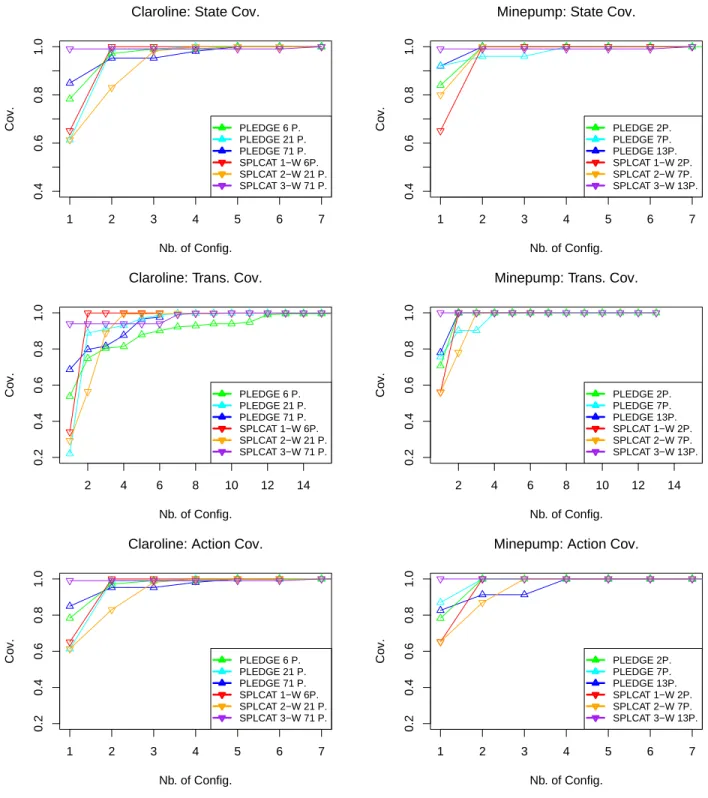
Figure 2: Model coverage of the Claroline and Minepump models
3.2
Results
We present here only results for the Claroline and Minepump
models – the most representative – in Fig. 22. The plots in Fig. 2 presents the cumulated coverage for states, transi-tions, and actions in the FTS for the different
configura-2Complete results may be downloaded from https://
tions generated using PLEDGE and SPLCAT for the Claro-line and Minepump models, added progressively by order of coverage. Results for the Soda Vending Machine exhibit the same tendencies as those of the Minepump model. The Aero UC5 behavioural model has a coverage of 100% for states, transitions, and actions for every configuration generated using SPLCAT and PLEDGE, because its FTS has only 4 transitions specific to 2 different features, 2 transitions for each feature, present in each configuration. The number of configurations considered on the axis of Fig. 2 has been lim-ited to 7 for states and actions and 14 for transitions. The number of generated configurations is higher (as shown in Tab. 2), but the cumulated coverage value did not increase further after 7 configurations for states and actions coverage and 14 configurations for transitions coverage.
4.
INITIAL INSIGHTS
Regarding our research question, for the models we elab-orated and settings we experimented, we obtained rapidly a complete coverage: relatively few configurations are needed to fully cover states, transitions and actions for the two ap-proaches reported here. This is to be expected for our two “academic” models, but on larger and more realistic mod-els (Claroline), this tendency tends to be confirmed. Of course, we need to replicate our assessment on a larger sam-ple of realistic behavioural models, but this seems encour-aging for the usage of structural coverage criteria at the FD level beyond the scope of detecting behavioural feature in-teractions [2].
Second, on these “small” feature models, exact t-wise cov-erage (SPLCAT) yielded better covcov-erage on all our behav-ioural criteria for t = 3. This further indicates that higher values than the usual 2-wise are relevant [36] and there-fore should be used when the number of configurations is “reasonable”. PLEDGE tends to outperform SPLCAT on 1-wise (each feature is covered at least once) and 2-1-wise with a smaller number of configurations. Since for a given execu-tion time, a smaller number of configuraexecu-tions means more time to evolve the population (set of configurations) and less time spent computing distances amongst them, maybe the poor performance of PLEDGE for t=3 (largest num-ber of configurations) can be explained in such a way. We also used the local maximum distance (termed “greedy” in the tool),which is outperformed in terms of coverage by the global maximum distance (termed “NearOptimal” in the tool) [15]. It also seems that some of the memory errors we ran into (related to thread creation) can be accounted by this default choice of the algorithm. Indeed, threads are associated to evolutions of the population and local distance algorithm is fast: we therefore have a thread explosion prob-lem on these “small” FDs. Therefore, additional settings and trade-offs need to be investigated to be able to compare the tools. Detailed tool comparison in this context is beyond the scope of our research question. This is therefore left for future work.
Finally, for both approaches, this initial assessment shows that there is also a need for prioritisation and optimal be-havioural coverage. For example, on the 71 configurations generated by SPLCAT (t=3), one configuration is sufficient to cover all states on both the Minepump and Claroline models. This configuration can be found directly using our all-states algorithm [10]. If similarity and t-wise coverage are shown to consistently sample configurations that achieve
good behavioural coverage, as this assessment suggests, then they can be used as first “filters” on very large feature mod-els (assuming an intractable FTS for all-states algorithm) to prune the FTS and then run a behavioural coverage gen-eration technique. Prioritisation may be initiated at the FTS level [8] and combined with behavioural/structural cri-teria [9]. There is no such one-cricri-teria-fits-all approach in this endeavour: an all-states criterion may poorly cover tran-sitions (e.g. on the Claroline case) [10]. Exploring syner-gies between these criteria, both at the structural and be-havioural models, therefore seems the best option.
4.1
Threats to Validity
4.1.1
Internal Validity
Our assessment was applied on 4 models only. In order to mitigate this risk, we chose 2 “academic” models (Soda Vending machine and Minepump) and 2 larger and “real” models (AeroUC 5 and Claroline). These models were ob-tained from different sources and represent different kinds of systems: AeroUC5 is an embedded system where mod-els have been designed by hand by engineers; Claroline is a web-based application where models have been reverse en-gineered from a running instance.
4.1.2
Construct Validity
The PLEDGE input parameters have been arbitrarily cho-sen. To keep a fair comparison between the results of the PLEDGE and SPLCAT tools, we kept the same number of configurations x as generated by SPLCAT. Estimating the time d, however is more tricky. In [15], we used the same gen-eration time as SPLCAT. Unfortunately in our case, some t-wise computations did take less than 1 second in SPLCAT and PLEDGE does not allow to enter such values. Thus we initially went for the default values provided by the tool. As mentioned above, playing with a wider range of parameter values and with different similarity algorithms will mitigate this threat.
FTS models relate variability to behaviour using feature expressions on transitions, other modelling languages may relate variability to behaviour in other ways (e.g., associate variability to states instead of transitions), which will give different results for the state, transitions and actions cov-erage. FTS is a basic formalism to which we can easily transform other modelling languages and mappings. Thus, we can investigate the influence of the mapping between fea-tures and behavioural models.
4.1.3
External Validity
We cannot guarantee that our 4 models are representative of real SPLs. We mixed sources and domains to mitigate this threat. The largest model (Claroline) is a particular kind of application: a web application accessible through PHP pages in a web browser with a small number of states and a huge number of transitions. This kind of application allows a very flexible navigation from page to page either by clicking on the links in the different pages or by a direct access with a link in a bookmark or an e-mail. The Claroline FD has few constraints, giving a large set of possible configurations (over 5,000,000).
The small number of features in the considered FD does not allow us to generalize our results for large product lines. To the best of our knowledge, there exists no FD with both
a large number of features and an associated behavioural model accessible for research and experimentation.
5.
RELATED WORK
There have been few efforts to relate feature models and behavioural models to reason about both structural and be-havioural coverage. Lochau et al. [28] create a “150%” stat-echart model resulting from the composition of individual behaviours associated to features. They considered cover-age from a feature interaction point of view, that is when the composed machines interact through common model ele-ments. Rather, we considered independent coverage criteria at the FM level and assessed them on 4 different SPLs.
Other approaches usually reason at only one level to assess coverage criteria for SPLs. For structural test generation, t-wise coverage is an obvious metric [15, 33, 39]. Regarding behavioural coverage, an initial approach [38] was to con-sider a product-based approach [37] and assess coverage on behavioural models where all variability has been resolved: usual model-based criteria can then be used. There is how-ever interest in defining variability-aware versions of these criteria [9] and generation techniques [2, 27].
Finally, a promising way to evaluate coverage-driven SPL testing is mutation analysis [16, 26] paving the way for new SPL test generation techniques [14].
6.
CONCLUSION
In this paper, we presented an initial assessment of SPL behavioural coverage of configurations sampled by SPLCAT (t-wise) and PLEDGE (dissimilarity-based) tools. We gen-erated configurations for 4 models relatively small in terms of variability: from 9 up to 44 features. We showed that, for our models, the behaviour of the selected configurations cov-ers the product line for a small set of configurations: from 3 for state and action coverage and between 5 and 8 for tran-sition coverage. This seems promising for the usage of struc-tural coverage criteria at the FD level. However, the formal relationship between structural and behavioural SPL cover-age remains to be established. As a result, maximising be-havioural coverage cannot be done only according to struc-tural criteria. For instance, the Claroline FTS may be 100% covered using only 1 product. In our future work, we would like to establish this formal relationship to be able to define hybrid behavioural/structural criteria. The understanding of this formal relationship will also be guided by further replications of our assessment on larger and more complex (features, constraints, hard-to-reach behaviour, etc.) mod-els.
7.
REFERENCES
[1] M. Al-Hajjaji, T. Th¨um, J. Meinicke, M. Lochau, and G. Saake. Similarity-based prioritization in software product-line testing. In S. Gnesi, A. Fantechi,
P. Heymans, J. Rubin, and K. Czarnecki, editors, 18th International Software Product Line Conference, SPLC ’14, Florence, Italy, September 15-19, 2014, pages 197–206. ACM, 2014.
[2] H. Cichos, S. Oster, M. Lochau, and A. Sch¨urr. Model-based Coverage-driven Test Suite Generation for Software Product Lines. In MODELS ’11, LNCS, pages 425–439. Springer, 2011.
[3] A. Classen. Modelling with FTS: a Collection of Illustrative Examples. Technical Report P-CS-TR
SPLMC-00000001, PReCISE Research Center, University of Namur, Namur, Belgium, 2010. [4] A. Classen, M. Cordy, P.-Y. Schobbens, P. Heymans,
A. Legay, and J.-F. Raskin. Featured Transition Systems : Foundations for Verifying
Variability-Intensive Systems and their Application to LTL Model Checking. TSE, 39(8):1069–1089, 2013. [5] D. M. Cohen, S. R. Dalal, M. L. Fredman, and G. C.
Patton. The AETG System: an approach to testing based on combinatorial design. IEEE Transactions on Software Engineering, 23(7):437–444, 1997.
[6] M. B. Cohen, M. B. Dwyer, and J. Shi. Interaction testing of highly-configurable systems in the presence of constraints. In Proceedings of the 2007 international symposium on Software testing and analysis, ISSTA ’07, pages 129–139, New York, NY, USA, 2007. ACM. [7] X. Devroey, M. Cordy, G. Perrouin, E.-Y. Kang, P.-Y.
Schobbens, P. Heymans, A. Legay, and B. Baudry. A vision for behavioural model-driven validation of software product lines. In ISoLA ’12, volume 7609 of LNCS, pages 208–222, Heraklion, Greece, 2012. Springer.
[8] X. Devroey, G. Perrouin, M. Cordy, P.-Y. Schobbens, A. Legay, and P. Heymans. Towards statistical prioritization for software product lines testing. In VaMoS ’14, pages 10:1–10:7. ACM, 2013.
[9] X. Devroey, G. Perrouin, A. Legay, M. Cordy, P.-Y. Schobbens, and P. Heymans. Coverage Criteria for Behavioural Testing of Software Product Lines. In ISoLA ’14, volume 8802 of LNCS, pages 336–350, Corfu, Greece, 2014. Springer.
[10] X. Devroey, G. Perrouin, and P.-Y. Schobbens. Abstract Test Case Generation for Behavioural Testing of Software Product Lines. In Proceedings of the 18th International Software Product Line Conference: Companion Volume for Workshops, Demonstrations and Tools, SPLC ’14, pages 86–93, New York, NY, USA, 2014. ACM.
[11] B. J. Garvin, M. B. Cohen, and M. B. Dwyer. Evaluating improvements to a meta-heuristic search for constrained interaction testing. Empirical Softw. Engg., 16(1):61–102, Feb. 2011.
[12] H. Hemmati, A. Arcuri, and L. C. Briand. Empirical investigation of the effects of test suite properties on similarity-based test case selection. In IEEE Fourth International Conference on Software Testing, Verification and Validation, ICST 2011, Berlin, Germany, 21-25 March 2011, pages 327–336. IEEE Computer Society, 2011.
[13] H. Hemmati and L. C. Briand. An industrial investigation of similarity measures for model-based test case selection. In IEEE 21st International Symposium on Software Reliability Engineering, ISSRE 2010, San Jose, CA, USA, 1-4 November 2010, pages 141–150. IEEE Computer Society, 2010.
[14] C. Henard, M. Papadakis, and Y. Le Traon. Mutation-based generation of software product line test configurations. In C. Le Goues and S. Yoo, editors, Search-Based Software Engineering, volume 8636 of Lecture Notes in Computer Science, pages 92–106. Springer International Publishing, 2014.
[15] C. Henard, M. Papadakis, G. Perrouin, J. Klein, P. Heymans, and Y. Le Traon. Bypassing the combinatorial explosion: Using similarity to generate and prioritize t-wise test configurations for software product lines. IEEE Transactions on Software Engineering, 40(7):650–670, 2014.
[16] C. Henard, M. Papadakis, G. Perrouin, J. Klein, and Y. Le Traon. Assessing software product line testing via model-based mutation: An application to similarity testing. In 2013 IEEE Sixth International Conference on Software Testing, Verification and Validation, Workshops Proceedings, Luxembourg, Luxembourg, March 18-22, 2013, pages 188–197. IEEE, 2013.
[17] C. Henard, M. Papadakis, G. Perrouin, J. Klein, and Y. Le Traon. Multi-objective test generation for software product lines. In SPLC ’13, pages 62–71. ACM, 2013.
[18] C. Henard, M. Papadakis, G. Perrouin, J. Klein, and Y. Le Traon. PLEDGE: a product line editor and test generation tool. In 17th International Software Product Line Conference co-located workshops, SPLC 2013 workshops, Tokyo, Japan - August 26 - 30, 2013, pages 126–129. ACM, 2013.
[19] M. F. Johansen, O. Haugen, and F. Fleurey. Properties of realistic feature models make combinatorial testing of product lines feasible. In Proceedings of the 14th international conference on Model driven engineering languages and systems, MODELS’11, pages 638–652, Berlin, Heidelberg, 2011. Springer-Verlag.
[20] M. F. Johansen, Ø. Haugen, and F. Fleurey. An algorithm for generating t-wise covering arrays from large feature models. In Proceedings of the 16th International Software Product Line Conference -Volume 1, SPLC ’12, pages 46–55, New York, NY, USA, 2012. ACM.
[21] M. F. Johansen, Ø. Haugen, F. Fleurey, E. Carlson, J. Endresen, and T. Wien. A technique for agile and automatic interaction testing for product lines. In B. Nielsen and C. Weise, editors, Testing Software and Systems - 24th IFIP WG 6.1 International
Conference, ICTSS 2012, Aalborg, Denmark, November 19-21, 2012. Proceedings, volume 7641 of Lecture Notes in Computer Science, pages 39–54. Springer, 2012.
[22] M. F. Johansen, Ø. Haugen, F. Fleurey, A. G. Eldegard, and T. Syversen. Generating better partial covering arrays by modeling weights on sub-product lines. In MoDELS ’12, pages 269–284, 2012. [23] C. K¨astner, A. von Rhein, S. Erdweg, J. Pusch,
S. Apel, T. Rendel, and K. Ostermann. Toward variability-aware testing. In FOSD ’12, pages 1–8. ACM, 2012.
[24] D. R. Kuhn, D. R. Wallace, and A. M. Gallo, Jr. Software fault interactions and implications for software testing. IEEE Trans. Softw. Eng., 30(6):418–421, June 2004.
[25] R. Kuhn, Y. Lei, and R. Kacker. Practical combinatorial testing: Beyond pairwise. IT Professional, 10:19–23, 2008.
[26] H. Lackner and M. Schmidt. Towards the assessment of software product line tests: a mutation system for
variable systems. In S. Gnesi, A. Fantechi, M. H. ter Beek, G. Botterweck, and M. Becker, editors, 18th International Software Product Lines Conference -Companion Volume for Workshop, Tools and Demo papers, SPLC ’14, Florence, Italy, September 15-19, 2014, pages 62–69. ACM, 2014.
[27] H. Lackner, M. Thomas, F. Wartenberg, and S. Weissleder. Model-based test design of product lines: Raising test design to the product line level. In Software Testing, Verification and Validation (ICST), 2014 IEEE Seventh International Conference on, pages 51–60. IEEE, 2014.
[28] M. Lochau, S. Oster, U. Goltz, and A. Sch¨urr. Model-based pairwise testing for feature interaction coverage in software product line engineering. Software Quality Journal, 20(3-4):567–604, 2012.
[29] M. Lochau, S. Peldszus, M. Kowal, and I. Schaefer. Model-based testing. In Formal Methods for
Executable Software Models, pages 310–342. Springer, 2014.
[30] J. D. McGregor. Testing a software product line. In P. Borba, A. Cavalcanti, A. Sampaio, and
J. Woodcock, editors, Testing Techniques in Software Engineering, Second Pernambuco Summer School on Software Engineering, PSSE 2007, Recife, Brazil, December 3-7, 2007, Revised Lectures, volume 6153 of Lecture Notes in Computer Science, pages 104–140. Springer, 2007.
[31] S. Oster, F. Markert, and P. Ritter. Automated incremental pairwise testing of software product lines. In Proceedings of the 14th international conference on Software product lines: going beyond, SPLC’10, pages 196–210, Berlin, Heidelberg, 2010. Springer-Verlag. [32] S. Oster, A. W¨ubbeke, G. Engels, and A. Sch¨urr. A
survey of model-based software product lines testing. In Model-based Testing for Embedded System, pages 339–381. CRC Press, Boca Raton, FL, USA, 2011. [33] G. Perrouin, S. Oster, S. Sen, J. Klein, B. Baudry, and
Y. Le Traon. Pairwise testing for software product lines: comparison of two approaches. Software Quality Journal, 20(3-4):605–643, 2012.
[34] G. Perrouin, S. Sen, J. Klein, B. Baudry, and Y. Le Traon. Automated and scalable t-wise test case generation strategies for software product lines. In Proceedings of the 2010 Third International Conference on Software Testing, Verification and Validation, ICST ’10, pages 459–468, Washington, DC, USA, 2010. IEEE Computer Society.
[35] H. Samih, M. Acher, R. Bogusch, H. Le Guen, and B. Baudry. Deriving Usage Model Variants for Model-based Testing: An Industrial Case Study. In IEEE, editor, 2014 19th International Conference on Engineering of Complex Computer Systems (ICECCS 2014), Tianjin, Chine, 2014.
[36] M. Steffens, S. Oster, M. Lochau, and T. Fogdal. Industrial evaluation of pairwise SPL testing with moso-polite. In U. W. Eisenecker, S. Apel, and S. Gnesi, editors, Sixth International Workshop on Variability Modelling of Software-Intensive Systems, Leipzig, Germany, January 25-27, 2012. Proceedings, pages 55–62. ACM, 2012.
I. Schaefer. The PLA model: on the combination of product-line analyses. In VaMoS ’13, page 14. ACM, 2013.
[38] S. Weißleder. Test models and coverage criteria for automatic model-based test generation with UML state machines. PhD thesis, Humboldt University of Berlin,
2010.
[39] A. Williams and R. Probert. A practical strategy for testing pair-wise coverage of network interfaces. In Software Reliability Engineering, 1996. Proceedings., Seventh International Symposium on, pages 246–254, Oct 1996.
![Figure 1: The soda vending machine example [4]](https://thumb-eu.123doks.com/thumbv2/123doknet/14510731.720882/3.918.91.433.74.464/figure-the-soda-vending-machine-example.webp)