RESEARCH OUTPUTS / RÉSULTATS DE RECHERCHE
Author(s) - Auteur(s) :
Publication date - Date de publication :
Permanent link - Permalien :
Rights / License - Licence de droit d’auteur :
Dépôt Institutionnel - Portail de la Recherche
researchportal.unamur.be
University of Namur
Comparison of Reduced Point Charge Models of Proteins: Molecular Dynamics
Simulations of Ubiquitin
Leherte, Laurence; Vercauteren, Daniel P.
Published in:
SCIENCE CHINA Chemistry
DOI:
10.1007/s11426-014-5109-8
Publication date:
2014
Document Version
Peer reviewed version Link to publication
Citation for pulished version (HARVARD):
Leherte, L & Vercauteren, DP 2014, 'Comparison of Reduced Point Charge Models of Proteins: Molecular Dynamics Simulations of Ubiquitin', SCIENCE CHINA Chemistry, vol. 57, no. 10, pp. 1340-1354.
https://doi.org/10.1007/s11426-014-5109-8
General rights
Copyright and moral rights for the publications made accessible in the public portal are retained by the authors and/or other copyright owners and it is a condition of accessing publications that users recognise and abide by the legal requirements associated with these rights. • Users may download and print one copy of any publication from the public portal for the purpose of private study or research. • You may not further distribute the material or use it for any profit-making activity or commercial gain
• You may freely distribute the URL identifying the publication in the public portal ?
Take down policy
If you believe that this document breaches copyright please contact us providing details, and we will remove access to the work immediately and investigate your claim.
For Review Only
Comparison of reduced point charge models of proteins: Molecular
Dynamics simulations of Ubiquitin
Journal: SCIENCE CHINA Chemistry
Manuscript ID: SCC-2014-0054.R1
Manuscript Type: Article
Date Submitted by the
Author:
n/a
Complete List of Authors: Leherte, Laurence; University of Namur, Chemistry
Vercauteren, Daniel; University of Namur, Chemistry
Keywords:
Molecular electrostatic potential, electron density, smoothing of
molecular fields, critical points, point charge model, protein,
Ubiquitin
Speciality: Theory and Computation Chemical
For Review Only
Comparison of reduced point charge models of proteins:
Molecular Dynamics simulations of Ubiquitin
Laurence LEHERTE*, Daniel P. VERCAUTEREN Unité de Chimie Physique Théorique et Structurale
Laboratoire de Physico-Chimie Informatique Namur MEdicine & Drug Innovation Center (NAMEDIC)
Department of Chemistry
University of Namur, Rue de Bruxelles 61, B-5000 Namur (Belgium)
*Corresponding author (email: [email protected], Tel. 81-724560, Fax. +32-3 4 5 6 7 8 9 10 11 12 13 14 15 16 17 18 19 20 21 22 23 24 25 26 27 28 29 30 31 32 33 34 35 36 37 38 39 40 41 42 43 44 45 46 47 48 49 50 51 52 53 54 55 56 57
For Review Only
Abstract
Reduced point charge models of amino acids are used to model Ubiquitin (PDB: 1UBQ). They are designed (i) from local extremum positions in charge density (CD) distribution functions built from the Poisson equation applied to smoothed molecular electrostatic potential functions, or (ii) from local maximum positions in promolecular electron density distribution (ED) functions. Charge values are fitted versus all-atom Amber99 molecular electrostatic potentials. The program GROMACS is used to generate molecular dynamics trajectories of the protein, under various implementation schemes, solvation, and temperature conditions. Point charges that are not located on atoms are considered as virtual sites with a nul mass and radius. The results illustrate that secondary structure is best preserved with the CD-based model at low temperatures and in vacuum. This indicates that local potential energy wells are consistent with the all-atom model. However, at room temperature, the structure is best conserved when point charges are forced to be located on atoms, due to a better description of the Coulomb 1-4 energy terms. The ED-based model, generated at a lower resolution, led to the largest discrepancies versus the all-atom case. The CD-based model allows the formation of protein-water H-bonds with geometrical properties similar to the all-atom ones. Contrarily, intra-molecular H-bonds are not well described. Structural, thermodynamical, and dynamical properties of proteins modelled with reduced point charge models are also significantly affected by the choice of the solvent force field.
Keywords
Molecular electrostatic potential, electron density, smoothing of molecular fields, critical points, point charge model, protein, Ubiquitin
1 Introduction
Topological analyses, also known as critical point (CP) analyses, of three-dimensional (3D) molecular properties such as electron density (ED) distribution functions are a well-known subject of research [1]. For example, the topology of an ED distribution function is particularly useful to interpret bonding and interactions through the Bader’s Atom-In-Molecule theory [2-5] with applications to various chemical systems [6-8], in crystallography [9-13] and particularly in H-bond analysis [14,15], and in molecular similarity analysis [16-19]. 3 4 5 6 7 8 9 10 11 12 13 14 15 16 17 18 19 20 21 22 23 24 25 26 27 28 29 30 31 32 33 34 35 36 37 38 39 40 41 42 43 44 45 46 47 48 49 50 51 52 53 54 55 56 57 58 59
For Review Only
Intermolecular interactions can also be analysed through the topography of molecular electrostatic potential (MEP) functions. Calculations have initially been proposed by Gadre and coll. [20,21] and later by Leboeuf et al. [22] who showed how MEP CPs are related to the electronic structure (π bonds, lone pairs, …) of the investigated molecules. It was also illustrated that promolecular representations, based on non-interacting spherical atoms, nevertheless provide acceptable results for the analysis of MEP minima along internuclear axes [23,24]. Mata et al. [25] reported that zero-flux surfaces occurring in a MEP of an isolated molecule are also observed between atoms, like for the ED, but the actual partition of the space in volumes is different from that of the ED. The authors associated each local maxima (nuclei) and minima with electrophilic and nucleophilic sites, respectively, with the corresponding basins indicating their influence zones [25]. They gave a particular application to H bonds in ref. [26]. By iteratively visualizing the direction of the MEP gradient calculated on spherical surfaces centered at various molecular points, Roy et al. [27] determined the critical points of the MEP function, and proposed that the recognition between two species occurs when the geometry is such that a change in the nature of their MEP CPs is observed [28]. Yeole et al. also proposed methods to map the CPs of ED and MEP at any level of QM theory [29,30].
Rather than working at atomic resolution, we focus on the analysis of smoothed molecular properties. In recent publications, we described reduced point charge models (RPCMs) [31,32] built from CP analyses of smoothed molecular properties, and their particular applications to Molecular Dynamics (MD) simulations of proteins [33,34].
In the last paper [34], we specifically focussed on the implementation of the models using the program GROMACS [35,36] which allows to describe non-atomic charges as virtual sites with a null mass, connected to the molecular structure through geometrical rules. A detailed description of the reduced point charge templates and representations of the amino acid (AA) was achieved, with a particular application to MD simulations of the Ubiquitin-UIM1 complex. The analysis focussed on the comparison of energetic (Lennard-Jones, short-range Coulomb), structural (secondary structure, gyration radius, H-bond geometry), and dynamical (atom fluctuations, self-diffusion coefficient) results. Two 3D molecular properties, the MEP and the promolecular ED leading to different RPCMs, were considered. For the first case [31,32], a limited number of point charges was obtained through the search for the maxima and minima of a smoothed version of the charge density (CD) generated by the atomic charges defined in Amber99 (or Amber99SB) FF [37]. For the second case, the point charges 3 4 5 6 7 8 9 10 11 12 13 14 15 16 17 18 19 20 21 22 23 24 25 26 27 28 29 30 31 32 33 34 35 36 37 38 39 40 41 42 43 44 45 46 47 48 49 50 51 52 53 54 55 56 57
For Review Only
were obtained through a search of the maxima of the full promolecular ED of the molecular structure and, as in the first approach, charge values were assigned to those maxima using a least-square charge fitting procedure. This last molecular property is easily calculated using the so-called Promolecular Atom Shell Approximation (PASA) formalism that was developed by Amat and Carbó-Dorca [38,39]. Those two approaches led to various implementation schemes which are also applied in the present paper.
In the present work, we carry on with the assessment of the RPCMs briefly described hereabove with an additional focus on free energy differences between the various point charge models, on H-bond and water dynamics, and on the effect of the water force field (FF). Various solvation and temperature conditions are considered. The selected system is Ubiquitin (PDB: 1UBQ), a protein that is largely studied in literature. At this stage of our research work, only the electrostatic part of the FF is modified. Energetic, structural, and dynamical properties are calculated and compared to the all-atom ones, which is easily achieved as no conversion stage is required between the reduced and all-atom models.
2 Computational methods
The mathematical formalism that was used to design a molecular reduced point charge representation of a protein and its corresponding charge values is briefly presented. Additional details are available in refs. [31,32].
2.1 Critical points of a smoothed molecular property
Based on the formalism presented by Kostrowicki et al. [40], a smoothed version of the PASA ED model is calculated as a sum over individual atomic ED distribution functions,
ρa,s(r):
( )
∑
= − = 3 1 , , 2 , i r i a s a i a e r α β ρ (1) with: 3 4 5 6 7 8 9 10 11 12 13 14 15 16 17 18 19 20 21 22 23 24 25 26 27 28 29 30 31 32 33 34 35 36 37 38 39 40 41 42 43 44 45 46 47 48 49 50 51 52 53 54 55 56 57 58 59For Review Only
(
)
3/2 a,i 2 3 8 1 1 2 s π w Za a,i a,i a,i ς ς α + = and(
)
s a,i a,i a,i 8 1 2 ς ς β + = (2)where Za, wa,i and ςa,i, are the atomic number of atom a, and the two fitted parameters,
respectively. The smoothing factor s is given in bohr2 (1 bohr = 0.52918 10-10 m).
The smoothed analytical CD distribution function ρ’a,s(r) that is obtained from an atomic
charge qa and the Poisson equation can be expressed as:
( )
a r s s a e s q r /4 2 / 3 ' , 2 4 ) ( = − π ρ (3)where a and r stand for the atom index and the distance versus the atom position, respectively. Unsmoothed functions are obtained by setting s = 0 bohr2.
To locate CPs, an algorithm initially described by Leung et al. [41] was implemented to follow the trajectories of the CPs, more specifically, the maxima and/or minima in a CD or ED function, as a function of the degree of smoothing. At scale s = 0, each atom of a molecular structure is considered as the starting point of a trajectory that is generated as s increases. Trajectories are merged when their inter-distance is lower than a predetermined value (SI 1). It has the effect to progressively reduce the number of extrema in the 3D molecular property.
2.2 Design of amino acid reduced point charge models
CD-based templates
The design of the AA point charge templates was achieved in four stages. First, isolated AA structures were assigned Amber99 atom charges using PDB2PQR [42]. Side chain extrema were located using our merging/clustering algorithm applied to the CD distribution functions smoothed at s = 1.7 bohr2 (SI 1). This was carried out separately for the positively and negatively charged atoms. Second, the charge values of the resulting peaks and pits considered together were fitted versus the all-atom MEP generated from the side chain atoms only. In this procedure, several rotamer descriptions were taken into account according to their occurrence probability (see Table 2 of [31]). Third, the main chain point charges were located in accordance with the motif found for the central Gly residue in an extended poly-3 4 5 6 7 8 9 10 11 12 13 14 15 16 17 18 19 20 21 22 23 24 25 26 27 28 29 30 31 32 33 34 35 36 37 38 39 40 41 42 43 44 45 46 47 48 49 50 51 52 53 54 55 56 57
For Review Only
Gly strand [31] and, fourth, a second charge fitting procedure (SI 1), now carried out versus the MEP calculated using all the AA atoms, was applied to determine the charge values of the main chain point charges while preserving the side chain point charges first obtained. All main chain point charges, observed to be located very close to the C and O atoms, were set exactly on those atoms. The AA models, that consist of two point charges for the main chain and up to six point charges for the side chain, are detailed in ref. [34]. In the further parts of the present paper, the model will be referred to as model mCD (Figure 1).
A second point charge description was derived from the model described above. In this second model, to fully facilitate the implementation of the AA models in GROMACS [35,36], most of the point charges were set exactly on atoms of the residues, and a charge fitting algorithm was again applied (SI 1). Results are presented in ref. [34]. The model will be referred to as model mCDa further in the text (Figure 1).
PASA-based templates
CP searches of the PASA ED distribution functions were carried out to generate even coarser charge descriptions for the AAs. Indeed, with the CD distribution functions depicted above, it is not possible to obtain less than two main chain point charges per residue, i.e., one negative and one positive charge associated with the O and C atoms, respectively. Within the framework of the PASA, the ED depends only on the atomic number Za of the atoms, not on
their charge (Eqs. 1 and 2). In the further parts of this paper, the model, that consists of one point charge on the main chain and no more than two charges on the side chain, will be referred to as model mPASA (Figure 1). Its implementation within the program GROMACS is detailed in ref. [34].
Automated point charge generation procedure
The point charge templates described above are established for isolated AA structures. Their properties are thus independent on the neighbourhood of a particular protein. To study large proteins, an automation stage was developed to rapidly locate point charges on the whole structure. It is fully based on the application of a superimposition algorithm of CP templates of each AA onto their corresponding all-atom structure of the protein under study. We used the program QUATFIT [43] to, first, superimpose a limited set of atoms from the template on the studied structure, and then use the resulting transformation matrix to generate the corresponding point charge coordinates. The GROMACS topology file, wherein point 3 4 5 6 7 8 9 10 11 12 13 14 15 16 17 18 19 20 21 22 23 24 25 26 27 28 29 30 31 32 33 34 35 36 37 38 39 40 41 42 43 44 45 46 47 48 49 50 51 52 53 54 55 56 57 58 59
For Review Only
charges are defined as virtual sites, is further generated through an in-house program that outputs geometrical parameters as reported and discussed in ref. [34].
2.3 Free energy calculations
In the present paper, we used two methods to evaluate the free energy difference between the all-atom and RPCMs. The first method belongs to the so-called thermodynamical integration (TI) approaches where the difference in configurational free energy between two states 0 and
1, ∆F0→1 (or ∆G0→1at constant pressure), is calculated using a numerical integration:
λ λ λ λ d U F ( ) 1 0 1 0
∫
∂ ∂ = ∆ → (4)where the brackets < >λ stand for ensemble averages calculated over a MD simulation carried
out with the potential energy function U(λ) defined as:
0 1 (1 )
)
( U U
U λ =λ + −λ (5)
In the particular slow-growth approach [44], λ is progressively brought from 0 to 1 along the isothermal MD trajectory. Even if the approach is known to be debatable, especially when states 0 and 1 largely differ, i.e., when the transformation cannot be considered as reversible, it has the advantage to require only one MD simulation to obtain an estimate of∆F0→1. The second approach, known as the Bennett’s acceptance ratio (BAR) [45,46], is based on the statistical mechanics expression (SI 1):
1 0 1 1 0 ln Z Z F→ = − ∆ β (6)
where β-1 = kT. Zi is the configurational integral, i.e., the contribution to the partition
function that involves the interaction energy Ui between the particles of a system. The
method requires the calculation of free energy differences between successive intermediate states generated using Eq. 6, which are later summed to provide∆F0→1(SI 1). It is reported to 3 4 5 6 7 8 9 10 11 12 13 14 15 16 17 18 19 20 21 22 23 24 25 26 27 28 29 30 31 32 33 34 35 36 37 38 39 40 41 42 43 44 45 46 47 48 49 50 51 52 53 54 55 56 57
For Review Only
be less sensitive than other methods to the overlap deficiencies that might occur between two energy distributions obtained from two successive MD trajectories [47].
3 Application to the MD of Ubiquitin
Ubiquitin is a reference protein system that has already been studied by MD simulations [48-51]. It involves 76 AA residues and its secondary structure is characterized by a β-sheet made of five strands as well as two α-helices formed by residues 23 to 34 and 56 to 59. In the present work, molecular simulation conditions were kept as close as possible of those proposed by Showalter and Brüschweiler in their work about the Amber99SB FF [49]. MD trajectories of the system were run using the GROMACS 4.5.5 program package [35,36] with the Amber99SB FF [49] under particle mesh Ewald periodic boundary conditions. Long-range dispersion corrections to energy and pressure were applied. The initial configurations were retrieved from the Protein Data Base (PDB: 1UBQ) and solvated, when required, using TIP4P-Ew (a four-site model) [52] or SPC (a three-site model) [53] water molecules so as protein atoms lie at least at 1.2 nm from the cubic box walls. The His residue of Ubiquitin is in its Hisε state, thus leading to a total protein charge of 0 |e-|. The systems were first approximately optimized to eliminate large forces and then heated to 50 K through a 10 ps canonical (NVT) MD, with a time step of 2 fs and LINCS constraints acting on bonds involving H atoms. The trajectory was followed by two successive 20 ps heating stages, at 150 K and at the final temperature, i.e., 300, 277 or 250 K, under the same conditions. Next, each system was equilibrated during 50 ps in the NPT ensemble to relax the solvent molecules. Finally, a 20 ns MD simulation was performed in the NPT ensemble, for explicitly solvated systems. The ‘V-Rescale’ and ‘Parrinello-Rahman’ algorithms were selected to perform NVT and NPT simulations, respectively. Free energy differences between the reduced and all-atom models were evaluated during these 20 ns trajectories. An extra production run of 20 ns was performed for the evaluation of energetic, structural, and dynamical properties of the systems. Trajectory data were saved every 2 ps. A description of the systems under study is presented in Table 1. The total number of point charges to be considered for the protein is reduced by a factor of 4.3 and 12.3 for the CD- and PASA-based models, respectively. Depending upon the implementation, the number of non-atomic charges of Ubiquitin is largely variable. For instance, there are only two of such point charges in model mCDa, which originate from the Phe residues of Ubiquitin (Figure 1), while 3 4 5 6 7 8 9 10 11 12 13 14 15 16 17 18 19 20 21 22 23 24 25 26 27 28 29 30 31 32 33 34 35 36 37 38 39 40 41 42 43 44 45 46 47 48 49 50 51 52 53 54 55 56 57 58 59
For Review Only
the largest number is obtained for mPASA, with 99 non-atomic charges. There are, in each simulation, approximately 10350 water molecules that are not coarse-grained.
To evaluate the gain in calculation time, CPU times were compared for the vacuum MD simulations (Table 1). Values are reported for 107 MD steps carried out on two 2.66 GHz processors for the all-atom and CD-based models, and two 2.20 GHz processors for the PASA-based model. A gain of about 25 % in calculation time is observed. Keeping a significant number of all-atom contributions to the FF, i.e., bonded and Lennard-Jones (LJ) terms, prevents a larger gain in the calculation time. For solvated systems, it is clear that a real gain in simulation time will be possible if coarse-graining occurs at the solvent level.
3.1 Protein structure
In our previous paper [34], the study of molecular electrostatic maps showed that at short range, e.g., in the case of intramolecular interactions, the point charge models are expected to affect the dynamical behaviour of the molecules. As seen from the analysis of the MD trajectories of Ubiquitin, changes in the secondary structure elements are indeed observed (Figure 2). The figure illustrates that the structure of the protein is characterized by a loss of the secondary structure elements versus the all-atom simulation results, both in water and in vacuum. Among all RPCMs, mCD seems to lead to the most important loss in regular secondary structure elements when the system is solvated. Indeed, as already shown in ref. [34], mCDa is more efficient in the modelling of some secondary structure elements versus model mCD. mCDa allows to preserve the α-helix in SPC water, while mPASA preserves β-sheet elements, again in SPC water. In vacuum, β-strand and α-helix moeities disappear with models mCDa and mPASA, respectively. Only model mCD allows to preserve almost all secondary structure elements in vacuum. As mCD appeared to lead to the least stable structures in water, additional MD simulations were carried out at lower temperatures, i.e., 277 and 250 K, like in our previous study [34]. The last temperature value was not selected to reflect a physical state for water (it is below the freezing point of the solvent) but was chosen to locally probe the potential energy hyper-surface of the system. At such low temperatures, stabilization of the secondary structure occurs for the mCD model, which illustrates that the energy hypersurface minimum observed with the all-atom model is existing with the mCD model, but energy barriers are lowered [34]. The existence of that minimum may be due to the conserved all-atom bonded and LJ energy terms in the FF. At 3 4 5 6 7 8 9 10 11 12 13 14 15 16 17 18 19 20 21 22 23 24 25 26 27 28 29 30 31 32 33 34 35 36 37 38 39 40 41 42 43 44 45 46 47 48 49 50 51 52 53 54 55 56 57
For Review Only
elements of 1UBQ are stabilized while, at 250 K, almost all secondary structure elements are present regardless of the water FF. Snapshots of the protein structure taken at the end of the last 20 ns MD trajectories (Figure 3) confirm a better secondary structure conservation for the mCD model in vacuum, at all studied temperatures, with RMSD values of 3.23, 2.52, and 2.05 Å, and in water at 250 K. RMSD values that are reported in Figure 3 were calculated
versus the Cα atoms of the PDB structure using the program VMD [54]. For the solvated
systems, Cα-Cα distance maps established from the final snapshots are displayed in SI 2.
Besides the all-atom calculations, only models mCDa and mPASA let a helix-like structure appear for residues 23 to 28, as well as β-strand contact regions, between strands 10 to 17, 1 to 7, 64 to 72, 40 to 45, and 48 to 50, for that particular MD frame. For mCD, it appears that the fold of the first half of the AA sequence only is preserved, except at low temperatures where the fold is recovered.
Other structural analyses of the MD trajectories obtained for the models dealt with the gyration radius rG of the protein, which appears to be affected by the protein environment
(Table 2). Nevertheless, a precise effect of the model on rG is not clearly established. In
water, rG presents various trends. Stability is observed mainly with SPC water, except for
mCD where the standard deviation is equal to 0.041 nm, while with TIP4P-Ew, both CD-based models, i.e., mCD and mCDa, present slightly increasing rG values, characterized by
larger deviation values, 0.016 and 0.014 nm. Except for mPASA, all rG values obtained in
vacuum are smaller than in water, by about 5 % for the all-atom model, but up to 19 % for the mCD model. This was already reported in our last paper regarding MD simulations of the Ubiquitin-UIM-1 complex [34], where we showed that, in vacuum, the RPCMs led to a high protein compactness together with a lower atom mobility. The mPASA representation level seems to be the least affected by the presence of the solvent, in other words, rG is similar,
regardless of the environment. Such a lack of structuring effect depending on the medium was also illustrated in Figure 2.
H-bonds were determined based on cut-off values of 30° and 0.35 nm for the angle Hydrogen-Donor-Acceptor and the distance Donor-Acceptor, respectively. From values reported in Table 3, one first notices that the contraction of the protein in vacuum comes with a huge increase in the number of intra-molecular H-bonds, regardless of the model. For example, a mean value of 95.4 versus 55.5 H-bonds is observed for the all-atom model, in water and in vacuum, respectively. For the particular mCD model, one even observes that, at T = 250 K, the number of H-bonds in vacuum reaches the value obtained for the all-atom model, i.e., a value close to 95 H-bonds. Second, even though the water model does not seem 3 4 5 6 7 8 9 10 11 12 13 14 15 16 17 18 19 20 21 22 23 24 25 26 27 28 29 30 31 32 33 34 35 36 37 38 39 40 41 42 43 44 45 46 47 48 49 50 51 52 53 54 55 56 57 58 59
For Review Only
to affect the number of intra-molecular H-bonds at the all-atom level, it is not the case for the RPCMs. Model mCD however appears to be the least affected, with values of 10.0 and 10.3 H-bonds under the TIP4P-Ew and SPC solvents, respectively. Third, all RPCMs lead to a drastic decrease in the number of such H-bonds versus the all-atom model, due to the cancelling of charges on most of the H atoms of the AAs. As further discussed, it comes with an increased number of protein-water H-bonds (except for mPASA) which confirms the strong influence of the solvent on the protein deconstruction in the case of the CD-based RPCMs.
H-bond distance and angle distributions of intra-molecular H-bonds formed with Ubiquitin are illustrated in Figure 4. From such distributions, one first notices that the angle distributions present a maximum at about 12.5 and 15.0° for the all-atom models only, in water and in vacuum, respectively. All RPCMs lead to a different angle distribution with no well-defined maxima, thus showing a loss in the orientational properties of H-bonds. Regarding the distances, mCD appears to best approach the distributions obtained for the all-atom model with, for example in TIP4P-Ew water, a maximum at 0.30 and 0.29 nm, respectively. mCD however leads to two slightly separated maxima when the SPC model is used, located at 0.29 and 0.31 nm. With TIP4P-Ew, mCDa also adopts two maxima, with minimal distances that are clearly shorter than in the all-atom distance distribution, i.e., 2.39
versus 2.48 nm, while mCD has the same minimal value. In vacuum, there is a better
agreement between the all-atom and the CD-based distance distributions. On the whole, even if point charges are not located on atoms in the mCD model, it does not appear to significantly affect H-bond distances.
A plot of Cα-Cα radial distribution functions (RDF) (Figure 5) shows a change in the
structuring of the protein in the sense that, in water, a strong decrease of the very first peak,
i.e., around 0.6 nm, of the RDFs is observed for all RCPMs, especially mCD. SPC water
emphasizes this effect. The use of CD-based models seems to involve a repulsion between the AAs, with RDF shortest distances that are now less probable when a solvent is used. It is even more marked in TIP4P-Ew RDFs, with only a shoulder at about 0.45 nm. All these observations are to be related to the enhanced loss in secondary structure elements already observed before (Figure 2). Contrarily, model mPASA appears to lead to the most similar RDFs versus the all-atom model, with however, a less structured long-range behaviour. In vacuum, the agreement between all RDFs is clearer.
The mCD model, with atomic charges located on virtual sites, thus involves stronger changes 3 4 5 6 7 8 9 10 11 12 13 14 15 16 17 18 19 20 21 22 23 24 25 26 27 28 29 30 31 32 33 34 35 36 37 38 39 40 41 42 43 44 45 46 47 48 49 50 51 52 53 54 55 56 57
For Review Only
charge occurrence distributions of Ubiquitin (Figure 6), one notices that mCD is characterized by the most positive values, just below 1.5 |e-|, as well as by a high content of the most negative charges, close to -1 |e-|. mPasa leads to a high content of slightly negative charges, as in the all-atom model. mCDa is also characterized by two sets of more negative and more positive charges, but it seems that their location on atoms favours the preservation of secondary structure elements.
3.2 Protein hydration and H-bond dynamics
A study of the distance and angle distributions of the inter-molecular H-bonds formed between the solvated protein and water shows that CD-based models have a similar shape to the all-atom model while mPASA is the less consistent one (Figure 4). It is particularly clear when one studies the angle distributions wherein mPASA presents a maximum at about 27° rather than 9°, regardless of the water model. More surprisingly, for model mCD, a larger average number of main chain H-bonds, 245.5 versus 190.2, is obtained despite the absence of charges on the N and H atoms of the protein main chain (Table 4). It appeared to be due to the C=O groups that, with their different charge distribution versus the all-atom case, affect the formation of such a type of interaction, but also to the protein deconstruction [34], leading to a larger accessible surface for the formation of H-bonds with the solvent. The consequence of those changes in the number of H-bonds formed with the solvent is illustrated in Figure 7, where it is clearly seen that the very first hydration shell composed of water molecules interacting with the protein surface atoms, is levelled in the RPCM RDF curves. However, the minimal distance observed in the RDF is similar for all models, except for mPASA which appears to be more “repulsive” with values of about 0.17 versus 0.15 nm in the all-atom case. Such changes observed for the mPASA model are accompanied by huge decreases in the number of H-bonds, i.e., 77.6 and 80.4 H-bonds for TIP4P-Ew and SPC, respectively, due to the absence of any dipole on the AA main chains (Table 4). One can finally mention that all Hw-protein RDFs are characterized by a shorter contact distance than their corresponding Ow
-protein RDF, showing that H atoms are statistically closer to the -protein structure.
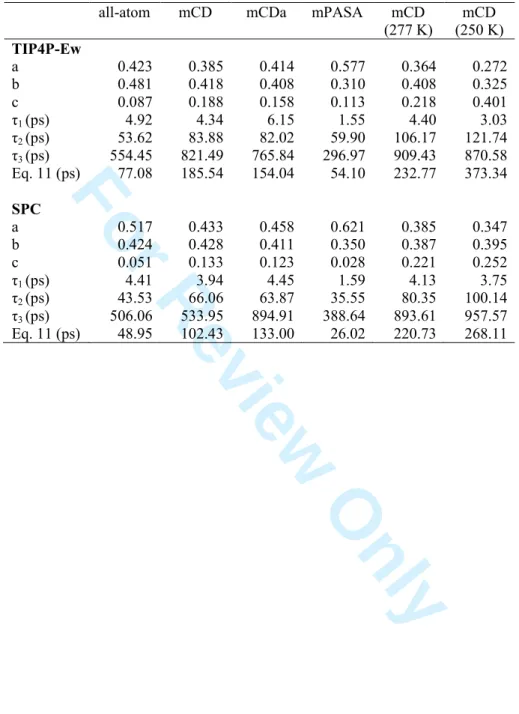
The dynamics of protein-water H-bonds can be characterized through the so-called H-bond autocorrelation functions (SI 3):
3 4 5 6 7 8 9 10 11 12 13 14 15 16 17 18 19 20 21 22 23 24 25 26 27 28 29 30 31 32 33 34 35 36 37 38 39 40 41 42 43 44 45 46 47 48 49 50 51 52 53 54 55 56 57 58 59
For Review Only
h t h h t C( )= (0) ( ) (7)where h(t) is assigned a value of 1 or 0 if a particular pair of atoms is H-bonded or not. The approach that was applied to evaluate overall correlation times τ associated with C(t), is:
∫
∞ = 0 ) ( dtt C τ (8)The H-bond autocorrelation functions were also fitted with a 3-exponential function:
3 2 1 / / / ) (t ae tτ be tτ ce tτ C = − + − + − (9)
with parameters listed in Table 5. All fits led to correlation coefficients R between 0.997 and 0.999. Visually, the mPASA function has the most similar behaviour to the all-atom one, while mCD and mCDa functions are characterized by a slower decrease (SI 3). This is consistent with the larger overall τ values reported in Table 5. For example, one gets values of 185.54 and 154.04 ps for models mCD and mCDa, respectively, to be compared with τ = 77.08 ps for the all-atom model. Lowering the temperature has the expected effect to make relaxation slower, and thus τ larger. SPC and TIP4P-Ew have an opposite effect on τ, increasing its value for mCDA or mCD when TIP4P-Ew or SPC are applied, respectively. A detailed study of parameters of Eq. 9 shows that the influence of the water FF becomes more important at larger times, which may be due to an effect of the protein conformational relaxation. Such an influence is also visible for mCDa. The effect on mPASA is seen through the well-marked increase of parameter a versus b. When T decreases, the third component of C(t), that is associated with the largest correlation time, is increased versus a and b. For example, for mCD with TIP4P-Ew at 300, 277, and 250 K, one gets c = 0.188, 0.218, and 0.401, respectively, while τ3 has no precise trend. This is also observed with SPC.
For the fastest contribution, mPASA differs the most versus the all-atom case, with a higher proportion of the faster component a = 0.577, and a lower value of the corresponding correlation time τ1 = 1.55 ps. With SPC, differences between mCD and mCDa are limited,
while they are larger with TIP4P-Ew, especially for τ1.
3 4 5 6 7 8 9 10 11 12 13 14 15 16 17 18 19 20 21 22 23 24 25 26 27 28 29 30 31 32 33 34 35 36 37 38 39 40 41 42 43 44 45 46 47 48 49 50 51 52 53 54 55 56 57
For Review Only
3.3 Energetics and thermodynamics
MD-averaged energy values are not easily comparable between the different models as the protein conformations generated by the MD simulations differ. A first discussion is thus based on the comparison of potential energy values E of Ubiquitin calculated from all intra-molecular energy terms for the conformations generated through MD trajectories. Values were obtained using post-processing calculations applied to the TIP4P-Ew 20 ns MD trajectories of the RPCMs (SI 4). The correlation coefficient values obtained for Eall-atom
versus EmCD, Eall-atom versus EmCDa, and Eall-atom versus EmPASA are equal to 0.914, 0.902, and
0.617, respectively. The values illustrate the better agreement with Ubiquitin all-atom potential energy values for the CD-based RPCMs, but still show that part of the conformational energies do not adopt the same trend as in the all-atom model.
A second discussion concerns the optimized, and thus similar, protein conformations (SI 5). Regarding intra-molecular energy contributions, the reduction of the point charge number leads to a decrease of bonding energy terms, i.e., stretching, bending, dihedral, versus their corresponding all-atom contribution. For example, the stretching terms of the RPCMs are about 80 to 90 kJ.mol-1 versus 137.42 kJ.mol-1 for the all-atom model. This comes with an increase of the non-bonding Coulomb (Cb) and Lennard-Jones (LJ) terms. Cb-14 contribution, i.e., Cb interactions involving two atoms separated by three chemical bonds, is absent in the mPASA model while it is systematically larger by about 3200 kJ.mol-1 for the mCD model, consistently with the charge distributions analysis reported earlier (Figure 6). This increase is also observed for the MD simulations, even at low temperatures. Thus, mCDa with a value of 12465.32 kJ.mol-1 is closer to the all-atom value, i.e., 12463.77 kJ.mol
-1
, due to the preserved location of the charges on the atoms of the protein structure. The short-range LJ term (LJ-SR) of mCD appears to also be less stabilizing, regardless of the medium, except at lower temperatures. Indeed, for mCD, one notices an average of -1531.84
versus -2203.11 kJ.mol-1 for the TIP4P-Ew all-atom case. Similarly, the Cb-SR term is less stabilizing, whatever the medium is, and the mCD term is closer to the corresponding all-atom term, with -3944.84, -3841.82, and -6572.02 kJ.mol-1 for the optimized, TIP4P-Ew solvated, and vacuum structures. When solvation is considered, the TIP4P-Ew FF appears to provide intra-molecular energy values that are closer to the corresponding values for the optimized structures, except for mPASA.
Regarding inter-molecular protein-water interactions, the CD-based RPCMs emphasize the negative character of the Cb-SR term at all temperatures, while mPASA is largely less 3 4 5 6 7 8 9 10 11 12 13 14 15 16 17 18 19 20 21 22 23 24 25 26 27 28 29 30 31 32 33 34 35 36 37 38 39 40 41 42 43 44 45 46 47 48 49 50 51 52 53 54 55 56 57 58 59
For Review Only
stabilizing. For example, mean values of -8024.49, -12127.84, -11436.43, and -3423.91 kJ.mol-1, are obtained for the TIP4P-Ew all-atom, mCD, mCDa, and mPASA models, respectively. The change in the protein conformation together with the change in the point charge model lead to varying LJ terms. In water, LJ-SR is stabilizing for mCD and mPASA
versus the all-atom, with mean values of -708.75, -1026.21, and -506.14 kJ.mol-1, respectively. The greater influence of the solvent for these two RPCMs involves a change of 186.54 kJ.mol-1 for mCD and -60.56 kJ.mol-1 for mCDa, while it is only 6.32 kJ.mol-1 for the all-atom model. Again, a clear comparison is difficult to achieve because protein conformations differ.
Free energy differences between the all-atom and RPCMs were calculated using the two different approaches briefly described earlier. With the BAR method, 11 simulations of 107 steps each were carried out for λ values between 0 and 1 with a step of 0.1, λ being kept constant at each simulation. The approach was applied only to systems in vacuum. With the slow growth approach, one simulation of 107 steps was achieved, with λ varying from 0 to 1 with a step of 10-7, λ being changed at each simulation step. Values of ∆Gall−atom→RPCM are
reported in Table 6. It is seen that the slow growth approach provides values that are comparable to BAR ones, even if slightly larger, by about 2 % for the mCD model at 300 K to 7.5 and 10.9 % at 277 and 250 K, respectively. This can be due to the fact that the two states under study, the all-atom and the RPCM ones, differ only by their point charges. To understand the range of values obtained for the RPCMs, calculations were also achieved for rigid systems, i.e., systems for which the conformational contribution to ∆G should be limited, allowing the evaluation of the electrostatic contribution to ∆G.
It is first observed that all ∆G values are positive, denoting a favoured all-atom point charge representation, even for rigid systems. Rigidity involves very different trends. In vacuum, ∆G is largely reduced versus the flexible case. For example, one obtains ∆G differences of (748.86 - 1658.86) kJ.mol-1 for the mCD system. In the presence of TIP4P-Ew water, ∆G increases, with now a ∆G difference of (1685.07 - 1313.26) kJ.mol-1. SPC seems to bring very little changes between the rigid and flexible systems. As ∆G values are higher for systems held fixed in TIP4P-Ew water, it is concluded that the deconstruction of the protein structure during the simulation has a favourable effect on the all-atom-to-RPCM transformation. Contrarily, in vacuum, flexibility is unfavourable to the transformation. It might be related to the better structure conservation of mCD in vacuum than in water 3 4 5 6 7 8 9 10 11 12 13 14 15 16 17 18 19 20 21 22 23 24 25 26 27 28 29 30 31 32 33 34 35 36 37 38 39 40 41 42 43 44 45 46 47 48 49 50 51 52 53 54 55 56 57
For Review Only
(Figures 2 and 3). As observed for previously studied properties, mPASA differs very much from the other RPCMs, in that the ∆G values are very high, around 7 to 9 103 kJ.mol-1, and the model leads to a larger ∆G in water than in vacuum, contrarily to the other RPCMs. For example, the presence of water favours the alchemical all-atom-to-mCD transformation by 345.60 kJ.mol-1, with ∆G equal to 1658.86 kJ.mol-1 in vacuum and 1313.26 kJ.mol-1 in TIP4P-Ew water. Contrarily to some previously studied structural properties, mCD now appears to be closer to the all-atom model, both for the rigid and flexible systems.
The study of rigid systems allows to evaluate the electrostatic contribution to ∆G, ∆Ge, and
its intra- and inter-molecular components ∆Ge-intra and ∆Ge-inter. For mCD, ∆Ge-intra = 748.86
kJ.mol-1, i.e., ∆G calculated for the rigid system in vacuum, while ∆Ge-inter is assumed to be
the difference between the corresponding ∆G value for the solvated system minus the previous value, i.e., 1685.07 - 748.86 = 936.21 kJ.mol-1. Following such a reasoning, SPC has thus a smaller effect on the ∆Ge-inter values than TIP4P-Ew.
In literature, values for the electrostatic contribution to the solvation free energy of Ubiquitin, ∆Ge-solv, are reported [55,56]. Depending upon the method used to evaluate ∆Ge-solv, values
of -997.02, -1049.17, -1085.22 kcal.mol-1[55], -1446 and -1459 kcal.mol-1 [56] are given. If one considers the allatom value obtained with the TIP3P and Amber94 potentials, i.e., -1085.22 kcal.mol-1, a thermodynamical cycle (Figure 8) provides a value of -3604.36 kJ.mol-1 for the hydration free energy of the mCD protein, a value lower by 936.17 kJ.mol-1 than the all-atom value (Table 6). Such differences cannot be fully explained by the charge distributions (Figure 6), as model mPASA presents a charge distribution that is similar to the all-atom one.
3.4 Water dynamics
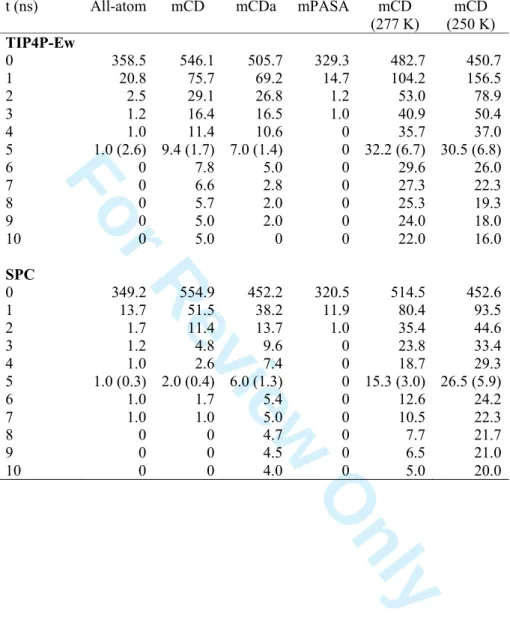
To study the effect of the point charge model on water dynamics, solvent molecules were classified in two sets, within 0.35 nm from the protein atoms, and between 0.35 and 1.40 nm. As water molecules can migrate from one region to another during the simulation, the following strategy was employed. First, at each 1000th frame (every 1 ns), water molecules included in a layer of 0.35 nm from the protein surface atoms were detected. Then, the number of molecules staying in the given layer, for a given period of time, were averaged, considering each frame as a time origin (Table 7). From Table 7, it is first seen that the mean number of water molecules interacting closely with the protein surface is higher for the CD-based RPCMs than for the all-atom model. For example, one observes averages of 546.1 3 4 5 6 7 8 9 10 11 12 13 14 15 16 17 18 19 20 21 22 23 24 25 26 27 28 29 30 31 32 33 34 35 36 37 38 39 40 41 42 43 44 45 46 47 48 49 50 51 52 53 54 55 56 57 58 59
For Review Only
molecules for the mCD model rather than 358.5 for the all-atom one. Among those values, about 1.7 and 2.6 % are still present in the layer after 5 ns, respectively. It thus confirms that water dynamics is slowed down when one uses a CD-based RPCM rather than the mPASA model that shows a faster water exchange with time. In that later case, fewer molecules, an average of 329.3, are actually observed in the layer. Conclusions are similar when SPC is used, with however a slightly faster exchange as discussed hereafter, notably due to a larger water self-diffusion coefficient, as illustrated later. Contrarily, a slower exchange is observed, as expected, at lower temperatures for the mCD model.
Persistence times, characterizing a fast and a slower regime (Table 8), were obtained by fitting a two-exponential function to the normalized mean number of water molecules, N(t):
2 1 / / ) (t ae tτ be tτ N = − + − (10)
All fits led to a correlation coefficient R of 0.9997 or higher. It is assumed that the shortest persistence times, τ1, are associated with molecules that are at the boundary of the water
layer, and are thus exchanging faster with the bulk, while the largest persistence time, τ2,
characterizes water molecules that are more strongly bound to the protein surface atoms through H-bonds. The major component, depicted by the larger parameter a, is assigned the shortest time constant τ1. In that framework, it is shown that CD-based RCPMs involve a
slower dynamics (larger τ1 values) than the all-atom model. For example, mCD and all-atom
models give values of 0.423 and 0.337 ps, respectively, with the TIP4P-Ew potential. The mPASA τ1 values are similar to the all-atom values, both for TIP4P-Ew and SPC solvent.
mCD again appears as more easily influenced by the water FF than the other RPCMs, mCDa and mPASA, especially regarding τ2. A second component in the molecular behaviour is
characterized by the smaller parameters b and by greater persistence times (slower dynamics). The values τ2 however comes with the largest relative errors in the fitting
program (up to 50 %) and are thus less reliable.
The hereabove observations are consistent with a study of self-diffusion coefficients of water in the layer. Again, to be certain to study molecules that are within the layer, a short time range was considered, from 10 to 11 ns. This choice allowed to consider a relatively large number of molecules. The self-diffusion coefficients D were obtained through a fit of the MSD function between 100 and 400 ps. Results are presented in Table 9.
3 4 5 6 7 8 9 10 11 12 13 14 15 16 17 18 19 20 21 22 23 24 25 26 27 28 29 30 31 32 33 34 35 36 37 38 39 40 41 42 43 44 45 46 47 48 49 50 51 52 53 54 55 56 57
For Review Only
Dastidar and Mukhopadhyay also reported dynamical results for water as a function of their distance versus the Ubiquitin surface [48]. Values obtained for the all-atom model with the TIP4P-Ew water potential are consistent with their observations, i.e., a decrease in D as water gets closer to the protein surface, with a similar magnitude. It is also seen, from our results, that all RPCMs but mPASA involve a decrease in D versus the all-atom model with, for example, D = 0.64 10-5 and 1.28 10-5 cm2.s-1 for the mCD and all-atom models, respectively. This is consistent with the longer persistence times (Table 8), longer H-bond correlation times (Table 5), and more attractive Cb and LJ short range interactions (SI 5) discussed previously.
4 Conclusions and perspectives
Two reduced point charge models were considered for Molecular Dynamics (MD) simulations of Ubiquitin. The first model, based on charges located at critical points (CP) of smoothed amino acid (AA) charge density (CD) distribution functions calculated from Amber99 atomic values, involves two point charges on the main chain of each AA, precisely located on atoms C and O, and up to six charges for the side chain. The second model, built by assigning charges to the maxima of AA smoothed promolecular electron density distribution functions, considers one point charge on the main chain and no more than two charges on the side chain.
For the first model, two different implementations were considered. In a first stage, the model is applied as is by considering charges as virtual sites in the system (model mCD). Second, rather than being located away from atom positions, most of the charges are set at selected atom positions. Their values are recalculated accordingly (model mCDa). For the second model, only the first kind of implementation was considered (model mPASA).
MD simulations were carried out using the program GROMACS with the Amber99SB force field (FF), in water and in vacuum. Two water FFs were considered, TIP4P-Ew and SPC. The selected temperature was 300 K, except for model mCD for which two lower temperature values, 277, 250, and 150 K, were also considered.
Energetic, structural, and dynamical information were retrieved from the analysis of the MD trajectories of the reduced point charge models (RPCMs) and discussed versus the all-atom model and available literature data. An emphasis was put on the secondary structure elements of the protein, the energetics and free energy difference between RPCMs and the all-atom model, and the characterization of H-bonds within the protein and with the solvent. 3 4 5 6 7 8 9 10 11 12 13 14 15 16 17 18 19 20 21 22 23 24 25 26 27 28 29 30 31 32 33 34 35 36 37 38 39 40 41 42 43 44 45 46 47 48 49 50 51 52 53 54 55 56 57 58 59
For Review Only
On a structural point of view, one observed a progressive loss in the secondary structure of the proteins when RPCMs are used at room temperature. However, model mCD applied at low temperatures with the TIP4P-Ew FF, or in vacuum, allows to preserve the secondary structure elements of Ubiquitin. It is explained by a free energy difference in favour of a spontaneous transformation from the mCD to the all-atom state in vacuum, while the inverse transformation is favoured in water. At 300 K, model mCDa better preserves some secondary elements, due to a better description of the short range 1-4 Coulomb and Lennard-Jones energy terms. Model mPASA led to the largest differences versus the all-atom model in terms of energetic, structural, and dynamical properties of the system, as also illustrated in ref. [34]. First, the implementation of the mPASA model is such as no Cb-14 contributions to the potential energy are involved. Second, the number of point charges is too low to allow a first hydration shell as in the all-atom and in the other RPCMs. Geometrical parameters, that are associated with the existing H-bonds, adopt larger distance and angle values. Additionally, these H-bonds show a faster dynamics. The structure of the protein is particularly deconstructed in vacuum, contrarily to the trends followed by the other models. Even in water, Ubiquitin undergoes the more important contraction effect with the smallest gyration radius, while the other RPCMs systematically lead to an increase of the radius as shown in our previous paper [34].
If the CD-based RPCMs do not favour the formation of a first hydration shell as clearly as the all-atom model does, they however allow the formation of solute-solvent H-bonds with geometrical properties similar to the all-atom case. Intra-protein H-bonds are differently described with no well-defined angle distributions. On the whole, the change in the water FF has little effect on the all-atom protein model, but it has the largest effect on the mCD structure and thermodynamics. Indeed, TIP4P-Ew is best to model the protein structure and is more structuring at low temperature, possibly due to low self-diffusion coefficients D. SPC provides, on the average, a larger repulsion between the AAs, as corresponding Cα-Cα
radial distribution functions (RDFs) show less probable short separation distances. It also accelerate the protein-water H-bond dynamics.
MD simulations carried out with model mCD at temperatures below 300 K led to the conclusion that this particular point charge model is able to provide results that are essentially similar to the all-atom model. One finds there a clue to conclude that, with RPCMs, energy barriers of the potential well are lowered, conformations can be perturbed more easily, but the location of that potential well on the energy hyper-surface is similar [34]. Model mCD is 3 4 5 6 7 8 9 10 11 12 13 14 15 16 17 18 19 20 21 22 23 24 25 26 27 28 29 30 31 32 33 34 35 36 37 38 39 40 41 42 43 44 45 46 47 48 49 50 51 52 53 54 55 56 57
For Review Only
In conclusions, all aspects of MD analysis, i.e., energetics, dynamics, and structural criteria should be considered together to assess a RPCM, as they may give various trends. As already stated in ref. [34], Cb-14 term is important to preserve the protein structure. These terms are better reproduced when charges are located on atoms. Cb-SR seems also to be a characteristic that differentiates all-atom and RPCMs. As a perspective, a revision of the virtual site definition might be a path to follow in order to modify the Cb-14 energy terms to allow better RPCM MD trajectories. A way to revise such interactions is to modify the reference atoms selected to define the virtual sites. Indeed, within the GROMACS implementation, the forces acting on the virtual sites are redistributed among the reference atoms. Another aspect is to revisit the calculation of the point charge values.
This research used resources of the "Plateforme Technologique de Calcul Intensif (PTCI)" (http://www.ptci.unamur.be) located at the University of Namur, Belgium, which is supported by the F.R.S.-FNRS. The PTCI is member of the "Consortium des Équipements de Calcul Intensif (CÉCI)" (http://www.ceci-hpc.be). The authors gratefully acknowledge F. Wautelet and L. Demelenne for program installation and maintenance.
1 Gatti C. Challenging chemical concepts through charge density of molecules and crystals. Phys Scr, 2013, 87: 048102/1-048102/38
2 Bader RFW. Atoms in Molecules – A Quantum Theory. Oxford: Clarendon Press, 1990. 3 Popelier PLA. On the full topology of the Laplacian of the electron density. Coordin
Chem Rev, 2000, 197: 169-189
4 Matta CF, Gillespie RJ. Understanding and interpreting molecular electron density distributions. J Chem Educ, 2002, 79: 1141-1152
5 Matta CF, Bader RFW. An experimentalist’s reply to “What is an atom in a molecule?”.
J Phys Chem A, 2006, 110: 6365-6371
6 Aubert E, Porcher F, Souhassou M, Lecomte C. Characterization of intra-framework and guest-/host interactions in the AlPO4-15 molecular sieve by charge density analysis.
Acta Cryst B, 2003, 59: 687-700
7 Matta CF. Application of the quantum theory of atoms in molecules to selected physico-chemical and biophysical problems: Focus on correlation with experiment. J
Comput Chem, 2003, 24: 453-462 3 4 5 6 7 8 9 10 11 12 13 14 15 16 17 18 19 20 21 22 23 24 25 26 27 28 29 30 31 32 33 34 35 36 37 38 39 40 41 42 43 44 45 46 47 48 49 50 51 52 53 54 55 56 57 58 59
For Review Only
8 Becue A, Meurice N, Leherte L, Vercauteren DP. Description of protein-DNA complexes in terms of electron-density topological features. Acta Cryst D, 2003, 59: 2150-2162
9 Johnson C, ORCRIT. The Oak Ridge critical point network program. Chemistry Division, Oak Ridge National Laboratory, USA, 1977
10 Edgecombe KE, Ableson A, Baxter K, Chiverton A, Glasgow J, Fortier S. Topological analysis of the X-ray protein relative density maps utilizing the eigenvector following method. In: Mezey P, Robertson BE, Eds. Understanding Chemical Reactivity –
Electron, spin and momentum densities, and chemical reactivities. New York (USA,
NY): Kluwer Academic Publishers, 2000. 115-125
11 Katan C, Rabiller P, Lecomte C, Guezo M, Oison V, Souhassou M. Numerical computation of critical properties and atomic basins from three-dimensional grid electron densities. J Appl Cryst, 2003, 36: 65-73
12 Lecomte C, Souhassou M, Pillet S. Topology of experimental charge density: A tool for understanding atomic interactions. J Mol Struct, 2003, 647: 53-64
13 Rabiller P, Souhassou M, Katan C, Gatti C, Lecomte C. Accuracy of topological analysis of gridded electron densities. J Phys Chem Solids, 2004, 65: 1951-1955
14 Espinosa E, Souhassou M, Lachekar H, Lecomte C. Topological analysis of the electron density in hydrogen bonds. Acta Cryst B, 1999, 55: 563-572
15 Espinosa E, Molins E. Retrieving interaction potentials from the topology of the electron density distribution: The case of hydrogen bonds. J Chem Phys, 2000, 113: 5686-5694
16 Popelier PLA. Quantum Molecular similarity. 1. BCP space. J Phys Chem A, 1999, 103: 2883-2890
17 Popelier PLA, Smith PJ. QSAR models based on quantum topological molecular similarity. Eur J Med Chem, 2006, 41: 862-873
18 Roy K, Popelier PLA. Exploring predictive QSAR models using quantum topological molecular similarity (QTMS) descriptors for toxicity of nitroaromatics to Saccaromyces cerevisiae. QSAR Comb Sci, 2008, 27: 1006-1012
19 Leherte L, Vercauteren DP. Smoothed Gaussian molecular fields – An evaluation of molecular alignment problems. Theor Chem Acc, 2012, 131: 1259/1-1259/16
20 Pathak RK, Gadre SR. Maximal and minimal characteristics of molecular electrostatic potentials. J Chem Phys, 1990, 93: 1770-1773
3 4 5 6 7 8 9 10 11 12 13 14 15 16 17 18 19 20 21 22 23 24 25 26 27 28 29 30 31 32 33 34 35 36 37 38 39 40 41 42 43 44 45 46 47 48 49 50 51 52 53 54 55 56 57
For Review Only
21 Gadre SR, Bhadane PK, Pundlik SS, Pingale SS. Molecular recognition via electrostatic potential topography. Theor Comput Chem, 1996, 3: 219-255
22 Leboeuf M, Köster AM, Jug K, Salahub DR. Topological analysis of the molecular electrostatic potential. J Chem Phys, 1999, 111: 4893-4905
23 Pacios LF. Simple analytical representation of atomic electron charge densities, electrostatic potentials, and local exchange potentials. J Phys Chem, 1992, 96: 7294-7301
24 Botella V, Pacios LF. Analytic atomic electron densities in molecular self-similarity measures and electrostatic potentials. J Mol Struct (Theochem), 1998, 426: 75-85 25 Mata I, Molins E, Espinosa E. Zero-flux surfaces of the electrostatic potential: The
border of influence zones of nucleophilic and electrophilic sites in crystalline environment. J Phys Chem A, 2007, 111: 9859-9870
26 Mata I, Molins E, Alkorta I, Espinosa E. Topological properties of the electrostatic potential in weak and moderate N…H hydrogen bonds. J Phys Chem A, 2007, 111: 6425-6433
27 Roy D, Balanarayan P, Gadre SR. An appraisal of Poincaré-Hopf relation and application to topography of molecular electrostatic potentials. J Chem Phys, 2008, 129: 174103/1-174103/6
28 Roy DK, Balanarayan P, Gadre SR. Signatures of molecular recognition from the topography of electrostatic potential. J Chem Sci, 2009, 121: 815-821
29 Yeole SD, Gadre SR. Topography of scalar fields: molecular clusters and π-conjugated systems. J Phys Chem A, 2011, 115: 12769-12779
30 Yeole SD, López R, Gadre SR. Rapid topography mapping of scalar fields: large molecular clusters. J Chem Phys, 2012, 137: 074116/1-074116/7
31 Leherte L, Vercauteren DP. Coarse point charge models for proteins from smoothed molecular electrostatic potentials. J Chem Theory Comput, 2009, 5: 3279-3298
32 Leherte L, Vercauteren DP. Charge density distributions derived from smoothed electrostatic potential functions: Design of protein reduced point charge models. J
Comput-Aided Mol Des, 2011, 25: 913-930
33 Leherte L, Vercauteren DP. Implementation of a protein reduced point charge model towards Molecular Dynamics applications. J Phys Chem A, 2011, 115: 12531–12543 34 Leherte L, Vercauteren DP. Evaluation of reduced point charge models of proteins
through Molecular Dynamics simulations: Application to the Vps27 UIM-1 – Ubiquitin complex. J Mol Graphics Model, 2014, 47: 44-61
3 4 5 6 7 8 9 10 11 12 13 14 15 16 17 18 19 20 21 22 23 24 25 26 27 28 29 30 31 32 33 34 35 36 37 38 39 40 41 42 43 44 45 46 47 48 49 50 51 52 53 54 55 56 57 58 59
For Review Only
35 Hess B, Kutzner C, van der Spoel D, Lindahl E. GROMACS 4: Algorithms for highly efficient, load-balanced, and scalable molecular simulation. J Chem Theory Comput, 2008, 4: 435-447
36 Pronk S, Páll S, Schulz R, Larsson P, Bjelkmar P, Apostolov R, Shirts MR, Smith JC, Kasson PM, van der Spoel D, Hess B, Lindahl E. GROMACS 4.5: A high-throughput and highly parallel open source molecular simulation toolkit. Bioinformatics, 2013, 29: 845-854
37 Wang J, Cieplak P, Kollman PA. How well does a restrained electrostatic potential (RESP) model perform in calculating conformational energies of organic and biological molecules? J Comput Chem, 2000, 21: 1049-1074
38 Amat L, Carbó-Dorca R. Molecular electronic density fitting using elementary Jacobi rotations under atomic shell approximation. J Chem Inf Comput Sci, 2000, 40: 1188-1198
39 Amat L, Carbó-Dorca R. Quantum similarity measures under atomic shell approximation: First order density fitting using elementary Jacobi rotations. J Comput
Chem, 1997, 18: 2023-2039
40 Kostrowicki J, Piela L, Cherayil BJ, Scheraga HA. Performance of the diffusion equation method in searches for optimum structures of clusters of Lennard-Jones atoms.
J Phys Chem, 1991, 95: 4113-4119
41 Leung Y, Zhang JS, Xu ZB. Clustering by scale-space filtering. IEEE Trans Pattern
Anal Mach Intell, 2000, 22: 1396-1410
42 Dolinsky TJ, Nielsen JE, McCammon JA, Baker NA. PDB2PQR: An automated pipeline for the setup of Poisson-Boltzmann electrostatics calculations. Nucleic Acids
Res, 2004, 32: W665-W667
43 Heisterberg DJ. Technical report, Ohio Supercomputer Center, Translation from FORTRAN to C and input/output by J. Labanowski, Ohio Supercomputer Center, 1990. 44 Postma JPM, Berendsen HJC, Haak JR. Thermodynamics of cavity formation in water.
A molecular dynamics study. Faraday Symp Chem Soc, 1982, 17: 55-67
45 Bennett CH. Efficient estimation of free energy differences from Monte Carlo data. J
Comput Phys, 1976, 22: 245-268
46 Kim I, Allen TW. Bennett’s acceptance ratio and histogram analysis methods enhanced by umbrella sampling along a reaction coordinate in configurational space. J Chem
Phys, 2012, 136: 164103/1-164103/17 3 4 5 6 7 8 9 10 11 12 13 14 15 16 17 18 19 20 21 22 23 24 25 26 27 28 29 30 31 32 33 34 35 36 37 38 39 40 41 42 43 44 45 46 47 48 49 50 51 52 53 54 55 56 57
For Review Only
47 Shirts MR, Mobley DL, Chodera JD. Alchemical free energy calculations: Ready for prime time? Ann Rep Comput Chem, 2007, 3: 41-59
48 Dastidar SG, Mukhopadhyay C. Structure, dynamics, and energetics of water at the surface of a small globular protein: A molecular dynamics study. Phys Rev E, 2003, 68: 021921/1-021921/9
49 Showalter SA, Brüschweiler R. Validation of Molecular Dynamics simulations of biomolecules using NMR spin relaxation as benchmarks: Application to the AMBER99SB force field. J Chem Theory Comput, 2007, 3: 961-975
50 Virtanen JJ, Makowski L, Sosnick TR, Freed KF. Modeling the hydration layer around proteins: HyPred. Biophys J, 2010, 99: 1611–1619
51 Ganoth A, Tsfadia Y, Wiener R. Ubiquitin: Molecular modeling and simulations. J Mol
Graphics Model, 2013, 46: 29-40
52 Horn HW, Swope WC, Pitera JW, Madura JD, Dick TJ, Hura GL, Head-Gordon T. Development of an improved four-site water model for biomolecular simulations: TIP4P-Ew. J Chem Phys, 2004, 120: 9665-9678
53 Berendsen HJC, Postma JPM, van Gunsteren WF, Hermans J. Interaction models for water in relation to protein hydration. In: Pullman B, Ed. Intermolecular Forces. Dordrecht: Reidel, 1981. 331-342
54 Humphrey W, Dalk A, Schulten K. VMD - Visual Molecular Dynamics. J Mol
Graphics, 1996, 14: 33-38
55 Mei Y, Ji C, Zhang JZH. A new quantum method for electrostatic solvation energy of protein. J Chem Phys, 2006, 125: 094906/1-094906/7
56 Imai T, Harano Y, Kinoshita M, Kovalenko A, Hirata F. A theoretical analysis on hydration thermodynamics of proteins. J Chem Phys, 2006, 125: 024911/1-024911/7 3 4 5 6 7 8 9 10 11 12 13 14 15 16 17 18 19 20 21 22 23 24 25 26 27 28 29 30 31 32 33 34 35 36 37 38 39 40 41 42 43 44 45 46 47 48 49 50 51 52 53 54 55 56 57 58 59
For Review Only
Figure captions
Figure 1 Description of the three reduced point charge models (black spheres) of selected
AA residues in the framework of the Amber99 FF.
Figure 2 Secondary structure of Ubiquitin observed during the last 20 ns Amber99SB-based
MD trajectories at 300 K, obtained using the all-atom, mCD, mCDa, and mPASA models. Secondary structure elements are colour-coded as follows: Coil (white), α-helix (blue), π helix (purple), 310 helix (grey), β-sheet (red), β-bridge (black), bend (green), turn (yellow).
(For an interpretation of the references to colour, please refer to the online version of the paper).
Figure 3 Final snapshots of Ubiquitin obtained from the last 20 ns Amber99SB-based MD
trajectories at 300 K, generated using the all-atom, mCD, mCDa, and mPASA models. Secondary structure elements are colour-coded as follows: Coil (white), α-helix (blue), π helix (purple), 310 helix (grey), β-sheet (red), β-bridge (black), bend (green), turn (yellow).
Figures were generated using VMD [54]. RMSD values are calculated versus the Cα
coordinates of the PDB structure. (For an interpretation of the references to colour, please refer to the online version of the paper).
Figure 4 Distance and angle distribution functions of intra- and inter-molecular H-bonds
formed with Ubiquitin calculated from the last 10 ns of the Amber99SB-based MD trajectories at 300 K, obtained using the all-atom, mCD, mCDa, and mPASA models under various solvation conditions.
Figure 5 RDF of Cα-Cα atom pairs of Ubiquitin calculated from the last 10 ns of the
Amber99SB-based MD trajectories at 300 K, obtained using the all-atom, mCD, mCDa, and mPASA models under various solvation conditions.
Figure 6 Occurrence distributions of atomic charges, p(q), of Ubiquitin for the all-atom,
mCD, mCDa, and mPASA models.
Figure 7 RDF of water oxygen- and water hydrogen-protein atom pairs of solvated Ubiquitin 3 4 5 6 7 8 9 10 11 12 13 14 15 16 17 18 19 20 21 22 23 24 25 26 27 28 29 30 31 32 33 34 35 36 37 38 39 40 41 42 43 44 45 46 47 48 49 50 51 52 53 54 55 56 57
For Review Only
using the all-atom, mCD, mCDa, and mPASA models with TIP4P-Ew and SPC water FFs. All protein atoms are included in the calculations.
Figure 8 Thermodynamical cycle used for the evaluation of the electrostatic contribution to
the free energy of solvation of Ubiquitin, ∆Ge−solv, under the TIP4P-Ew potential, at 300 K. 3 4 5 6 7 8 9 10 11 12 13 14 15 16 17 18 19 20 21 22 23 24 25 26 27 28 29 30 31 32 33 34 35 36 37 38 39 40 41 42 43 44 45 46 47 48 49 50 51 52 53 54 55 56 57 58 59
For Review Only
Graphical abstract
Amino acid point charge model
MEP iso-contours of Ubiquitin All-atom mCD 3 4 5 6 7 8 9 10 11 12 13 14 15 16 17 18 19 20 21 22 23 24 25 26 27 28 29 30 31 32 33 34 35 36 37 38 39 40 41 42 43 44 45 46 47 48 49 50 51 52 53 54 55 56 57