RESEARCH OUTPUTS / RÉSULTATS DE RECHERCHE
Author(s) - Auteur(s) :
Publication date - Date de publication :
Permanent link - Permalien :
Rights / License - Licence de droit d’auteur :
Bibliothèque Universitaire Moretus Plantin
Institutional Repository - Research Portal
Dépôt Institutionnel - Portail de la Recherche
researchportal.unamur.be
University of Namur
High clinical performance and quantitative assessment of antibody kinetics using a
dual recognition assay for the detection of SARS-CoV-2 IgM and IgG antibodies
Mairesse, Antoine; Favresse, Julien; Eucher, Christine; Elsen, Marc; Tré-Hardy, Marie;
Haventith, Caroline; Gruson, Damien; Dogné, Jean-Michel; Douxfils, Jonathan; Göbbels, Paul
Published in:
Clinical biochemistry
DOI:
10.1016/j.clinbiochem.2020.08.009
Publication date:
2020
Document Version
Version created as part of publication process; publisher's layout; not normally made publicly available
Link to publication
Citation for pulished version (HARVARD):
Mairesse, A, Favresse, J, Eucher, C, Elsen, M, Tré-Hardy, M, Haventith, C, Gruson, D, Dogné, J-M, Douxfils, J
& Göbbels, P 2020, 'High clinical performance and quantitative assessment of antibody kinetics using a dual
recognition assay for the detection of SARS-CoV-2 IgM and IgG antibodies', Clinical biochemistry.
https://doi.org/10.1016/j.clinbiochem.2020.08.009
General rights
Copyright and moral rights for the publications made accessible in the public portal are retained by the authors and/or other copyright owners and it is a condition of accessing publications that users recognise and abide by the legal requirements associated with these rights. • Users may download and print one copy of any publication from the public portal for the purpose of private study or research. • You may not further distribute the material or use it for any profit-making activity or commercial gain
• You may freely distribute the URL identifying the publication in the public portal ? Take down policy
If you believe that this document breaches copyright please contact us providing details, and we will remove access to the work immediately and investigate your claim.
Contents lists available atScienceDirect
Clinical Biochemistry
journal homepage:www.elsevier.com/locate/clinbiochem
High clinical performance and quantitative assessment of antibody kinetics
using a dual recognition assay for the detection of SARS-CoV-2 IgM and IgG
antibodies
Antoine Mairesse
a, Julien Favresse
b,c, Christine Eucher
b, Marc Elsen
b, Marie Tré-Hardy
c,d,e,
Caroline Haventith
f, Damien Gruson
a, Jean-Michel Dogné
c, Jonathan Douxfils
c,g,⁎, Paul Göbbels
faDepartment of Laboratory Medicine, Cliniques Universitaires St-Luc and Université catholique de Louvain, Brussels, Belgium bDepartment of Laboratory Medicine, Clinique St-Luc Bouge, Namur, Belgium
cDepartment of Pharmacy, Namur Research Institute for LIfes Sciences, University of Namur, Belgium dDepartment of Laboratory Medicine, Iris Hospitals South, Brussels, Belgium
eFaculty of Medicine, Université libre de Bruxelles, Brussels, Belgium fDepartment of Laboratory Medicine, Saint Nikolaus Hospital, Eupen, Belgium gQualiblood sa, Namur, Belgium
A R T I C L E I N F O Keywords: COVID-19 SARS-CoV-2 Serology Kinetics Symptom onset A B S T R A C T
Objectives: Several serological SARS-CoV-2 immunoassays have been developed recently but require external
validation before widespread use. This study aims at assessing the analytical and clinical performance of the iFlash® anti-SARS-CoV-2 chemiluminescence assay for the detection of both IgM and IgG antibodies. The kinetics of the antibody response was also evaluated.
Design & Methods: The precision, carry-over, linearity, limit of blank, detection and quantification were assessed.
Sensitivity analysis was performed by using 178 sera collected from 154 RT-PCR confirmed COVID-19 patients. The specificity analysis was performed from 75 selected non-SARS-CoV-2 sera with a potential cross-reaction to the SARS-CoV-2 immunoassay.
Results: This iFlash® SARS-CoV-2 assay showed excellent analytical performance. After 2 weeks since symptom
onset, the sensitivities for IgM and IgG were 62.2% (95% CI: 52.3–71.2%) and 92.9%% (95% CI: 85.7–96.7%), respectively by using the cut-off provided by the manufacturer. After cut-off optimization (i.e. > 2.81 for IgM and > 4.86 for IgG), the sensitivity for IgM and IgG were 81.6 (95% CI: 72.7–88.1%) and 95.9% (95% CI: 89.4–98.7%), respectively. Optimized cut-off for IgG improved the sensitivity to reach 100% (95%CI: 87.6–100) from 28 days since symptom onset.
Conclusions: This study shows that the iFlash® SARS-CoV-2 assay from YHLO biotechnology, has satisfactory
analytical performance. Nevertheless, the sensitivity of the IgM is limited for a proper clinical use compared to IgG. The determination of anti-SARS-CoV-2 IgG antibodies from 28 days since symptom onset was associated with high sensitivity, especially using optimized cut-offs (i.e. 100%).
1. Introduction
On December 30, 2019, the city of Wuhan, China, experienced an outbreak of unexplained pneumonia. On January 7, 2020, a new be-tacoronavirus, severe acute respiratory syndrome coronavirus (SARS-CoV-2) was identified. The number of confirmed cases worldwide ex-ceeds 23 million and the number of deaths worldwide stands at 800,906 deaths[1,2]. The gold standard method for the diagnosis of
SARS-CoV-2 infection is (real-time) reverse transcription polymerase chain reac-tion (RT-PCR) in respiratory samples[3]. However, the accuracy of these molecular methods is variable and depends on several pre-ana-lytical variables such as specimen collection, transport and storage[4]. In addition, clinical factors including time since infection and viral load also impact the sensitivity of the test [3]. Moreover, RT-PCR is not expected to detect past infection[5]and requires a high laboratory workload, skilled operators, valuable instruments and reagents, and
https://doi.org/10.1016/j.clinbiochem.2020.08.009
Received 22 June 2020; Received in revised form 11 August 2020; Accepted 19 August 2020
⁎Corresponding author at: Department of Pharmacy, Namur Research Institute for LIfes Sciences, University of Namur, Belgium Rue de Bruxelles, 61, 5000 Namur
Belgium.
E-mail address:[email protected](J. Douxfils).
crucial safety measures[6]. Detection of SARS-CoV-2 antibodies offers new perspectives. Serology has several roles including the identification of convalescent plasma donors, the screening of populations to de-termine exposure and immunity, and the diagnostic, especially in late-onset patients with a low viral load[7,8].
A wide range of serological immunoassays has been developed by in vitro diagnostic companies for the detection of SARS-CoV-2 antibodies, with different antigens target and formats[3,6]. Independent validation by clinical laboratories are essential to access the analytical and clinical performance of these assays[3,5–7,9,10]Consequently, the national Belgian authorities have planned a major validation campaign to assess the performance of these new-launched serological tests. The aim of this study was to evaluate the analytical and clinical performance of the iFlash® SARS-CoV-2 antibodies (IgM and IgG) chemiluminescence assay (CLIA).
2. Material and methods
2.1. Study design
This retrospective study has been conducted from May 15 to 30, 2020 at the clinical biology laboratory of the Saint Nikolaus Hospital (Eupen, Belgium). A total of 178 serum samples coming from two hospitals (the Saint Nikolaus Hospital (Eupen, Belgium; n = 66), and Clinique St-Luc Bouge, Namur, Belgium; n = 112) were obtained from 154 patients confirmed positive to SARS-CoV-2 by RT-PCR and with COVID-19 symptoms. Antibody kinetics since the onset of symptoms was evaluated in the full cohort of patients for which the information on the onset of symptoms was available.
2.2. Sample collection
Blood samples collected from patients into serum tubes (BD Vacutainer® 3.5 or 8.5 mL tubes, Becton Dickinson, New Jersey, USA), K2EDTA tubes (BD Vacutainer® 4 mL tubes), or lithium-heparin plasma tubes (BD Vacutainer® 4.0 mL tubes) according to standardized oper-ating procedure and manufacturer’s recommendations. Blood sampling was performed according to the recent guidelines[11]. Two hundred thirty-five sera of patients taken during previous clinical requests for diagnostic purposes were collected from March 21 to May 30, 2020 and stored in the laboratory serum biobank at −20 °C. Frozen samples were thawed one hour at room temperature on the day of the analysis. Re-thawed samples were vortexed before the analysis.
2.3. Analytical procedure
The iFlash® anti-SARS-CoV-2 (YHLO biotechnology co., LTD, Shenzhen, China) is a chemiluminescent assay (CLIA) for the in vitro quantitative detection of IgM and IgG against the SARS-CoV-2 spike protein (S) and the nucleocapsid protein (N) in human serum and plasma. The analyzer converts a relative light unit (i.e. RLU) into an antibody titer (i.e. AU/mL) through a two-points calibration curve. According to the manufacturer, a titer ≥10 AU/mL is considered po-sitive (or reactive) for both IgM and IgG[12]. The RT-PCR for SARS-CoV-2 determination in respiratory samples (nasopharyngeal swab samples) was performed on the cobas® SARS-CoV-2 E-gene assay and ORF1ab-gene assay (Roche Diagnostics®).
2.4. Assessment of analytical performance 2.4.1. Precision
Precision was evaluated by using two QC levels and three pools of human serum. Precision estimations were obtained by means of tripli-cates measurements of aliquots for a total of 5 consecutive days. Repeatability (expressed as intra-run CV, %) and reproducibility (ex-pressed as inter-run CV, %) of the method was calculated. Aliquots were
stored at −20 °C between analysis. Calculation was performed ac-cording to the Clinical and Laboratory Standards Institute (CLSI) EP15-A3 protocol[13].
2.4.2. Limit of detection and quantification
The diluent provided by the manufacturer was used as blank sample to determine the limit of blank (LOB), detection (LOD) and quantifi-cation (LOQ).
The LOB has been determined by running the blank sample on three separate occasion to verify that the results are well < 10 AU/mL. The LOD and LOQ have been determined by running 30 analyses of the blank sample using the following equations according the SH GTA 04 document – revision 1 of the COFRAC[14].
- LOD = mean of the 30 measurements + 3*standard deviation - LOQ = mean of the 30 measurements + 10*standard deviation
2.4.3. Linearity assessment
Linearity was evaluated according to CLSI EP-06. A sample with a high total antibody levels (i.e. for IgM: 334.64 AU/mL; for IgG: 71.57 AU/mL) was analyzed and diluted by a factor 2 on 5 consecutive dilutions. The manufacturer’s diluent was used for the dilution. Observed values were compared to the expected ones and polynomial regression was calculated.
2.4.4. Evaluation of the carry-over
A sample with high total antibody levels (i.e. for IgM: 124.02; for IgG: 125.67) was analyzed in triplicate (A1, A2, A3) and followed by a negative sample (i.e. for IgM: 0.49; for IgG: 0.35) also analyzed in tri-plicate (B1, B2, B3). The carry-over is calculated using this following equation: (B1–B3)/(A3–B3) × 100. A carry-over below 1% is con-sidered satisfactory.
2.5. Evaluation of the clinical performance of the iFlash® SARS-CoV-2 IgM and IgG
2.5.1. Assessment of the clinical specificity
Non-SARS-CoV-2 sera (n = 75) were analyzed for determining the cross-reactivity. Thirty-eight sera from COVID-19 negative healthy subjects and 37 sera from patients with a potential cross-reaction to the SARS-CoV-2 immunoassay were included in this study. Potential cross-reactive samples included positive HBsAg (n = 3), IgM CMV (n = 8), IgM parvovirus B19 (n = 1), anti-Treponema pallidum antibody (n = 1), IgM Borrelia + IgA Helicobacter pylori (n = 1), urinary infection with
Escherichia coli (n = 1), urinary infection with Klebsiella oxytoca
(n = 1), IgM Mycoplasma pneumoniae (n = 1), IgA Chlamydia
pneu-moniae (n = 1), IgG Chlamydia trachomatis (n = 1) and IgM Toxoplasma gondii (n = 6), direct coombs (n = 1), rheumatoid factor (n = 1),
RAI + (search for irregular agglutinins) (n = 4), anti-TPO antibodies (n = 1), high level of total IgG (17.40 g/L) (normal range: 7.00–16.00 g/L) (n = 1), high level of total IgM (5.26 g/L)and high level of total IgG (28.67 g/L) (n = 1). All of these samples were col-lected before the COVID-19 pandemic and were stored at −20 °C.
2.5.2. Assessment of the clinical sensibility
One hundred and seventy-eight sera obtained from 154 COVID-19 patients were used to calculate the clinical sensitivity. The immune status of each false negative patients was checked and none was im-munocompromised.
Samples were subdivided according to different categories since symptom onset as follow: 0–6 days: 45 sera; 7–13 days: 35 sera; 14–20 days: 37 sera; 21–27 days: 29 sera; 28 days or more: 32 sera. Clinical sensitivity for SARS-Cov-2 serological test depending on the onset of COVID-19 symptoms was carried out with the manufacturer's cut-off (> 10 AU/mL for both IgM and IgG) and with ROC curve adapted cut-offs (2.81 AU/mL for IgM; 4.86 AU/mL for IgG).
A. Mairesse, et al. Clinical Biochemistry xxx (xxxx) xxx–xxx
2.5.3. Evaluation of antibody kinetics since symptom onset
Antibody kinetics since symptom onset was evaluated using the following time frames (d, days): 0–2 d, 3–5 d, 6–8 d, 9–11 d, 12–14 d, 15–17 d, 18–20 d, 21–23 d, 24–30 d, 31–40 d, 41–62 d. The mean titer results (and standard deviations) were plotted against the different time frames. Smoothing splines with four knots were used to estimate the time kinetics curve.
2.6. Statistical analysis
Descriptive statistics were used to analyze the data. Sensitivity was defined as the proportion of correctly identified COVID-19 positive patients since symptom onset. Specificity was defined as the proportion of naïve patients or healthy volunteers classified as negative. The ROC area under the curve (AUC) was calculated as the fraction of true po-sitive and false popo-sitive determined according to the manufacturer's cut-off values for positive results. Samples included for ROC curves analyses were sera obtained from at least two weeks after symptoms onset (n = 98), sera selected to assess cross-reactivity (n = 37) and sera from healthy volunteers (n = 38). Data analysis was performed using XLSTAT® software (version 2019.2.2, Addinsoft, Paris, France). P value < 0.05 was used as a significance level. Our study fulfilled the Ethical principles provided by the Declaration of Helsinki.
3. Results
3.1. Analytical performance 3.1.1. Precision
Repeatability and reproducibility results are summarized inTable 1. Repeatability and reproducibility were ≤7.5% and ≤13.3%, respec-tively.
3.1.2. Limits of detection and quantification
The limit of blank, detection and quantification were 0.15 AU/mL and 0.035 AU/mL; 0.242 AU/mL and 0.441 for IgM; 0.052 AU/mL and 0.097 AU/mL for IgG, respectively.
3.1.3. Linearity
Linearity data for anti-SARS-CoV-2 IgM and IgG are summarized in
Supplementary Fig. 1. The regression equation was for IgM was: Y = 6.0 + 0.98x with a correlation coefficient (R2) of 0.995. The re-gression equation was for IgG was: Y = −0.45 + 0.46x + 0.008x2 with a correlation coefficient (R2) of 0.988.
3.1.4. Carry-over
The following values have been obtained for the different samples and the different runs for IgM and IgG: A1 = 124.0 AU/mL, A2 = 112.15 AU/mL, A3 = 117.96 AU/mL, B1 = 0.49 AU/mL, B2 = 0.49 AU/mL and B3 = 0.51 AU/mL and A1 = 125.67 AU/mL,
A2 = 123.46 AU/mL, A3 = 125.93 AU/mL, B1 = 0.35 AU/mL, B2 = 0.32 AU/mL and B3 = 0.34 AU/mL respectively. The calculated carry-over was −0.0017% and 0.0079%, respectively.
3.2. Evaluation of the clinical performance 3.2.1. Assessment of specificity
The calculated specificity was 98.7% (95% CI: 92.0–100%) for IgM and 100% (95% CI: 94.0–100%) for IgG by using the manufacturer’s cut-off (i.e. ≥10 AU/mL). Using optimized cut-off, specificity was 94.7% (95% CI: 86.6–98.2%) for IgM and 100% for IgG (95% CI: 94.0–100%) (Table 2andSupplementary Figs. 2 & 3).
3.2.2. Assessment of sensibility
Sensitivities for IgM and IgG according to different time categories since symptom onset are represented inTable 2. Before 14 days since symptom onset, sensitivities were not sufficient to be reliable in clinical practice. After 2 weeks since symptom onset, the sensitivity for IgM was 62.2% (95% CI: 52.3–71.2%) and was 92.9%% (95% CI: 85.7–96.7%) for IgG by using the cut-off provided by the manufacturer. Using the optimized cut-off, the sensibility for IgM and for IgG (i.e. > 2.81 for IgM and > 4.86 for IgG) were 81.6 (95% CI: 72.7–88.1%) and 95.9% (95% CI: 89.4–98.7%), respectively. From 28 days since symptoms onset, the sensitivity for IgG increased to 100% by using the optimized cut-off (Table 2andSupplementary Figs. 2 & 3).
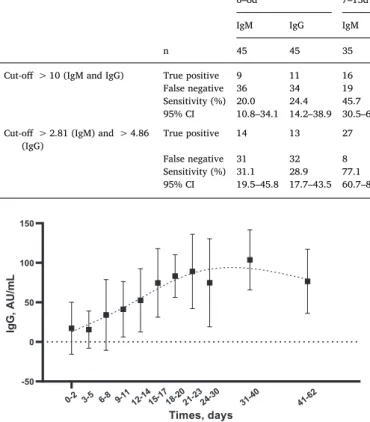
3.2.3. Antibody kinetics
TheFig. 1shows the IgG kinetics at different days from symptom onset. The IgG kinetics gradually increased from day 0 to day 62, to achieve highest IgG concentrations between days 31 and 40. The IgM kinetics increased from day 0 to day 17 and then gradually decrease from day 18 to day 62. Standard deviations of the mean for IgM were very large arguing for a higher inter-individual variation compared to IgG.
4. Discussion
Serological testing is a useful strategy for the diagnosis, the char-acterization of the course of the disease, for identifying convalescent plasma donors as well as for epidemiological study, lockdown exit programs and COVID-19 vaccine development[5,6,8,16]. Being rapidly developed and flooding the market, these tests need to be evaluated both in terms of analytical and clinical performance[6,7,9,15]. The aims of the present study were to evaluate the analytical and clinical performance of the iFlash® anti-SARS-CoV-2 CLIA assay for IgM and IgG antibodies with a large cohort of COVID-19 patients, to provide an external validation of this test and to evaluate the antibody kinetics since symptom onset.
Repeatability and reproducibility studies had CVs below 7.5% and 11.9% for IgM, and below 5.8% and 13.3% for IgG. Near the optimized cut-offs, CVs for repeatability and reproducibility were 1.1% and 5.7% for IgM, and 1.8% and 2.9% for IgG. These results are consistent with those published recently[16]. The carry-over was negligible for IgM and IgG antibodies (< 0.01%). We found a LOQ of 0.441 AU/mL for IgM and 0.097 AU/mL for IgG, which is below the value we found for the optimized cut-offs (i.e. IgM: 2.81 AU/mL and IgG: 4.86 AU/mL). The linearity of the dilutions has been performed in order to assess the ability of the method to provide direct results proportional to the concentration of IgM and IgG in the test product samples. The results obtained showed excellent linearity from ± 330 AU/mL to ± 5 AU/mL for IgM and from ± 70 AU/mL to ± 2 AU/mL for IgG. Linearity appears poor at the highest values for IgG as already described on another platform (data not shown)[17].
A total of 253 sera were included to evaluate the clinical perfor-mance of the assay in our study. Compared to other studies having evaluated the iFlash® SARS-CoV-2 assay[16,18], our study included the
Table 1
Mean (AU/mL), repeatability (CV %) and reproducibility (CV %) assessed on three patient pool and two QC levels.
Mean (AU/mL) Repetability, CV (%) Reproductibility, CV (%)
IgM Pool 1 0.80 4.5 11.6 Pool 2 2.87 1.1 5.7 Pool 3 69.91 1.7 4.6 QC 1 0.21 7.5 11.9 QC 2 22.90 2.9 4.6 IgG Pool 1 0.63 1.9 5.6 Pool 2 5.46 1.8 2.9 Pool 3 71.51 1.1 6.7 QC 1 0.07 5.8 13.3 QC 2 16.20 2.1 3.4
highest number of COVID-19 patients (n = 154). Infantino et al. and Plebani et al. included 61 and 64 COVID-19 patients, respectively
[16,18]. Considering the specificity of the assay, we only reported one false positive IgM result (i.e. serum with high level of total IgM (5.26 g/ L) and high level of total IgG (28.67 g/L). No false positive IgG result was encountered even in this sample with a high titer of IgG, suggesting that the specificity of the YLHO platform is higher for IgG than IgM. False positive IgM results (> 10.0 AU/mL) with two samples from CMV infected patients and two samples from patients with rheumatic dis-eases have been described by Infantino et al.[18]. In pre-COVID-19 donors and auto-immune patients, Plebani et al. found 4 false positive IgM results (> 10.0 AU/mL), but not for IgG[16]. These were in line with our observations. The sensitivity of the iFlash® SARS-CoV-2 assay was also evaluated in samples collected at various times since symptom onset. In our investigation the sensitivity of the test for IgG increased progressively to reach a sensitivity of 100% (95%CI: 87.6–100%) after 28 days by using an optimized cut-off (i.e. > 4.86 AU/mL). Using the optimized cut-off (i.e. > 2.81 AU/mL), the IgM sensitivity reached its higher level (86.5%) between 14 and 20 days since symptom onset. Nevertheless, it remained globally of less clinical interest compared to IgG. The high sensitivity observed with the iFlash® SARS-CoV-2 assay may be explained by its capacity to recognize both the antibodies di-rected against the spike proteins and the nucleocapside.
Using ROC curve adapted cut-offs (10.0 AU/mL for IgM and 7.1 AU/ mL for IgG), Infantino et al. found sensitivities and specificities of 73.3% and 92.2%, and of 83.3% and 100%, for IgM and IgG, respectively[18]. However, authors only included 61 COVID-19 patients, did not sub-divide patients according to days from symptom onset, and selected patients with a short timeframe inclusion, i.e. from 8 to 17 days only. In our study, we found that the sensitivity increased with time from
symptom onset to reach its higher level from 28 days. The suboptimal sensitivities they observed is highly due to a selection bias. Plebani et al. only included samples collected after 11 days from the onset of symp-toms, with a mean time interval from symptom of 24 days (standard deviation ± 11 days; range 12–54 days)[16]. They did not categorized patients according to days from symptom onset, and only included a limited number of COVID-19 patients, i.e. 64 SARS-CoV-2 patients. In this study, the use of a redefined cut-off slightly increases the sensitivity of the assay, from 92.9% to 95.9%.
Existing data support that seroconversion occurs approximately 7 to 14 days after the onset of symptoms[8,19–22]. In our study, the ki-netics of IgM and IgG was evaluated during a long-term period (2 months) at regular time intervals (every 3 days) and on a significant cohort. Anti-SARS-CoV-2 IgG antibodies gradually increased since the onset of COVID-19 symptoms to achieve a 100% sensitivity from days 28 (Table 2). After 28 days, we observed a plateau phase and we can assume aslight decrease in IgG levels. This finding is in accordance with recently published data[23]. Further designed long term studies are needed to evaluate IgG kinetics and especially the persistence of po-tentially neutralizing antibodies. Recently there has been some concern about antibody kinetics and the persistence of these antibodies espe-cially in asymptomatic patients. They could only be present for 2 to 3 months[24]. In this present study we only had patients with symp-toms for 2 months maximum.
Before days 14, the improved sensitivity observed when using the optimized cut-off for IgM compared to IgG was only modest (Table 2). Padoan et al. have also studied the kinetics of IgM and IgG on a smaller cohort (i.e. on 37 COVID-19 patients) and observed a 100% sensitivity for IgG 12 days after the onset of symptoms while a lower sensitivity (88%) was reported for IgM[25], and further confirmed in another study[26]. Our investigation confirms the suboptimal sensitivities re-ported for IgM on a larger study population and using another analyzer strengthening the hypothesis that IgM measurement may be less re-levant for assessing the seroprevalence in previously exposed patients. In conclusion, this study shows that the iFlash® SARS-CoV-2 assay from YHLO biotechnology, has satisfactory analytical performance. The determination of anti-SARS-CoV-2 IgG antibodies from 28 days since symptom onset was associated to high sensitivity, especially using an optimized cut-off, which strengthens the strategy of cut-off optimiza-tion for these SARS-CoV-2 serological assays.
Declaration of Competing Interest
The authors declare that they have no known competing financial interests or personal relationships that could have appeared to influ-ence the work reported in this paper.
Table 2
Clinical performance of iFlash® CLIA analyzer for anti-SARS CoV-2 IgM and IgG since symptom onset with the manufacturer’s cut-off and with optimized cut-offs.
0–6d 7–13d 14–20d 21–27d ≥28d
IgM IgG IgM IgG IgM IgG IgM IgG IgM IgG
n 45 45 35 35 37 37 29 29 32 32
Cut-off > 10 (IgM and IgG) True positive 9 11 16 24 30 33 14 27 17 31
False negative 36 34 19 11 7 4 15 2 15 1
Sensitivity (%) 20.0 24.4 45.7 68.6 81.1 89.2 48.3 93.1 43.8 97.1
95% CI 10.8–34.1 14.2–38.9 30.5–61.8 51.9–81.5 65.4–90.7 74.5–96.2 31.4–65.5 76.7–99.0 28.2–60.7 83.5–99.9 Cut-off > 2.81 (IgM) and > 4.86
(IgG) True positive 14 13 27 25 32 34 22 27 26 32
False negative 31 32 8 10 5 3 7 2 6 0 Sensitivity (%) 31.1 28.9 77.1 71.4 86.5 91.9 75.9 93.1 81.3 100 95% CI 19.5–45.8 17.7–43.5 60.7–88.1 54.7–83.7 71.4–94.4 77.8–97.8 57.5–87.9 76.7–99.0 64.2–91.4 87.6–100 -50 0 50 100 150 Times, days Ig G ,A U/ m L 0-2 3-5 6-8 9-1112-1415-1718-2021-2324-30 31-40 41-62
Fig. 1. Anti-SARS-CoV-2 IgG antibodies kinetics at different days from the onset of COVID-19 symptoms (179 patients). Mean (AU/mL) and SD are plotted. Smoothing splines with four knots were used to estimate the time kinetics curve.
A. Mairesse, et al. Clinical Biochemistry xxx (xxxx) xxx–xxx
Appendix A. Supplementary data
Supplementary data to this article can be found online athttps:// doi.org/10.1016/j.clinbiochem.2020.08.009.
References
[1] World Health Organization. Coronavirus disease 2019 (COVID-19) - Weekly Epidemiological Update - 23 August 2020.
[2] A.S. Fauci, H.C. Lane, R.R. Redfield, Covid-19 – Navigating the Uncharted, N. Engl. J. Med. 382(13) (2020) 1268–9. PubMed PMID: 32109011. Pubmed Central PMCID: PMC7121221. Epub 2020/02/29.
[3] S.K. Vashist, In vitro diagnostic assays for COVID-19: recent advances and emerging trends, Diagnostics (Basel, Switzerland) 10(4) (2020). PubMed PMID: 32260471. Pubmed Central PMCID: PMC7235801. Epub 2020/04/09. eng.
[4] G. Lippi, A.M. Simundic, M. Plebani, Potential preanalytical and analytical vul-nerabilities in the laboratory diagnosis of coronavirus disease 2019 (COVID-19), Clin. Chem. Lab. Med.: CCLM/FESCC 1 (2020). (ahead-of-print). PubMed PMID: 32172228. Epub 2020/03/17.
[5] A.K. Winter, S.T. Hegde, The important role of serology for COVID-19 control. Lancet Infect Dis. (2020). PubMed PMID: 32330441. Pubmed Central PMCID: PMC7173803. Epub 2020/04/25.
[6] M.K. Bohn, G. Lippi, A. Horvath, S. Sethi, D. Koch, M. Ferrari, et al., Molecular, serological, and biochemical diagnosis and monitoring of COVID-19: IFCC taskforce evaluation of the latest evidence, Clin. Chem. Lab. Med. CCLM/FESCC (2020). PubMed PMID: 32459192. Epub 2020/05/28.
[7] C.W. Farnsworth, N.W. Anderson, SARS-CoV-2 Serology: much hype, little data, Clin. Chem. (2020). PubMed PMID: 32343775. Pubmed Central PMCID: PMC7197624. Epub 2020/04/29.
[8] Q.X. Long, B.Z. Liu, H.J. Deng, G.C. Wu, K. Deng, Y.K. Chen, et al., Antibody re-sponses to SARS-CoV-2 in patients with COVID-19, Nat. Med. (2020). PubMed PMID: 32350462. Epub 2020/05/01.
[9] P. Diamandis, I. Prassas, E.P. Diamandis, Antibody tests for COVID-19: drawing attention to the importance of analytical specificity, Clin. Chem. Lab. Med.: CCLM/ FESCC (2020). PubMed PMID: 32386187. Epub 2020/05/10. eng.
[10] M. Tre-Hardy, A. Wilmet, I. Beukinga, J.M. Dogne, J. Douxfils, L. Blairon, Validation of a chemiluminescent assay for specific SARS-CoV-2 antibody, Clin. Chem. Lab. Med.: CCLM/FESCC 1 (2020)1 (ahead-of-print). PubMed PMID: 32447328. Epub 2020/05/25.
[11] A.M. Simundic, K. Bolenius, J. Cadamuro, S. Church, M.P. Cornes, E.C. van Dongen-Lases, et al., Joint EFLM-COLABIOCLI Recommendation for venous blood sampling, Clin. Chem. Lab. Med.: CCLM/FESCC 56(12) (2018) 2015–2038. PubMed PMID: 30004902. Epub 2018/07/14.
[12] iFlash Anti-SARS-CoV-2 (2019-nCoV IgG) [insert sheet REF C86095G, 2020-03, V 3. 0]. iFlash 2020.
[13] Clinical and Laboratory Standards Institute. EP15A3 — User verification of preci-sion and estimation of bias; approved guideline. Clinical and Laboratory Standards Institute, 2014.
[14] Cofrac, Guide Technique d’Accréditation de Vérification (Portée A)/Validation (Portée B) des Méthodes en Biologie Médicale - Document SH GTA 04 (révision 01), 2015.
[15] R.D. Kirkcaldy, B.A. King, J.T. Brooks, COVID-19 and Postinfection immunity: limited evidence, many remaining questions, JAMA (2020). PubMed PMID: 32391855. Epub 2020/05/12.
[16] M. Plebani, A. Padoan, D. Negrini, B. Carpinteri, L. Sciacovelli, Diagnostic perfor-mances and thresholds: the key to harmonization in serological SARS-CoV-2 assays? Clin. Chim. Acta; Int. J. Clin. Chem. (2020). PubMed PMID: 32485157. Pubmed Central PMCID: PMC7261100. Epub 2020/06/03.
[17] A. Padoan, C. Cosma, L. Sciacovelli, D. Faggian, M. Plebani, Analytical perfor-mances of a chemiluminescence immunoassay for SARS-CoV-2 IgM/IgG and anti-body kinetics, Clin. Chem. Lab. Med.: CCLM/FESCC (2020) (ahead-of-print). PubMed PMID: 32301749. Epub 2020/04/18.
[18] M. Infantino, V. Grossi, B. Lari, R. Bambi, A. Perri, M. Manneschi, et al., Diagnostic accuracy of an automated chemiluminescent immunoassay for anti-SARS-CoV-2 IgM and IgG antibodies: an Italian experience, J. Med. Virol. (2020). PubMed PMID: 32330291. Epub 2020/04/25.
[19] M.K. Bohn, G. Lippi, A. Horvath, S. Sethi, D. Koch, M. Ferrari, et al., Molecular, serological, and biochemical diagnosis and monitoring of COVID-19: IFCC taskforce evaluation of the latest evidence, Clin. Chem. Lab. Med.: CCLM/FESCC. (2020) 20200722. PubMed PMID: 32459192. Epub 2020/05/28. English.
[20] N.M.A. Okba, M.A. Muller, W. Li, C. Wang, C.H. GeurtsvanKessel, V.M. Corman, et al., Severe acute respiratory syndrome coronavirus 2-specific antibody responses in coronavirus disease 2019 patients, Emerg. Infect. Dis. 26(7) (2020). PubMed PMID: 322672Epub 2020/04/09. eng.
[21] J. Favresse, C. Eucher, M. Elsen, T.H. Marie, J.M. Dogne, J. Douxfils, Clinical per-formance of the Elecsys electrochemiluminescent immunoassay for the detection of SARS-CoV-2 total antibodies, Clin. Chem. (2020). PubMed PMID: 32484887. Epub 2020/06/03.
[22] M. Tre-Hardy, L. Blairon, A. Wilmet, I. Beukinga, H. Malonne, J.M. Dogne, et al., The role of serology for COVID-19 control: population, kinetics and test perfor-mance do matter, J. Infect. (2020). PubMed PMID: 32417311. Pubmed Central PMCID: PMC7228733. Epub 2020/05/18.
[23] J. Favresse, C. Eucher, M. Elsen, K. Laffineur, J. Dogné, J. Douxfils, Response of anti-SARS-CoV-2 total antibodies to nucleocapsid antigen in COVID-19 patients: a longitudinal study, Clin. Chem. Lab. Med. (CCLM) (2020) (published online ahead of print), 000010151520200962.https://doi.org/10.1515/cclm-2020-0962. [24] Q.-X. Long, X.-J. Tang, Q.-L. Shi, Q. Li, H.-J. Deng, J. Yuan, A.-L. Huang, Clinical
and immunological assessment of asymptomatic SARS-CoV-2 infections, Nat. Med. (2020),https://doi.org/10.1038/s41591-020-0965-6.
[25] A. Padoan, C. Cosma, L. Sciacovelli, D. Faggian, M. Plebani, Analytical perfor-mances of a chemiluminescence immunoassay for SARS-CoV-2 IgM/IgG and anti-body kinetics, Clin. Chem. Lab. Med.: CCLM/FESCC (2020). PubMed PMID: 32301749. Epub 2020/04/18.
[26] I. Montesinos, D. Gruson, B. Kabamba, H. Dahma, S. Van den Wijngaert, S. Reza, et al., Evaluation of two automated and three rapid lateral flow immunoassays for the detection of anti-SARS-CoV-2 antibodies, J. Clin. Virol. 128 (2020) 104413. PubMed PMID: 32403010. Pubmed Central PMCID: PMC7198434. Epub 2020/ 05/14.