Publisher’s version / Version de l'éditeur:
Journal of Physics B, 41, pp. 245602-1-245602-7, 2008-12-01
READ THESE TERMS AND CONDITIONS CAREFULLY BEFORE USING THIS WEBSITE. https://nrc-publications.canada.ca/eng/copyright
Vous avez des questions? Nous pouvons vous aider. Pour communiquer directement avec un auteur, consultez la première page de la revue dans laquelle son article a été publié afin de trouver ses coordonnées. Si vous n’arrivez pas à les repérer, communiquez avec nous à [email protected].
Questions? Contact the NRC Publications Archive team at
[email protected]. If you wish to email the authors directly, please see the first page of the publication for their contact information.
NRC Publications Archive
Archives des publications du CNRC
This publication could be one of several versions: author’s original, accepted manuscript or the publisher’s version. / La version de cette publication peut être l’une des suivantes : la version prépublication de l’auteur, la version acceptée du manuscrit ou la version de l’éditeur.
For the publisher’s version, please access the DOI link below./ Pour consulter la version de l’éditeur, utilisez le lien DOI ci-dessous.
https://doi.org/10.1088/0953-4075/41/24/245602
Access and use of this website and the material on it are subject to the Terms and Conditions set forth at
High harmonic generation with a spatially filtered optical parametric
amplifier
Bandulet, H.-C.; Comtois, D.; Shiner, A. D.; Trallero-Herrero, C.; Kajumba,
N.; Ozaki, T.; Corkum, P. B.; Villeneuve, D. M.; Kieffer, J.-C.; L´egar´e, F.
https://publications-cnrc.canada.ca/fra/droits
L’accès à ce site Web et l’utilisation de son contenu sont assujettis aux conditions présentées dans le site LISEZ CES CONDITIONS ATTENTIVEMENT AVANT D’UTILISER CE SITE WEB.
NRC Publications Record / Notice d'Archives des publications de CNRC:
https://nrc-publications.canada.ca/eng/view/object/?id=632cf865-1c96-4a53-826e-4a9052ab9ce1 https://publications-cnrc.canada.ca/fra/voir/objet/?id=632cf865-1c96-4a53-826e-4a9052ab9ce11Institut National de la Recherche Scientifique—Centre ´Energie Mat´eriaux et T´el´ecommunications,
1650 Boulevard Lionel-Boulet, Varennes, J3X 1S2, Canada
2National Research Council of Canada, 100 Sussex Drive, Ottawa, K1A 0R6, Canada
E-mail:[email protected]@emt.inrs.ca
Received 9 September 2008, in final form 3 November 2008 Published 2 December 2008
Online atstacks.iop.org/JPhysB/41/245602
Abstract
Numerous applications of high harmonic generation (HHG), such as attosecond pulse
synthesis, depend on the ability to increase the electron recollision energy, which is a quadratic function of the driver wavelength. High-energy infrared pulses obtained from an optical parametric amplifier (OPA) are thus attractive for driving the HHG process, thereby offering the opportunity to yield shorter attosecond pulses. However, the increase in driver wavelength is often outweighed by the poor spatial quality of the OPA source. In this paper, we
demonstrate that HHG using OPA signal pulses is significantly improved by spatial filtering in a hollow-core fibre prior to focusing in the gas target in comparison with the unfiltered case. Ion yield measurements in combination with beam profile monitoring in the far field enabled control over the interaction volume. For similar interaction volumes, we observe that with less than half the energy per pulse, the HHG yield can increase by one order of magnitude with spatial filtering. The comparison between the harmonic yields in argon and krypton, and their respective dependence on the peak laser intensity, provide experimental evidence that strongly suggests that the enhancement is due to improved phase matching.
(Some figures in this article are in colour only in the electronic version)
1. Introduction
High harmonic generation (HHG) from atoms driven by intense femtosecond lasers is recognized as the key approach for the production of coherent XUV pulses of attosecond duration [1, 2]. During the last decade, there have been considerable advances in the technology to generate and to characterize attosecond laser pulses [3–6]. Currently, the shortest duration for an isolated attosecond pulse is 80 as [7]. Since the minimum pulse duration is limited by the spectral bandwidth, higher-order harmonics are necessary to further decrease the duration of attosecond pulses [8].
According to the three step model for HHG [9], the cutoff energy of the harmonic spectrum is given by Ip + 3.17Up,
where Ipis the ionization potential of the atom and Up ∝ I λ2 is the laser ponderomotive energy, which is proportional to the laser intensity I and the square of its wavelength λ. Since the
laser intensity needs to be kept low to avoid depletion of neutral atoms [2], one therefore needs to increase the wavelength of the driving laser field into the infrared spectral region in order to extend the cutoff energy, as well as to produce harmonics in noble gas that have preferably large ionization potentials, such as neon and helium.
High-energy infrared pulses, such as those obtained from an optical parametric amplifier (OPA) seeded by a Ti:sapphire laser, are thus attractive for driving the HHG process [10–13]. The extended cutoff that can be obtained using such an infrared driver laser will thereby offer the opportunity to generate shorter attosecond pulses and at the same time extend their applicability as short-wavelength XUV sources, provided that its degree of coherence is high. On the other hand, the increase of the driver wavelength inherently leads to a drop in the conversion efficiency of the HHG process—expected to scale as ∝λ−5 for the single-atom response [14]—
J. Phys. B: At. Mol. Opt. Phys. 41 (2008) 245602 H-C Bandulet et al
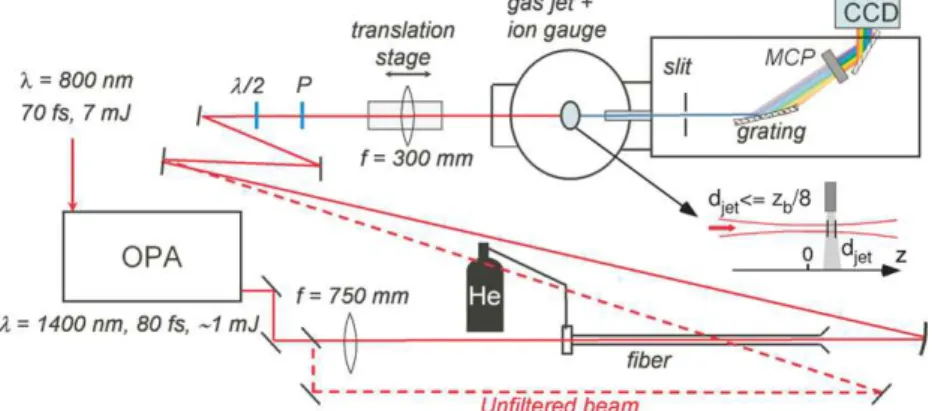
Figure 1. Experimental layout showing the optical parametric amplifier, the hollow-core fibre and the high harmonic source, and
spectrometer chambers. djetand zbare the diameter of the gas jet and confocal parameter, respectively.
which reduces the brightness of the harmonic emission. Moreover, the poor spatial quality of most available OPA sources, especially those which are seeded by parametric superfluorescence [15], can further worsen the conversion efficiency of the process to a point that outweighs the original benefit of the extended cutoff. This is in addition to the fact that the XUV beam will inherit the quality of the pump beam, which in many cases may ruin its potential as a coherent XUV source [16,17]. Therefore, methods aimed at improving the quality of the OPA beams are necessary to take full advantage of the increase of the driver wavelength.
In this paper, we demonstrate that it is essential to spatially filter the OPA beam to maximize the efficiency of the high-order harmonic generation process. We compare the HHG produced in krypton and argon using the signal output of an OPA that is filtered through a hollow-core fibre, with those for the unfiltered case. Near- and far-field images of the two beams show that the inhomogeneities in the OPA intensity distribution are smoothed with filtering. In parallel to recording the spectra, we also monitor the number of ions produced in the gas using a fast ionization gauge, which gives an indication of the number of emitters participating in the detected harmonic field. For the same laser intensity and beam diameter at focus, we observe similar ionization probabilities but the HHG yield can be an order of magnitude larger for the spatially filtered beam. The different behaviours between the two considered gases with increasing laser fluences are also investigated and provide strong evidence that the observed enhancement in the harmonic yield is the result of better phase matching.
2. Experimental details
The experiment was conducted at the advanced laser light source (ALLS) using the 100 Hz, 100 mJ, 25 fs, Ti:sapphire laser system. A schematic of the experiment is shown in figure 1. Laser pulses of 7 mJ at 800 nm were directed to an optical parametric amplifier (TOPAS-HE from light conversion) and frequency shifted to 1400 nm signal pulses. The seed pulse of this OPA system is produced via parametric superfluorescence and suffers from a poor spatial mode quality. The pulse energy and temporal duration were measured to be about 1.3 mJ and 80 fs, respectively. Spatial filtering was
performed using a hollow-core fibre (400 µm in diameter, 100 cm long) attached at one end to a closed gas cell and supported on an aluminium V-groove [18].
Since the intent was to use the fibre to spatially filter the beam but not to change the pulse duration, the fibre was filled with helium gas to avoid self-phase modulation. Helium gas flowed through the fibre from the cell at 1.2 atm of pressure and leaked into air at the exit. We verified that the input and output spectra remained identical. The OPA signal beam was focused with an f = 750 mm plano-convex lens into the fibre in order to favour the coupling into the fundamental EH11spatial mode,
which has the highest transmissivity and whose spatial profile is a zeroth-order Bessel function of the first kind [19–21]. At the output, the laser beam was collimated with an f = 300 mm concave silver mirror. At 800 nm, typical transmission through a 100 cm length hollow-core fibre ranges in between 50 and 60% [22,23]. However, due to the low quality of the mode at 1400 nm, the transmission efficiency was nearer 30%.
The filtered and unfiltered beams were focused by an f = 300 mm broadband antireflection-coated lens mounted on a motorized translation stage into a thin pulsed gas jet with a 500 µm aperture backed with a pressure of 3 atm of either argon or krypton. The jet is mounted on a three-axis manipulator for adjustment of its position. The laser energy could be continuously varied using a half-waveplate followed by a Glan-calcite polarizer. We have verified that reabsorption by the gas was not a limiting factor in this experiment as the harmonic yield showed a quadratic dependence as a function of gas backing pressure for pressures below 3.5 atm [27]. The position of the laser focus relative to the centre of the jet was determined using the signal of an ion detector, consisting of a wire biased at −20 V, a high-frequency decoupling circuit and an amplifier connected to a digital oscilloscope, which was held a few inches below the gas nozzle. The ion yield was monitored in parallel with the harmonic radiation throughout the experiment. The harmonic emission, collimated in the direction of the laser beam, entered a flat-field XUV spectrometer chamber through a 3 mm pinhole. The light incident on the 500 µm wide slit of the spectrometer was dispersed by a variable groove density concave grating (Hitachi) and imaged onto a chevron micro-channel plate (MCP) sensitive to wavelengths below 100 nm.
Figure 2. Far- and near-field intensity distributions of the spatially
filtered ((b) and (e)) and unfiltered beams ((a) and (d)) that were recorded with an infrared vidicon camera. Axes are equal; (c) Normalized lineouts along the dashed lines in (a) and (b). (f) Lineouts along the dashed lines in (d) and (e).
A phosphor readout screen coupled to the MCP converted the amplified signal to visible light that was then imaged onto a 14-bit CCD camera placed outside the chamber. The gas jet and CCD camera were synchronized to the laser at a repetition rate of 7 Hz, and the ion detector at a rate of 100 Hz.
Near- and far-field intensity distributions of the spatially filtered and unfiltered beams were recorded with an infrared vidicon camera (Hamamatsu model C2741-03 ER) and are shown in figure2. To record far-field beam profiles, the beam was focused by the 300 mm lens into a 20× microscope objective mounted on the camera. The maximum beam intensity did not exceed the saturation level of the sensor when both near- and far-field beam distributions were captured with the camera. The near-field intensity distributions were recorded by sending the collimated beams directly into the camera after 5 m of free propagation in air. One can see from figures 2(d) and (e) that the energy in the unfiltered beam is non-uniformly distributed as compared to the smooth Bessel profile of the filtered beam. It is reasonable to expect that the unfiltered beam will present equally important phase variations. In addition, we observe that the spatial power distribution in the near-field pattern of the unfiltered beam varies considerably with propagation distance contrarily to the beam from the output of the fibre, indicating wavefront distortion. Wavefront inhomogeneities in amplitude and phase are known to translate into phase mismatch between adjacent portions of the interaction volume across the diameter of the beam [16].
The diameter of the filtered beam at the focusing lens was set by the position of the collimating concave silver mirror in order to match the FWHM of the central portion of the unfiltered beam’s focal spot, as shown in figure2(c). The far-field patterns are very similar except that a small fraction of the total energy is spread in a halo about the central focal spot in the unfiltered case. The power contained within the FWHM radius is ∼40% and ∼58% of the total power for the unfiltered
diameter of the jet at the beam focus to be less than 1 mm by monitoring the change in the harmonic emission and ion yield as the jet is moved in the direction perpendicular to the laser propagation axis.
3. Results
Before generating harmonics, we first directly measured the laser intensity for each beam in a different apparatus, a velocity map imaging (VMI) electron spectrometer, which generates a 2D image of the velocity distribution of the electrons produced at the laser focus [24]. The same focusing optics and input window were used as with the harmonic generation chamber. From the measurement of the 2Up electrons produced by
circularly polarized light, one can accurately determine the laser intensity at focus [25]. For the filtered beam, the focal spot intensity per unit energy was measured to be 7.6 × 10¹¹ W cm−2µJ−1, twice that of the unfiltered beam, which
was 3.6 × 10¹¹ W cm−2µJ−1. The energy of the unfiltered
beam was adjusted so that the peak laser intensity was the same as that of the unfiltered beam. The maximum energy was 500 mJ for a maximum peak intensity for both beams of 1.8 × 10¹⁴ W cm−2, which is close to the saturation intensity
in krypton.
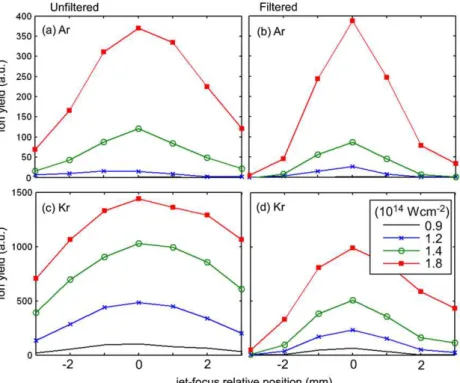
The time-integrated ion signal, measured in the HHG chamber at various positions of the laser focus relative to the centre of the gas jet and for different laser intensities, is shown in figure3. Each data point is the computed average over 100 laser shots. The position that corresponds to the peak of the ion count corresponds to the laser focal spot overlapping with the thin jet (z = 0). Negative values of z correspond to the focus being placed in front of the jet. The ion signal decreases more rapidly with distance when the beam is filtered as confirmed by the different confocal parameters for the two beams. The ion yield gives us an indication of the number of emitters and therefore shows us how the interaction volumes grow with the laser intensity in each gas. The number of ions produced by the unfiltered beam is equal to (in argon) or larger (in krypton) than that produced by the filtered beam, suggesting slightly more emitters in krypton. However, as we will see next, the harmonic yield obtained with the filtered beam is much larger in all cases.
The total harmonic yield in argon and krypton, averaged over 100 laser shots, is shown in figure 4 as a function of the focus position and peak laser intensity. The total yield was obtained by integrating each spectrum between 10 eV and
J. Phys. B: At. Mol. Opt. Phys. 41 (2008) 245602 H-C Bandulet et al
Figure 3. Comparison of the total ionization yield between the fibre-filtered and unfiltered pump beams in argon ((a) and (b)) and in krypton
((c) and (d)). The ion signal is shown as a function of laser intensity at focus and relative distance between the focus and the center of the gas jet. The legend applies to all graphs.
Figure 4. Comparison of the total harmonic yield (integrated over the 10–65 eV range) between the fibre-filtered and unfiltered pump
beams in argon ((a) and (b)) and in krypton ((c) and (d)). The signal is shown as a function of the laser intensity at focus and relative distance between the focus and the centre of the gas jet. The legend applies to all graphs.
65 eV. For the filtered beam, an increase in the HHG yield of up to 7.7 for Kr and of 2.5 for Ar is observed compared to the unfiltered case. If we narrow the integration range to the emission of photons above 30 eV, i.e. the critical range for attosecond pulse synthesis, this ratio reaches 9.5 in krypton and 3.0 in argon. In agreement with previous studies using
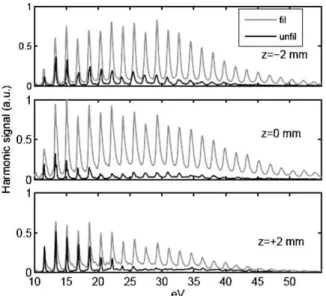
Bessel beams [20,21], the HHG yield is maximum when the filtered beam is focused near the centre of the gas jet. In figure5, we show the average harmonic spectra in krypton produced with the filtered and unfiltered beams at three z positions of the focus relative to the jet and at a laser intensity at focus of 1.8 × 10¹⁴ W cm−2. In all three cases, filtering
Figure 5. Average harmonic spectra in krypton produced with the
fibre-filtered (grey) and unfiltered (black) 1400 nm beams at three z positions of the focus relative to the jet and at a laser intensity at focus of 1.8 × 10¹⁴W cm−2. The signal scale is normalized to the
strongest signal.
of the beam not only produces brighter plateau harmonics but also extends the cutoff energy by at least 10–15 eV.
4. Discussion
Harmonic generation is optimized when phase matching is achieved, i.e. when the difference between the phase front of the harmonic field and that of the driving laser field is minimized. One of the main causes of variation in the nonlinear polarization induced by the laser field is due to rapid variations of the dipole phase with intensity I, especially for mid-infrared lasers since it scales as λ3I [33]. It induces a
spatially and temporally dependent phase term in the medium which influences the generation of the macroscopic field. This phase modulation is all the more important as the peak intensity is high. Another contribution is that imparted by the phase variations in the IR laser wavefront itself which imprints on the generated field and impairs the ability for all emitting source points to interfere in the far field. As clearly explained in [32], all the processes which cause different time histories of the rays emerging from two points in the medium will affect phase matching. For example, additional phase mismatch may arise from time and space variations of the ionization which creates an electron density that varies from place to place. Nevertheless, phase-matching calculations that take into account both axial and transverse mismatch are difficult to perform without complete knowledge of the experimental laser wavefront. Indeed, a comparative study between a Gaussian and a Bessel beam under the same experimental conditions for the generation of harmonics has revealed fundamental differences in the phase-matching conditions that were directly linked to the beam mode [21]. Also, current models of the macroscopic response of the medium assume a uniform transverse wavefront and most neglect phase variations across the diameter of the beam in order to concentrate on axial
Figure 6. Ratio between the total harmonic yield obtained with the
spatially filtered beam and the unfiltered beam as a function of laser intensity in both argon (red dashed lines) and krypton (blue solid lines) at a focus position of z = 0 (open circles) and z = +1 mm (plus signs).
phase-matching conditions [33]. However, a few groups have investigated the effect of time-dependent phase variations between two non-symmetrical points across the diameter of a Ti:Sa beam on the phase-matching conditions and the subsequent spatial coherence between the two point sources [16,31,32]. As briefly discussed in [16], this is similar to the case where the fluctuations arise from inhomogeneities in the IR wavefront. In conditions similar to ours, they find that the coherence is highly sensitive to irregularities in the beam profile. Very recently, measurements of the wavefronts of an 800 nm beam and its 13th harmonic were performed by Gautier et al [29] and have shown that the quality of the HHG beam is directly correlated with that of the IR pump.
The harmonic yield ratios between the filtered and unfiltered conditions are plotted in figure6 as a function of peak laser intensity at the position z = 0 for the two gases. The improvement in the harmonic yield with spatial filtering increases with the laser intensity in both gases. In light of the above discussion, we believe that this can be explained by the difference in the transverse extension of the interaction volume in connection to the spatial uniformity of the beam over this area, in a similar fashion as in [32]. At low laser fluence, only a portion limited to the centre of the focal spot will produce sufficient ionization leading to detectable harmonic emission. In this case, the transverse uniformity of the pump beam only needs to be satisfactory over the small area contributing to the emission for efficient buildup. As such, we observe no improvement with filtering at these low peak intensities, i.e. the gain is close to 1. Spatial uniformity of the intensity distribution becomes more important as the peak intensity grows since (1) a larger area can contribute to the emission of the harmonics (source points further apart will be more sensitive to phase variations) and (2) because the phase mismatch due to the atomic dipole phase also increases with I. Smoothing of the laser wavefront is thus likely to have a more significant effect on the harmonic yield gain for the higher peak laser intensities.
J. Phys. B: At. Mol. Opt. Phys. 41 (2008) 245602 H-C Bandulet et al
In a similar way, the difference in the transverse extension of their respective interaction volumes can also explain the observed differences in the harmonic yield ratios between argon and krypton. The amount of ionization during the time window in the pulse that a particular harmonic is generated is calculated using single-atom ADK (Ammosov–Delone– Krainov) tunnelling ionization rates [28]. Using the model presented in [26], we find that at the maximum laser intensity used during the experiment the ionization probability at the peak of the pulse is 7% in argon compared to 50% in krypton. The emitting volume will thus be proportionally smaller in argon compared to krypton. Instead of producing an estimate of the total ionization over the intensity profiles presented in figure 2, one way to verify this assumption is to compare our results at intensities where both gases exhibit similar ADK ionization curves. The intensity at which the ADK ionization rate in krypton is the same as the rate in argon at the maximum laser intensity is close to 1.2 × 10¹⁴ W cm−2.
From figure6, we find that the harmonic yield gain in krypton at 1.2 × 10¹⁴ W cm−2 is 3.4 at z = 0, in close agreement
to the value of 2 that is measured in argon for an intensity of 1.8 × 10¹⁴ W cm−2. At z = 1 mm, the respective gains
are both close to 2. Moreover, as one can see from figure3, the corresponding ion yields are also similar. In the same way, we believe that if we could attain a peak intensity of 2.8×10¹⁴ W cm−2with the filtered beam, the increase factor in
argon would then be similar to the factor measured in krypton at 1.8 × 10¹⁴ W cm−2 since their ionization rates match at
these intensities.
In this experiment we made sure that the interaction volumes were equivalent for the filtered and unfiltered conditions by (1) using a gas jet that is much thinner than the confocal parameter of either beam and (2) by adjusting the divergence of the filtered beam such that their focal spot sizes were identical. In addition, we observe that, at constant laser intensity, the ion yield for the filtered beam is either slightly lower than or equal to the yield of the unfiltered beam, which rules out the possibility that the observed improvement in the harmonic generation efficiency is due to an increase in the number of emitters for the filtered condition. The ion yield measurements, performed simultaneously with the recording of the HHG spectra, confirm that the interaction volumes are highly similar for both laser conditions. Moreover, the comparison between the results obtained in argon and krypton at various laser intensities strongly suggests that spatial filtering improves the phase matching between contributing source points across the emitting volume, which results in a more efficient buildup of the harmonic signal. As mentioned earlier, due to its smaller ionization potential, a larger fraction of the atoms will be ionized in krypton compared to argon at a given peak laser intensity; hence, a larger area of the IR beam will contribute to HHG. In agreement with our results, we find that the larger the area contributing to the signal, the better is the improvement in the harmonic yield after smoothing of the laser intensity profile. In support of improved phase matching, we observe an extension of the spectrum towards higher energies with the filtered beam (cf figure 5) and a better spatial quality of the produced harmonics which are
characterized by a low divergence (less than 5 mrad for all orders) that is maintained over a wider range of focus positions.
5. Conclusion
We report significant improvement of the high-order harmonic generation using a 1400 nm OPA beam that is spatially filtered by a hollow-core fibre. The harmonic signal integrated above 30 eV increases by almost a factor of 10 relative to the unfiltered case using only half the energy per pulse. In the future, the next step will be to produce few-cycle IR laser pulses with the hollow-core fibre setup in order to obtain higher intensities per pulse and generate shorter attosecond pulses from the ionization of high Ip atoms. At the moment,
our laser system is not carrier-envelope phase (CEP) stabilized and cannot be used to produce isolated attosecond laser pulses. However, our work clearly demonstrates an additional advantage to perform pulse compression of OPA laser pulses with the hollow-core fibre approach.
Acknowledgments
We acknowledge the support of the Canada Foundation for Innovation, the Canadian Institute for Photonic Innovations, The Natural Sciences and Engineering Research Council of Canada, and the Fonds Qu´eb´ecois de la Recherche sur la Nature et les Technologies. We would also like to thank the ALLS technical staff for assistance during the experiments and L Andrzejewski for the development of the beam analyser software.
References
[1] L’Huillier A and Balcou P 1993 Phys. Rev. Lett.70 774
[2] Brabec T and Krausz F 2000 Rev. Mod. Phys.72 545
[3] Hentschel M et al 2001 Nature414 509
[4] Baltuska M et al 2003 Nature421 611
[5] Sansone G et al 2006 Science314 443
[6] Mashiko H, Gilbertson S, Li C, Khan S D, Shakya M M, Moon E and Chang Z 2008 Phys. Rev. Lett.100 103906
[7] Goulielmakis E et al 2008 Science320 1614
[8] Corkum P B and Krausz F 2007 Nature Phys.3 381
[9] Corkum P B 1993 Phys. Rev. Lett.71 1994
[10] Bellini M 2000 Appl. Phys. B 70 773
[11] Shan B and Zenghu C 2002 Phys. Rev. A65 011804
[12] Shan B, Cavalieri A and Chang Z 2002 Appl. Phys. B74 S23
[13] Takahashi E J, Kanai T, Nabekawa Y and Midorikawa K 2008
Appl. Phys. Lett.93 041111
[14] Tate J, Auguste T, Muller H G, Sali`eres P, Agostini P and DiMauro L F 2007 Phys. Rev. Lett.98 013901
[15] Cerullo G and De Silvestri S 2003 Rev. Sci. Instrum.74 1
[16] Sali`eres P, L’Huillier A, Antoine Ph and Lewenstein M 1999
Adv. At. Mol. Opt. Phys.41 83
[17] Hergott J T et al 2003 J. Opt. Soc. Am. B20 171
[18] L´egar´e F, Litvinyuk I V, Dooley P W, Qu´er´e F,
Bandrauk A D, Villeneuve D M and Corkum P B 2003
Phys. Rev. Lett.91 093002
[19] Marcatili E A J and Schmeltzer R A 1964 Bell Syst. Tech. J.
43 1783
[20] Nisoli M et al 2002 Phys. Rev. Lett.88 033902
[21] Altucci C et al 2003 Phys. Rev. A68 033806
[22] Mashiko H, Nakamura C M, Li C, Moon E, Wang H, Tackett J and Chang Z 2007 Appl. Phys. Lett.90 161114