HAL Id: tel-01230553
https://tel.archives-ouvertes.fr/tel-01230553
Submitted on 18 Nov 2015HAL is a multi-disciplinary open access archive for the deposit and dissemination of sci-entific research documents, whether they are pub-lished or not. The documents may come from teaching and research institutions in France or abroad, or from public or private research centers.
L’archive ouverte pluridisciplinaire HAL, est destinée au dépôt et à la diffusion de documents scientifiques de niveau recherche, publiés ou non, émanant des établissements d’enseignement et de recherche français ou étrangers, des laboratoires publics ou privés.
interstellar medium
Anna Parikka
To cite this version:
Anna Parikka. Properties and evolution of dense structures in the interstellar medium. Galactic Astrophysics [astro-ph.GA]. Université Paris Sud - Paris XI, 2015. English. �NNT : 2015PA112221�. �tel-01230553�
u n i v e r s i t é pa r i s-sud xi é c o l e d o c t o r a l e 1 2 7 a s t r o n o m i e e t a s t r o p h y s i q u e d’île-de-france d o c t o r at : science de l’univers A N N A PA R I K K A P R O P E R T I E S A N D E V O L U T I O N O F D E N S E S T R U C T U R E S I N T H E I N T E R S T E L L A R M E D I U M d e f e n d e d s e p t e m b e r 2 8 t h 2 0 1 5 t h è s e d i r i g é pa r: a l a i n a b e r g e l e m i l i e h a b a r t j e r o n i m o b e r na r d-salas j u r y: a n n i e z ava g n o (rapportrice) j é r ô m e p e t y (rapporteur) ja q u e s l e b o u r l o t (examinateur) jav i e r g o i c o e c h e a (examinateur) v o l k e r o s s e n k o p f (examinateur) a l a i n a b e r g e l (directeur de thèse) e m i l i e h a b a r t (co-directrice de thèse) j e r o n i m o b e r na r d-salas (co-directeur de thèse)
In loving memory of Hillevi Kajavaara, who lived long and prospered.
Keep your eyes on the stars, and your feet on the ground. — Theodore Roosevelt
A C K N O W L E D G M E N T S
I want to thank my supervisors, Emilie Habart, Jeronimo Bernard-Salas, and Alain Abergel for all their work and advice. Especially I want to thank Jeronimo, who was always encouraging and a joy to work with. Thanks also to Melanie Köhler for answering all my questions in the beginning and, Nathalie Ysard for all the help when I came to France. In addition, I want to thank Mika Juvela, my Master’s thesis advisor, who worked with me on the paper on cold clumps, for all his patience and advice. I also had support, especially in the late stages of my thesis, from the école doctor-ale. Especially, I want to mention Jaques Le Bourlot, Jacqueline Plancy, and Guillaume Pineau des Forêts, who gave me practical support. In IAS, I want to thank Rosario Brunetto, Matthieu Langer, and Nicole Nesvadba whose doors were always open.
I want to thank my jury, especially the "rapporteurs", Annie Zavagno and Jérôme Pety, but also Jaques Le Bourlot, Javier Goicoechea, and Volker Os-senkopf. I would like to thank Javier for all the comments and help with my CH+and OH paper, and Volker for the many interesting discussions in con-ferences. I also want to thank Benjamin Godard for his help with the CH+
excitation. Other collaborators and friends that I want to mention are Zsofia Nagy, Silvia Vicente, and Olivier Berné. Thank you for your friendship and collaboration.
I want thank my friends in IAS, especially Lisseth and Elisabetta, who always made me feel better no matter what and offered many moments of peer support. Also, thank you, Marian, for introducing me to your wife. I also want to thank the other PhD students and postdocs in IAS. Especially I want to thank Agnès for the coffee breaks in French, and Cinthya and Raul for sharing the office with me. Outside IAS, Charlène was there when things were tough and Emeric, who took me climbing. Thank you for your friendship.
I want to thank all my friends outside of work: Anni, for all our discus-sions in Finnish, Aleksi, for being a friend and also introducing me to all his friends, and Helen, for all the Jane Austen geekiness and overall support. And in Finland: Laura, Riikka, and Jossu you have been there for me so many times. And everyone else, even though I don’t mention you here, I do appreciate all the support and your friendship.
And last but not least, I want to thank my family: my parents, Aira and Erkki, and my sisters, including Iiris, for all the support through the years. Without you I wouldn’t be here. Also, my grandparents, who I wish could have seen me, for all their love and encouragement. And especially my grandmother who taught me to be a geek.
A B S T R A C T
In this thesis I present a study of two kinds of dense ISM structures: com-pact cold sources detected by Planck and dense condensations in a photodis-sociation region (PDR), namely the Orion Bar detected by ground-based and Herschel telescopes. Both kinds of structures are closely related to star formation. The cold sources are investigated as potentially gravitation-ally bound, prestellar, objects. The Orion Bar is a highly FUV-illuminated (G0 ∼104) prototypical PDR, with several known protoplanetary disks,
illu-minated by the young Trapezium stars.
First I introduce a paper published in A&A: The Physical state of selected cold clumps. In this paper we compared the Herschel dust continuum ob-servations from the open time key program Galactic Cold Cores to ground based molecular line observations from the 20-m radio telescope of the On-sala Space Observatory in Sweden. The clumps were selected based on their brightness and low dust color temperatures (T∼10−15 K). We calculated the virial and Bonnor-Ebert masses and compared them to the masses calcu-lated from the observations. The results indicate that most of the observed cold clumps are not necessarily prestellar.
In my study of the Orion Bar, I use observations from PACS instrument onboard Herschel from the open time program Unveiling the origin and excita-tion mechanisms of the warm CO, OH and CH+. I present maps of 11000×11000
of the methylidyne cation (CH+ J=3-2), OH doublets at 84 µm, and high-J CO (J=19-18). This is the first time that these PDR tracers are presented in such a high spatial resolution and high signal-to-noise ratio.
The spatial distribution of CH+ and OH shows the same clumpy struc-ture of the Bar that has been seen in other observations. The morphology of CH+ and H2 confirms that CH+ formation and excitation is strongly
de-pendent on the vibrationally excited H2, while OH is not. The peak in the
OH 84 µm emission corresponds to a bright young object, identified as the externally illuminated protoplanetary disk 244-440.
I introduce mid-J (∼20 K), and high-J (∼1000 K) CO observations of the area. The high-J CO morphology shows a clumpy structure in the Bar and we establish a link between the dense core of the clumps, traced in CS J=2-1 byLee et al. (2013) and in H13CN byLis and Schilke(2003). We also show
that the high-J CO is mainly excited by the UV heating.
R É S U M É
Mon travail de thèse présente deux types de structures denses : des sources froides compactes détectées par Planck et des condensations denses dans une région de photodissociation (PDR), à savoir la Barre d’Orion. Les deux types de structures sont étroitement liées à la formation des étoiles. Les sources froides sont étudiées comme objets potentiellement gravitationnelle-ment liés, c’est-à-dire comme objets préstellaires. La Barre d’Orion est in-téressante en tant que PDR à fort champ UV (G0 ∼104) prototypique, avec
plusieurs disques protoplanétaires connus, éclairés par les jeunes étoiles du Trapèze.
D’abord, je présente un article publié dans A&A: The Physical state of se-lected cold clumps. Dans cet article, nous avons comparé les observations du continuum de la poussière par Herschel provenant de l’open time key pro-gram Galactic Cold Cores (Herschel) aux observations de raies moléculaires par le radiotélescope de 20-m de l’Onsala Space Observatory en Suède. Les objets ont été sélectionnés en fonction de leur luminosités et faibles tem-pératures de couleur des poussières (T∼10−15 K). Nous avons calculé les masses du viriel et de Bonnor-Ebert et les avons comparées aux masses dé-duites à partir des observations. Les résultats indiquent que la plupart des objets froids observés ne sont pas nécessairement préstellaires.
Dans mon étude de la Barre d’Orion, j’utilise des observations de l’instrument PACS d’Herschel du programme Unveiling the origin and excitation mecha-nisms of the warm CO, OH and CH+. Je présente des cartes de 11000×11000 du
cation méthylidyne (CH+ J=3-2), des doublets de OH à 84 µm, et des raies de CO á hauts J (J=19-18). C’est la première fois que ces traceurs des PDR sont présentés avec une telle résolution spatiale et un tel rapport signal-sur-bruit.
La répartition spatiale de CH+ et OH montre la même structure de la Barre qui a été vue dans d’autres observations. La morphologie du CH+ et
H2 confirme que la formation et l’excitation de CH+ est fortement
dépen-dante du H2 excité vibrationnellement. Le maximum d’émission de OH
84 µm correspond à un objet brillant jeune, identifié comme le disque pro-toplanetaire 244-440.
Je présente également des transitions rotationnelles de CO de moyenne (∼20 K) et haute (∼1000 K) énergie. La morphologie de l’émission du CO rotationnellement excité est corrélée avec la présence des petites structures denses irradiées. Nous établissons le lien entre le coeur de ces structures, tracé en CS J=2-1 par Lee et al.(2013) et H13CN parLis and Schilke(2003)
et le bord de la PDR, tracé en CO J=19-18 et le H2 vibrationnellement
ex-citée. Nous montrons également que le CO est principalement excité par le chauffage UV.
C O N T E N T S
i i n t r o d u c t i o n 1
1 w h e r e a n d h o w d o s ta r s f o r m? 3 1.1 Star formation in the ISM 3
1.2 Low vs. high mass star formation 4
1.3 Star formation studies with Herschel and beyond 5 1.4 Aims of the thesis 9
2 d e n s e s t r u c t u r e s i n t h e i s m 11 2.1 Gas phases of the ISM 11
2.2 Molecular clouds, filaments, clumps, and cores 14 2.2.1 Larson’s relations and molecular clouds 14 2.2.2 Smaller structures in the molecular clouds 17 2.3 Photodissociation regions 18
2.3.1 General background 18 2.3.2 The Orion Bar 20 2.4 Proplyds 21
3 m o l e c u l a r t r a c e r s i n t h e i s m 25 3.1 Spectroscopy of molecules in the ISM 25
3.2 CO 26
3.3 N2H+ 28
3.4 CH+ 28
3.5 OH 30
3.6 RADEX: Model for analysis of molecular tracers 32
ii o b s e r vat i o n s 35
4 h e r s c h e l o b s e r vat i o n s 37 4.1 Introduction to the telescope 37
4.1.1 Herschel Space Observatory 37 4.1.2 Herschel science instruments 38 4.2 Observations 45
4.2.1 PACS observations 45 4.2.2 SPIRE and HIFI 46 4.3 Data reduction 46
4.3.1 PACS observations: Maps with PACSman 46 4.3.2 SPIRE observations: SUPREME 47
5 g r o u n d b a s e d o b s e r vat i o n s i n o n s a l a 49 5.1 Introduction to the telescope 49
5.2 Observations and data reduction 50
iii d e n s e s t r u c t u r e s i n c o l d i s m 53 6 p h y s i c a l p r o p e r t i e s o f c o l d c l u m p s 55
6.1 Properties of prestellar cores 55 6.1.1 Size and density 56
6.1.2 Temperature 56 6.1.3 Velocity 57 6.1.4 Chemistry 57 6.2 Stability of cores 58
6.3 Previous work on cold cores 60 6.3.1 Measuring extinction 60 6.3.2 Dust observations 61
6.3.3 Molecular line observations 61
6.4 Parikka et al.: The physical state of selected cold clumps 62 6.5 Perspectives 79
iv d e n s e s t r u c t u r e s i n wa r m i s m 81 7 c h+ a n d o h i n t h e o r i o n b a r 83
7.1 CH+ in the ISM 84 7.2 OH in the ISM 85
7.3 Parikka et al.: Spatial distribution of CH+ and OH 86 7.4 Perspectives 99
8 h i g h-j co in the orion bar 101 8.1 Introduction 101
8.2 Spatial distribution of CO in the Orion Bar 102 8.3 High-J CO excitation 104
8.4 RADEX analysis 109
8.4.1 Fit by a thin slab of gas at high thermal pressure in-clined along the line-of-sight 109
8.4.2 Temperature and column density variations across the
Bar 111
8.5 Conclusions and perspectives 112
v c o n c l u s i o n s a n d p e r s p e c t i v e s 117 9 c o n c l u s i o n s a n d p e r s p e c t i v e s 119 9.1 Conclusions 119 9.2 Perspectives 120 vi a p p e n d i x 123 a h e r s c h e l k e y p r o g r a m s 125 b o r i o n b a r m a p s i n 12c o, 13c o, and c18o 127 b i b l i o g r a p h y 131
Part I
1
W H E R E A N D H O W D O S TA R S F O R M ?1.1 s ta r f o r m at i o n i n t h e i s m
Star formation takes place in the interstellar medium (ISM), which consists of gas and dust. It is a process that includes a complex mixture of grav-ity, turbulence, rotation, radiation, thermodynamics, and magnetic fields. The relative importance of these factors depend on the initial conditions in molecular clouds, and in dense cores which will eventually evolve into stars. Advances in our understanding of the star formation process has improved in the past decade as telescopes and equipment have improved the resolu-tion and sensitivity of observaresolu-tions. While the general process of especially low- and intermediate star formation is known, we are still missing many details, e.g., how the gas assembles into dense cores, what sets the star for-mation rate and the mass of stars, how do substellar objects form, and why star formation is so inefficient in the ISM.
Figure 1.1: The lifecycle of gas, dust and ice in interstellar and circumstellar clouds. Credit: M. Persson, NASA/ESA/ESO/ALMA
Figure1.1shows the life cycle of galactic matter in the ISM. Much of the volume of ISM is low density clouds (nH ∼100 cm−3) of diffuse ISM.
How-ever, the mass of the ISM is concentrated on dense clouds. Dense clouds can
stay in a stable state for a long time due to turbulence and magnetic fields, but finally with time (∼1 Myr) the gravity will make the protostar collapse into a new star. The new star will have circumstellar disks around it, which will continue to evolve into planets and to form a planetary system. At this time the star has entered the stable main-sequence phase. At the end of their life the nuclear fuel of the star is exhausted. This causes the stars become larger while loosing part of their mass. Their radiation and the lost mass causes the surrounding environment to become warm and dense. This en-vironment is favorable for the formation of molecules and the condensation of dust grains. At the final stage the star will produce a planetary nebula with a hot central star ionizing the previously ejected layers. Massive stars have a shorter life cycle and they will explode as supernovae and become black holes or neutron stars (e.g., Snow and McCall, 2006; van Dishoeck, 2014).
The efficiency of star formation in molecular clouds is not very high; only about 10−25 % of the gas in the dense clouds will end up in stars. Star for-mation is most efficient in the filaments that form the dense clouds. The filamentary distribution of gas is something that remains throughout the process of star formation (e.g.,Leisawitz et al.,1989;Hartmann,2002; Tachi-hara et al.,2002). The study of the star formation process involves the study
of evolution from dense clouds to young stars. In my thesis, I concentrate on the early stages of star formation and the dense condensations (clumps and cores) in the dense clouds.
1.2 l o w v s. high mass star formation
Many studies have been dedicated into the study of low star formation.Shu et al.(1987) detailed four stages of low-mass star formation as:
1. Fragmentation of the clouds and formation of slowly rotating cloud cores
2. Gravitational contraction as core passes the instability threshold and collapses dynamically from inside-out
3. The bipolar outflow phase, where the matter is accreted to the disk instead of the star, and stellar wind causes collimated jets and bipolar outflows
4. T Tauri star with a surrounding remnant nebular disk
A fifth stage can also be defined as the final disappearance of the nebular disk. In this stage the matter becomes incorporated into planets or stellar companions or is dispersed by the energetic outflow. While the general pro-cess of star formation is known, there are still questions about the specific underlying conditions that trigger the first stages of star formation and the role of turbulence, magnetic fields, clustering, and feedback is still unclear. The formation of massive stars (M>10 M ) is not as well understood. It
1.3 star formation studies with herschel and beyond 5
B stars. The massive star formation and further evolution is most likely to occur as follows, starting with a pre-existing giant molecular cloud ( Zin-necker and Yorke,2007):
1. Formation of cold dense filaments and cores
2. Nonhomologous1 gravitational collapse of the cores into protostellar cores supported by pressure
3. Accretion of matter onto protostellar objects and their evolution to-wards the main sequence
4. Evolution of the star to become a supernova influenced by the winds, outflows, and UV radiation of the first high-mass stars
In the first stage, the UV radiation and stellar winds exert pressure on the accretion flow of massive stars. The second stage differs from the low-mass star formation stage of the dynamical inside-out collapse. Also in the ac-cretion phase, the acac-cretion for low-mass objects stops before the start of hydrogen burning, unlike with massive stars. And, of course, the low-mass stars do not evolve to supernovae. Other differences between low- and high-mass star formation include physical properties of clouds where they are formed. Massive star formation happens mainly in clouds that are warmer, larger, more massive, mainly located in spiral arms, and in clusters and as-sociations while low-mass stars form mainly in cooler clouds throughout the Galactic disk as well as GMCs, and not necessarily in clusters. However, they can also coexist in the same region, like in the Orion cluster.
Massive stars are not as common as low-mass stars. They also evolve fast and are frequently obscured by or situated in dense clusters. Thus, studies of large populations are challenging, and only lately there are telescopes with high enough angular resolution to resolve these dense clusters. There is also the question of building up sufficient mass against the radiation pressure. Currently there are two competing models to explain this: mono-lithic collapse and competitive accretion. Monomono-lithic collapse predicts mas-sive stars to form relatively isolated but also in clusters. This is a scaled-up version of low-mass star formation. Competitive accretion predicts massive stars to form exclusively in dense cores or clusters of molecular clouds and expects a high-density environment for massive star formation.
The nearest place to us where massive star formation takes place is the Orion Nebula depicted in Fig. 1.2. In my thesis I will consider the effects of the UV radiation from the young massive stars (Trapezium) and their effect on their surroundings (see Chapters7and8). The study on cold clumps (in Chapter6) focuses on the early conditions of the low-mass star formation.
1.3 s ta r f o r m at i o n s t u d i e s w i t h h e r s c h e l a n d b e y o n d
Herschel Space Observatory was planned to observe the cool universe. Its key science objectives emphasized the formation of stars and galaxies. From
1 In this context, nonhomologous is used to indicate that the distribution of mass changes, as opposed to a homologous or self-similar collapse.
Figure 1.2: Orion Nebula (HST). Credit: NASA,ESA, M. Robberto (Space Telescope Science Institute/ESA) and the Hubble Space Telescope Orion Treasury Project Team
the 21 guaranteed time key programs 10 focused on the ISM and/or star formation and the numbers are the same for open time key programs (see list of ISM and/or star formation key programs in AppendixA). In addition there are key programs on the extragalactic star formation and numerous non-key programs that address star formation and ISM.
Herschel observations have confirmed the filamentary structure of the cold ISM and given new information on the connection of filaments to star forma-tion (e.g.,André et al.,2010;Men’shchikov et al.,2010;Molinari et al.,2010).
Filaments are present everywhere, even in diffuse gas and, thus, precede the actual star formation (Miville-Deschênes et al., 2010; Ward-Thompson et al.,2010). They form networks and have also sub-filaments (Peretto et al., 2012;Palmeirim et al.,2013, e.g.,). Filaments have also been shown to be
ve-locity coherent structures (e.g.,Hacar and Tafalla,2011;Arzoumanian et al., 2013). These structures are shown in all Herschel images of star forming
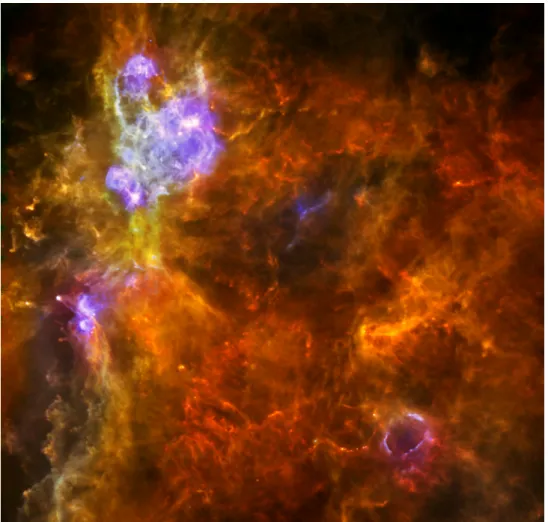
regions, like the image of W3 in Fig.1.3.
In addition to filaments, the properties of dense cores where the star formation takes place has been the subject of many programs with Herschel.
1.3 star formation studies with herschel and beyond 7
Figure 1.3: Star forming region W3 in the constellation of Cassiopeia. The figure combines Herschel bands at 70 µm (blue), 160 µm (green) and 250 µm (red). Credit: ESA/PACS & SPIRE consortia, A. Rivera-Ingraham & P.G. Martin, Univ. Toronto, HOBYS Key Program (F. Motte)
Both the Gould Belt Survey (André et al.,2010) and the Galactic Cold Cores
survey (Juvela et al.,2010) studied these cores. With the getsources method of Men’shchikov et al.(2010), many dense condensations have been identified
in both surveys and I will take a closer look at part of the condensations from the Galactic Cold Cores survey in Chapter6. These condensations are classed as starless, prestellar, or protostellar cores2
depending on their self-gravitation potential and existence of a protostellar source. Herschel studies have also found a close relation between the initial mass function (IMF) and core mass function (CMF) suggesting a close link between cloud properties and star formation (e.g.Motte et al.,1998;André et al.,2010;Könyves et al., 2010).
Herschel observations of the ISM have detected a rich chemistry, includ-ing CO (e.g., Chapter8 andKöhler et al.,2014) water (van Dishoeck et al., 2011), and CH+ and OH (e.g., Chapter 7 and Goicoechea et al., 2011; Go-dard et al., 2012). While Herschel is no longer in operation, there are still
new studies published with the existing data bringing us more information
on the physical and chemical processes in the ISM and especially in star forming regions. There are also several studies that focus on the later stages of star formation like the DIGIT program on protoplanetary disks (Sturm et al.,2010).
After Herschel, the research goes on. Stratospheric Observatory for In-frared Astronomy (SOFIA) is the largest airborne observatory in the world. It covers wavelengths of 0.3−1600 µm at an altitude of 12−14 km reducing the effect of the atmosphere on observations. Specific advantage to Her-schel/PACS follow-up studies is the GREAT instrument which operates at similar wavelengths (60−240 µm) to PACS (55−210 µm), but with a higher velocity resolution (0.03 km s−1,Pérez-Beaupuits et al.,2012). Several
stud-ies have already observed CO lines in different environments (e.g., Requena-Torres et al.,2012;Okada et al.,2015;Ossenkopf et al.,2015) and OH 119 µm
doublet has been observed in ultracompact HII/OH maser regions ( Csen-geri et al., 2012). Thus, the 119 µm lines used in Chapter 7 and several mid-/high-J CO lines are already observable with SOFIA.
Another important telescope, where one of the main objectives is the study of star formation is the Atacama Large Millimeter/submillimeter Ar-ray (ALMA). ALMA has a high angular (0.700at 675 GHz to 4.800at 110 GHz in the most compact configuration) and velocity resolution (highest resolu-tion at 110 GHz is 0.01 km s−1). ALMA has been used to study the chem-istry in the ISM, especially the chemchem-istry related to deuterated molecules and complex organic molecules (e.g.,Belloche et al.,2014;Öberg et al.,2015; Sakai et al.,2015) and there is also evidence of disks surrounding a number
of high mass protostars (e.g., Sánchez-Monge et al., 2013; ALMA Partner-ship et al.,2015;Zapata et al.,2015). In addition, there are studies on dense
structures, like hot cores, massive starless cores, and filamentary fragmenta-tion in the process of star formafragmenta-tion, as well as CO freezeout in the densest parts of the ISM (Lee et al.,2012;Tan et al.,2013;Mathews et al.,2013;Sakai et al.,2013,2015)
In addition to ALMA, NOrthern Extended Millimeter Array (NOEMA), located in the French Alps, consists of seven 15-m antennas. When the con-struction is finished NOEMA will have 12 antennas. The new improved res-olution of four times higher than its predecessor, Plateau du Bure observa-tory, and ten times better sensitivity will make NOEMA the most advanced millimeter radio astronomy observatory in the Northern Hemisphere. At the current state the resolution is 0.500 at wavelength of 1.3 mm (230 GHz).
These and other ground based telescopes in use provide a combination of angular resolution, spectral coverage, sensitivity, and spectroscopic and imaging capabilities to further the understanding of the star formation pro-cesses. For the next decade, we will also have the James Webb Space Tele-scope (JWST) and most likely SPICA, which is a project proposed by ESA. Although often talked as a replacement for Hubble, JWST is not identical and will continue the work in infrared instead of optical wavelengths. In-frared and sub-mm wavelengths include most of the dust and gas emission in the ISM. SPICA will operate in the same wavelengths as Herschel, but with an improved sensitivity allowing observations of fainter regions than
1.4 aims of the thesis 9
Herschel. Thus, JWST and SPICA will also be ideal for star formation studies along the other telescopes already in use.
1.4 a i m s o f t h e t h e s i s
Dalgarno (2008) states that astrochemistry, or molecular astrophysics,
stud-ies ’the formation, destruction, and excitation of molecules in astronomical environ-ments and their influence on the structure, dynamics, and evolution of astronomical objects’. This is a good definition of the subject as it includes the molecules as tools to probing the physical conditions and processes of the regions.
Van Dishoeck(2014) states the main questions in astrochemistry as:
1. How, when, and where molecules are produced and excited? 2. How far does the chemical complexity go?
3. How are the molecules cycled through the various phases of stellar evolution, from birth to death?
4. Can the molecules become part of new planetary systems and form the building blocks for life elsewhere in the Universe?
In this thesis I will concentrate mainly on the microphysics and the ini-tial conditions of the star formation (questions 1. and 2.), and thus, on the astrochemistry or physical and chemical conditions of the dense structures in the ISM. In Chapter2I will introduce the dense structures of the ISM in different gas phases. I will take a closer look on what is known about the cold clumps and cores, photodissociation regions (PDRs), and protoplane-tary disks. In chapter 3 I will introduce the molecular tracers used in this thesis and the RADEX model used for analysis in Chapter8.
In Chapters4and5I introduce the telescopes used in this thesis and the observations made on them. I will look at the physical properties and self-gravitation of cold clumps in Chapter6. I will also investigate the influence of UV radiation on the structure, chemistry and thermal balance of the clouds, or more specifically PDRs, and the nature, properties and evolution of irradiated dense structures inside PDRs in Chapters 7and8.
2
D E N S E S T R U C T U R E S I N T H E I S MIn this chapter I introduce the structure of the gas in the ISM, focusing on the dense structures important to star formation. In Sect. 2.1 I discuss the gas in general and in Sect. 2.2 I discuss the molecular clouds, clumps, and cores. Distinction between clumps and cores is especially important for Chapter 6. In Sect. 2.3 I introduce the photodissociation regions and the Orion Bar in particular, which is the target of the observations of Chapters 7 and 8. Finally, Sect. 2.4 focuses on externally illuminated protoplanetary disks, since we can see one of the known proplyds in the Orion Bar in our map of OH 84 µm emission. The last two sections introduce the context for Chapters7and8.
2.1 g a s p h a s e s o f t h e i s m
The ISM consists of baryonic matter, electromagnetic radiation, gravitational field, and magnetic field. In the ISM, ∼99 % of the mass is gas: 70 % of the matter is hydrogen, 28 % helium, and 2 % heavier elements like oxygen, carbon, and nitrogen.
The ISM can be classified according to its temperature and density.Field et al.(1969) divided the ISM into the cold and warm neutral medium of the
ISM.McKee and Ostriker(1977) expanded the model to include the hot and
ionized gas. Currently, the gas in the ISM is divided into five phases (see reviews, e.g.Ferrière,2001;Cox,2005):
• The molecular gas consists mainly of H2. It is cold and found mostly in
the dense inner core part of the cloud. It is sometimes categorized as a sub-phase of cold neutral medium.
• The cold neutral medium (CNM) consists of cold, neutral, and mainly atomic gas. If the molecular gas is separated to its own phase, the CNM is less dense and warmer than the molecular gas.
• The warm neutral medium (WNM) surrounds small clouds and connects them to others forming cloud complexes. It is roughly in pressure equilibrium with CNM (Field et al.,1969). The WNM is characterized
with low density and high temperature.
• The warm ionized medium (WIM) is ionized by stellar radiation from O and B stars. The transition from the ambient ISM to the WIM is abrupt due to the absorption of the ionizing UV photons by neutral hydrogen. The radiation forms an HII region that surrounds the stars. • The hot ionized medium (HIM) is formed by supernova explosions and
stellar winds. Hot gas forms only a small fraction of the interstellar mass due to its low density.
Table2.1summarizes the properties of the different gas phases, and Fig.2.1 provides an example of how the phases relate to a small cloud.
Table 2.1: Phases of the ISM (Stahler and Palla, 2004). Listed in the table: total density [cm−3], temperature [K], mass [M
], and fraction of volume.
Phase ntot[cm−3] T [K] M[109 M ] f
Molecular > 300 10 2.0 0.01
Cold neutral (CNM) 50 80 3.0 0.04
Warm neutral (WNM) 0.5 8× 10³ 4.0 0.30
Warm ionized (WIM) 0.3 8× 10³ 1.0 0.15
Hot ionized (HIM) 3× 10⁻³ 5× 10⁵ - 0.50
Figure 2.1: Cross section of a characteristic small cloud (McKee and Ostriker,1977) This thesis focuses on the dense structures in the ISM. I mainly focus on CNM including molecular gas as the densest phases of the ISM. Snow and McCall (2006) classified different types of molecular clouds that can
be found in the CNM and molecular gas. This denser gas contains variety of physical and chemical conditions, and the properties listed in Table 2.1 cover only part of the picture. The four types of clouds or gas based on a
2.1 gas phases of the ism 13
photodissociation region (PDR) model (with nH = 100 cm−3 and χUV = 11,
see Fig. 2.2and Table2.22):
Figure 2.2: Definitions of cloud types (Snow and McCall,2006)
Table 2.2: Classification of cloud types (Snow and McCall,2006)
Diffuse Diffuse Dense
atomic molecular Translucent molecular
Defining fnH2 > 0.1 f n C+ < 0.5 characteristic fn H2 < 0.1 f n C+ > 0.5 fnCO< 0.9 fnCO> 0.9 AV (min.) 0 ∼0.2 ∼1−2 ∼5−10 Typ. nH [cm−3] 10−100 100−500 500−5000(?) >104 Typ. T [K] 30−100 30−100 15−50(?) 10−50
• Diffuse atomic gas is exposed to the interstellar radiation field. Thus, photodissociation destroys all molecules quickly. In diffuse atomic clouds hydrogen is mainly neutral and atomic. The atoms whose ization potentials are less than that of hydrogen, are almost fully ion-ized. These clouds can be observed via optical and UV absorption, since there are many lines which are optically thin. Typical
densi-1 In this model a radiation field equals to the average interstellar value given by (Draine,1978).
The PDR model used inNeufeld et al.(2005), which was a modified version of the models
ofKaufman et al.(1999),Wolfire et al.(1990), andTielens and Hollenbach(1985a).
2 fnxare fractions of number densities: e.g., fnH
2= 2nH2/nHand f
n
ties and temperatures for diffuse atomic gas are 10−100 cm−3 and 30−100K, respectively.
• Diffuse molecular gas is affected by the interstellar radiation field, but it is attenuated enough by dust for the fraction of molecular hydrogen to become substantial (> 0.1). Carbon is still predominately C+ due to photoionization of atomic carbon and photodissociation of CO. Dif-fuse molecular gas is always surrounded by difDif-fuse atomic gas. This can be observed in UV, optical, IR, and mm wavelengths. Typical den-sities and temperatures for diffuse molecular gas are 100−500 cm−3
and 30−100 K, respectively.
• Translucent gas is protected from the interstellar radiation and the car-bon is transitioned to neutral C or molecular CO form. The chemistry changes in comparison to the diffuse molecular clouds, when the elec-tron fraction decreases and C atoms become highly abundant.
• Dense molecular gas has a higher extinction and carbon is mostly molec-ular (CO). Dense gas is likely to be surrounded by translucent gas and the low electron abundance changes the chemistry when cosmic ray ionization becomes the dominant source of ionization. Dense clouds are generally self-gravitating (see Section 2.2.1). They are mostly ob-served in IR absorption and mm emission. Typical densities and tem-peratures for dense molecular gas in quiescent regions are over 104cm−3
and 10−50 K, respectively.
This is a simplified view of the cloud types. In reality clouds are most likely a mixture of these types as they are inhomogeneous. Also, one should keep in mind that the properties listed here are not line-on-sight properties.
2.2 m o l e c u l a r c l o u d s, filaments, clumps, and cores 2.2.1 Larson’s relations and molecular clouds
Larson(1981) identified some of the key features of giant molecular clouds
which are often referred as Larson’s laws or relations. These laws are: 1) molecular clouds obey a line-width - size relation, 2) they are gravitationally bound, and 3) they all have similar column densities. These relationships are not independent and any two imply the third. Larson’s relations are purely empirical. Basically, they state how the masses, the radii, and the velocity dispersions of molecular clouds relate to each other.
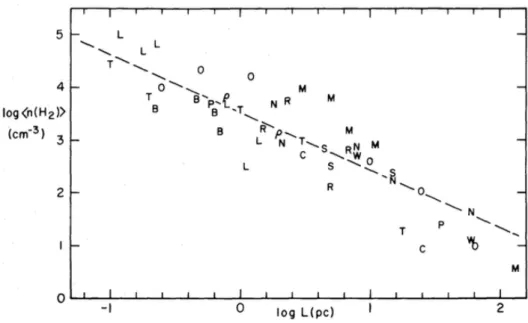
Figure2.3illustrates the first law: velocity dispersion is dependent on the size of the cloud. The scale used is logarithmic and the figure gives the mea-sured velocity dispersion as a function of cloud diameter. The correlation is clearly seen in figure 2.3 and the relation found from the fit is σ ∝ L0.38, where L is the region size in parsecs. The corresponding relation between velocity dispersion and mass can be seen in figure 2.4. For mass, the ob-served relation is σ ∝ M(M )0.20. These relations of velocity dispersions
2.2 molecular clouds, filaments, clumps, and cores 15
Figure 2.3: Velocity dispersion as a function of cloud diameter (Larson,1981)
Figure 2.4: Velocity dispersion as a function of the cloud mass (Larson,1981)
to size and mass hold for the whole cloud, but also for the subregions of an individual cloud or a cloud complex.
The second law states that the giant molecular clouds are gravitationally bound and approximately satisfy the virial theorem. However, along with gravity, turbulent hydrodynamics play an important role in the formation of substructures in molecular clouds. The relation between virial ratio and cloud diameter is given by:
2GM σ2L ∝ L
This ratio is valid for a spherical cloud with a mass M, diameter L, and ve-locity dispersion σ. G is the gravitational constant 6.67384×10⁻¹¹m3kg−1s−2.
This relation can be seen in figure2.5.
Figure 2.5: Virial ratio as a function of cloud diameter (Larson,1981) Finally, the third law states that all giant molecular clouds have similar column densities. The found relation between column density and size was
hn(H2)i(cm−3) ∝ L−1.10. (2.2)
For this relation the average density is calculated for a sphere with mass
Figure 2.6: Column density versus region size in diameter (Larson,1981) Mand diameter L.
2.2 molecular clouds, filaments, clumps, and cores 17
Larson’s relations have been tested with new data from surveys with higher resolution. Solomon et al. (1987) confirmed the relationships,
al-though they found a steeper power index for the first relation: σ ∝ L0.5.
Heyer et al. (2009) found different surface densities, but also in their
inves-tigation the laws hold qualitatively quite well.Lombardi et al.(2010) found
that the third law does hold for molecular cloud complexes, but in smaller structures, like clumps and cores, and individual clouds the column densi-ties vary. Bolatto et al. (2008) studied the laws in the extragalactic context
and found that the laws hold for extragalactic giant molecular clouds as well. Finally, simulations have found support for a turbulent interpretation of the laws (Kritsuk et al., 2013). This interpretation implies that the line
width-size and mass-size correlations are determined by the inertial cas-cade, that is a transfer of energy from large scales of motion to the small scales caused by the turbulent nature of internal motions.
2.2.2 Smaller structures in the molecular clouds
The structures in the molecular clouds can be classified by their physical properties. Although these definitions are not strict, in general, the filaments are larger denser structures in the clouds and can contain clumps and/or cores. In Table2.3is listed the approximate properties for molecular clouds as a whole, the clumps, and the cores. The largest entities are molecular
Table 2.3: Physical properties of molecular clouds, clumps, and cores (Bergin and Tafalla,2007)
Clouds Clumps Cores
Mass [M ] 103−104 50−500 0.5−5
Size [pc] 2−15 0.3−3 0.03−0.2
Mean density [cm−3] 0−500 103−104 104−105
Velocity extent [km s−1] 2−5 0.3−3 0.1−0.3
Crossing time [Myr] 2−4 ∼1 0.5−1
Gas temperature [K] ∼10 10−20 8−12
Examples Taurus, Oph, B213, L1709 L1544,
Musca L1498, B68
clouds. They have clumps, which are smaller in size and mass, and finally, cores, which are the densest parts of clumps making them the smallest of the three. Thus, the higher the density, the smaller the structures are. That is why the cores are sometimes called dense cores even if their mean density (nH2) is only 10
4−105 cm−3. They are dense compared to their
surroundings with an average cloud density of ∼500 cm−3. In this thesis I
will talk about clumps, that can be smaller in size than here. It is used for condensations that can be cores, but their nature is not possible to define from our observations.
There are different definitions to what is considered a clump or a core, but in this thesis I refer to the Table2.3in general. When talking about cold
clumpsin Chapter6, I am referring to the Planck-detected cold clumps with a dust color temperature Tdust .14 K (Planck Collaboration XXIII, 2011).
Clump is also used to refer to denser structures in filaments in general, although some of the condensations referred to as clumps might be cores or contain unresolved cores.
There are different types of dense cores in the molecular clouds. A star-less core is a dense core which has no protostellar object associated to it. Prestellar core is a starless core which is also gravitationally bound, and can potentially form a star by gravitational collapse. If the gravitational col-lapse happens, the prestellar core evolves to a protostellar core, which is a dense core with a formed protostar (e.g.,Ward-Thompson et al.,1994,2007; André et al., 2000;di Francesco et al., 2007). In Chapter6 my goal is to in-vestigate if the cold clumps observed with Planck and Herschel are, in fact, prestellar cores, that might evolve to protostellar cores.
2.3 p h o t o d i s s o c i at i o n r e g i o n s 2.3.1 General background
Most of the gas in the ISM is in neutral form. A photodissociation re-gion (PDR) is created when intense far-ultraviolet (FUV) field illuminates a molecular cloud. Thus, FUV photons are present in PDRs and they can dis-sociate most molecules. They are not energetic enough to ionize hydrogen and create HII regions. PDRs are neutral surface layers at the interface of HII regions and molecular clouds.
s t r u c t u r e o f t h e p d r. In Fig. 2.7 is a schematic diagram of a PDR. The PDR is illuminated with FUV flux from the left and extends to AV ∼10.
The PDR starts where hydrogen is not ionized anymore, but is found in atomic form. Oxygen, which has similar ionization potential to hydrogen is also neutral. Carbon is still ionized as C+. Neutral atomic hydrogen extends
to H/H2 transition. Atomic carbon exists mainly where carbon loses the
ionization and changes to molecular CO form.
The typical kinetic temperature of the gas Tgas is also shown in the Fig.
2.7. The gas is hotter at the edge of the PDR where the UV flux is greater and the temperature decreases towards the molecular cloud. In the bottom of the figure the optical depth, AV, and column density of hydrogen, NH,
are also shown. Hydrogen in the PDR is mainly in the form of H2 and
carbon in the form of CO. Warm O, C, C+, H2, and CO are produced in the
PDR.
c h e m i s t r y o f t h e p d r. Due to the high FUV flux, photoreactions are are important in PDRs, in addition to the reactions with atomic hydrogen. H2 chemistry is also very important to PDRs. After H2 forms on grain
2.3 photodissociation regions 19
Figure 2.7: A schematic diagram of a PDR (Hollenbach and Tielens,1997).
Dalgarno (1995) have discussed the chemical processes in PDRs in detail.
The main reactions for oxygen- and carbon-bearing compounds are shown in Fig.2.8. The chemistry is further discussed in Chapter3, and Chapter 7
Figure 2.8: PDR chemistry of oxygen- (left) and carbon-bearing (right) compounds (Sternberg and Dalgarno,1995).
concerning the formation and excitation of CH+ and OH.
h e at i n g a n d c o o l i n g o f t h e p d r. The FUV photons (6 eV < hν < 13.6 eV) dominate the heating of the PDR. The UV radiation heats either through the photoelectric effect on polycyclic aromatic hydrocarbons (PAHs)
and small dust grains or collisional de-excitation of UV-pumped H2molecules.
Other heating mechanisms, such as H2 formation, ionization of atoms (C)
and molecules, cosmic ray ionization and excitation, pumping of gas parti-cles to excited states by the FIR radiation field of the warm dust followed by collisional de-excitation, and gas collisions with warm grains can play a small role in the heating of the PDR when Tdust >Tgas (Tielens and
Hollenbach,1985a;Hollenbach and Tielens,1999).
The cooling of PDRs is dominated by FIR fine structure cooling lines. Especially important are [OI] lines at 63 and 145 µm and [CII] line at 158 µm at the edge of the PDR. Other cooling lines are the fine structure lines [SiII] 35µm, [CI] 609, and 370 µm and molecular lines like CO and H2. CO tends to dominate cooling in the denser part of the cloud. In high gas densities important cooling mechanisms can also include collisions with cooler dust grains and the recombination of electrons in positively charged particles.
2.3.2 The Orion Bar
The Orion Bar is a prototypical hot and dense PDR. In Fig. 2.9 we can see the Herschel image of Orion A, where the filamentary structure of the cloud is clearly seen. The 250 µm SPIRE map shows the Orion Bar, that
2.4 proplyds 21
can be classified as a filament as well (Walmsley et al.,2000), and finally a
NIR image shows the Bar and the Trapezium stars creating HII region and the strong UV field 2.5 × 10⁴ times the standard interstellar radiation field (Draine,1978;Marconi et al.,1998) affecting the Bar. The Trapezium stars are
a cluster of four stars of which one, θ1 Orionis C, is the principal source of
UV photons illuminating the Orion Nebula. The Bar or its ionization front is situated 11100(0.23 pc,Pellegrini et al.,2009) South-East of the Trapezium
stars.
Besides being bright, the Orion Bar is also located near, at a distance of 414±7 pc (Menten et al., 2007). In addition, it is positioned nearly edge-on
in the line of sight. The proximity, high luminosity, and the edge-on orienta-tion makes it an ideal PDR to study. Thus, it has been extensively observed for more than four decades (e.g., Courtès and Viton, 1965; Andrillat and Duchesne, 1974; Russell et al.,1980; Tielens et al., 1993;Hogerheijde et al., 1995;van der Werf et al.,1996;Walmsley et al.,2000;Young Owl et al.,2000; Lis and Schilke, 2003; Habart et al., 2010; Arab et al., 2012; Bernard-Salas et al.,2012;Nagy et al.,2013).
Together with modeling, we have information on the physical structure, excitation, and dust and gas emission in the region. The studies have re-vealed stratified structure which is typical for edge-on geometry (e.g., Tie-lens et al.,1993;Lis and Schilke,2003). The Bar is most likely a cylinder-like
structure in the plane of the sky (Walmsley et al.,2000).
There are two gas components in the Bar: dense clumps of nH∼106cm−3,
and a less dense interclump medium nH ∼5×104 cm−3 (e.g.,Burton et al.,
1990;Parmar et al.,1991;Tauber et al.,1994;Young Owl et al.,2000). Bernard-Salas et al. (2012) also observed a background PDR in [OI] and [CII] lines.
The condensations in the Bar may collapse to form low-mass stars (Lis and Schilke,2003) and there are known protoplanetary disks in the Bar (O’Dell and Hu,1994).
2.4 p r o p ly d s
Externally illuminated protoplanetary disks or proplyds (O’Dell et al.,1993)
are PDR-like cometary structures with en elongated tail extending away from the illuminating star. They form around young stars and the external UV radiation produces a fully ionized surface for the disk. These objects are at high density and temperature, but a strong pressure gradient causes them to lose material into the nebula. Already Laques and Vidal (1979)
found partially ionized globules with a neutral core, while ionization front penetrated inside the condensations and the ionized matter becoming pro-gressively diluted in the general medium. Proplyds were first detected in Orion Nebula and they were called proplyds by O’Dell et al. (1993) and O’Dell and Hu (1994). Originally this was the term for all protoplanetary
disks, but in time the term has come to refer only to disks that are externally illuminated and photoevaporated by UV radiation.
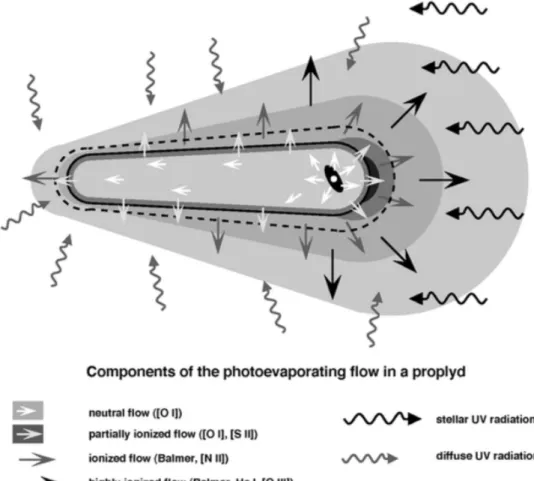
A schematic representation of the photoevaporating model, showing the principal components is shown in Fig.2.10. In the figure, the ionizing star
Figure 2.10: Schematic representation of the photoevaporating model, showing the principal components (Henney and O’Dell,1999).
is on the right and the UV radiation from the star is entering from the right side. The surface of the proplyd is penetrated by the UV photons. This accel-erates the gas to mildly supersonic velocities shocking before the ionization front. Inside the ionization front the gas accelerates to ∼10 km s−1 and con-tinues to accelerate further from the ionization front. After the ionization front, the gas becomes predominantly neutral in the inner molecular disk, and is fed by diffuse UV radiation. Thus, the tail is again ionized further away from the disk and the matter from the disk photoevaporates in the tail of the proplyd. Fig. 2.10 shows a general representation of a proplyd. The actual appearance of proplyds varies and depends on the orientation of the inner disk, the amount of ionization from the external sources, and the possible shielding of the proplyd from the ionizing photons (Henney and O’Dell,1999;O’Dell et al.,2008).
There have been over 150 proplyds detected to date (e.g., O’Dell and Wong, 1996; Bally et al., 1998, 2000). Observations show less PAHs in
pro-plyds than expected (Geers et al., 2007; Oliveira et al., 2010; Vicente et al., 2013). The underabundance is still unexplained, although hypothesis exists
2.4 proplyds 23
on clustering of PAHs or destruction of PAHs by FUV photons in the PDR or X-rays emitted by the central star. However, the PAHs are still expected to be mainly responsible for the photoelectric heating of proplyds (Vicente et al., 2013). Proplyds and other protoplanetary disks have been observed
in atomic and molecular lines, namely [OI] (Bally et al.,1998,2000) and H2
(Chen et al., 1998). Recent study with Herschel has shown that
protoplan-etary disks can be observed in several other lines as well, e.g., [CII], [OI], CO, CH+, and OH (Sturm et al., 2010; Fedele et al., 2011; Thi et al., 2011;
3
M O L E C U L A R T R A C E R S I N T H E I S MIn this chapter I give an introduction to the spectroscopy and the molecules observed for the work presented in Chapters 6, 7, and 8. I also introduce RADEX that is used for the analysis of CO in Chapter 8.
3.1 s p e c t r o s c o p y o f m o l e c u l e s i n t h e i s m
The ISM is mostly studied using radio and infrared observations, since the peak of the radiation of the matter is mostly in these wavelengths and also dust extinction causes problems at short wavelengths. Spectroscopic studies provide information on molecules and atoms probing physical and chemi-cal conditions in the ISM. Most of the interstellar gas is hydrogen (∼70 %) and helium (∼30 %). The most abundant molecule is H2, followed by CO,
OH, and NH3, although the abundances of the latter molecules are only
fractions of H2. Molecules are formed by atoms and simpler molecules by
chemical reactions either in the gas-phase or in the surfaces of grains. Dust is abundant in molecular clouds. This is essential for the appearance of molecules because H2 forms on the dust particles and helps to build other
molecules. In addition, dust absorbs the UV radiation that would otherwise destroy the molecules.
The interaction of radiation with matter is a complex subject, combining molecular spectroscopy, excitation and radiative transfer. Here I only intro-duce the photon interactions with atoms. It is possible for the photon to interact with atoms and molecules as a particle or a wave. The main ways for this interaction to happen are:
• elastic scattering, where the energy of the photon is not changed by the interaction,
• non-elastic scattering, where the photon is absorbed in the interaction and re-emitted at a different wavelength while the atom or molecule absorbs or gives energy to the emitted photon,
• stimulated absorption, where photon is destroyed while the atom or molecule absorbs the energy and momentum of the photon,
• stimulated emission, where the atom or molecule is in an excited state. This happens when a photon of appropriate energy passes by, and the atom or molecule emits photon of the same frequency as the passing photon, and
• spontaneous emission, where a photon is created when an atom or a molecule relaxes to a lower energy state.
Every line emitted in a given atomic or molecular transition has its natu-ral line width that depends on the Heisenberg’s uncertainty principle accord-ing to which the coordinate x and the impulse parallel to x-axis px have
uncertainties ∆x and ∆pxfor which
∆x∆px≈ h (3.1)
where h =1.0546×10⁻²⁷ erg s, and the uncertainties for energy and time are
∆E∆t≈ h. (3.2)
These uncertainties cause the natural width of the spectrum. This natural width is defined as γ = ∆Ei+ ∆Ef h = 1 Ti + 1 Tf , (3.3)
where the subscript i indicates the initial and f final energy and time. γ is the full width at half maximum (FWHM) of the spectrum.
In reality the FWHM is usually much wider than the natural width of the spectrum, though. This is due to the Doppler effect. Thermal broadening happens because the atoms in the gas move the faster the hotter the gas is. When the observed object is moving away from the observer, the frequency is shifted to longer wavelength (red-shifted) and when the object is moving towards the observer, the frequency is shifted to shorter wavelength (blue-shifted). This causes further widening in the spectra. Also microturbulent motions in the gas and macroscopic motions can cause the widening of the spectra.
3.2 c o
Since its detection in 1970 (Wilson et al., 1970), carbon monoxide (CO) has
been used to trace the molecular component of the interstellar medium both in the Milky Way (e.g., Dame et al., 1987) and in extragalactic (e.g., Rickard et al.,1977) environments. While H2is the most abundant molecule
in the ISM, it is, however, very difficult to observe, since it is a homonuclear diatomic molecule, i.e., it has no permanent electric dipole moment and its electric dipole transitions are forbidden. CO, being the most abundant molecule after H2 (12CO/H2 abundance 2×10⁻⁴,Lacy et al.,1994), and its
isotopologues, like 13CO and C18O, are used as a tracer of the molecular
gas instead of H2.
In addition to being fairly abundant in the ISM, the CO molecule and its isotopologues are relatively stable. They also have a small dipole moment and a large moment of inertia, which means that the energy levels of CO and its isotopologues are closely spaced and easily excited at low tempera-tures. The lines are at millimeter wavelengths and the lowest transitions can be easily observed from the ground. Extensive surveys have been done in
12CO and 13CO over the Galactic plane and of nearby star-forming clouds
3.2 co 27
CO is a simple molecule that forms only through gas-phase reactions and it is fairly stable with a strong binding energy of 11.1 eV. CO has several ob-servable isotopes and the seven lowest rotational transitions are obob-servable from the ground (van Dishoeck and Black,1987). Fig.3.1 shows an energy level diagram of CO featuring some of the rotational transitions. The
ro-Figure 3.1: Level diagram of the rotational levels of CO.
tational levels of CO are very closely spaced, which is why only selected transitions are shown in the diagram. The moment of inertia of the CO molecules is high compared to, e.g. H2, thus, the CO transitions can be
ex-cited even at low temperatures. The energies for the rotational levels are given by:
Erot =
h2
2IJ(J + 1) ≡ BhJ(J + 1) (3.4)
where h =6.6261×10⁻²⁷erg s, and the rotational constant B = h
8π2I in units of frequency.
From CO observations the temperature and column density of the gas can typically be derived.12CO is optically thick in the low- and mid-J
tran-sitions, but its isotopologues, like 13CO and especially C18O, are often not. Thus, they can be used in combination or instead of12CO.
3.3 n2h+
The diazenylium (N2H+) was first detected in the ISM in 1974 (Turner,1974;
Green et al., 1974) and the finding confirmed and the predicted hyperfine
structure resolved a year later (Thaddeus and Turner,1975). Since N2, the
neutral precursor to N2H+ lacks a dipole moment and is, thus, hard to
detect, N2H+ can be used to derive the N2 abundance in molecular clouds
(see, e.g.,Herbst et al.,1977;Hotzel et al.,2004)
Especially the J=1-0 transition has also been used to estimate physical conditions in the interstellar gas (e.g.,Bergin et al.,2002;Tafalla et al.,2004; Lippok et al., 2013). In particular, it has been used to identify cold cores.
N2H+ traces the high density regions of dark clouds as it is less depleted
onto dust grain surfaces than CO and many other molecular species be-cause of the low binding energy of its precursor molecule, N2. Thus, it can
be found in prestellar and protostellar clumps (Bergin and Langer, 1997; Hotzel et al.,2004;Daniel et al.,2006).
The fractional abundance of N2H+ is expected to be constant or even
increase inside the cores (Hotzel et al., 2004; Alonso-Albi et al., 2010),
al-though in some studies it has been found to be depleted in the densest part of the cores (Bergin et al., 2002;Pagani et al., 2007). However, it is formed
primarily via reaction H+3 + N2 → N2H+ + H2, which is a "dense-cloud"
process, thus making N2H+ a good tracer of dense gas (Turner,1995).
3.4 c h+
The methylidyne cation (CH+) was the first interstellar molecular ion ob-served in the interstellar medium via its optical spectrum (Dunham, T.,1937; Douglas and Herzberg,1941). Although it is commonly observed, it is not
very well understood. This is partly due to the fact that its rotational levels lie in the submillimeter range. The energies of the rotational levels can be calculated from the Eq.3.4and the first rotational transitions are shown in Fig.3.2.
The pure rotational spectrum was finally observed in ISM byCernicharo et al.(1997). They observed CH+in the PDR of planetary nebula NGC 7027
and estimated a CH+ column density of 8×1013 cm−2 assuming a size of 600for the PDR. Among other transitions, they observed the transition J=3-2, which also is used in this thesis, but it was blended with the nearby OH (doublet at 119.2 and 119.4 µm). Herschel has finally provided observations of the unblended rotational transitions.
CH+is highly reactive and easily destroyed by reactive collisions with H2,
H, and electrons. However, observations have shown a greater abundance of CH+than what steady-state chemical models in quiescent molecular clouds
have predicted (e.g., van Dishoeck and Black,1986). The excitation of CH+
has been suggested to be dominated by chemical pumping after reaction of C+ with vibrationally excited H
2 which would lead to greater abundance
of CH+ (Godard and Cernicharo, 2013; Nagy et al., 2013). This formation
3.4 ch+ 29
Figure 3.2: Level diagram of the lowest rotational levels of CH+.
suggested that the ro-vibrational energy of the vibrationally excited H2can
be used when available in strong irradiated PDRs and that this energy ac-tually changes the reaction from endothermic to exothermic (e.g., Lambert and Danks,1986;Jones et al.,1986;Agúndez et al.,2010;Naylor et al.,2010; Godard and Cernicharo, 2013; Nagy et al., 2013; Zanchet et al., 2013).
Al-ternatively, in diffuse interstellar clouds with low FUV radiation field and very low density, shocks (e.g.,Pineau des Forets et al.,1986) and turbulence
(e.g., Godard and Cernicharo, 2013) have been proposed to overcome the
high endothermicity.
Lately, the excitation of CH+ observations of the Orion Bar have been
compared to models (Godard and Cernicharo,2013;Nagy et al.,2013;Zanchet et al.,2013). Chemical pumping via vibrationally excited H2 is predicted to
be important to the excitation of all the CH+ rotational lines in the phys-ical conditions prevailing in the warm molecular zone of the Orion Bar. Chemical excitation starts to be significant at transition J=3-2 and for higher transitions it seems to be the driving force (Godard and Cernicharo, 2013; Zanchet et al., 2013). Still, wider maps of CH+ emission and further
3.5 o h
Hydroxyl (OH) is a simple, but an important molecule for the study of the ISM. It is the first molecule that was observed in ISM in radio frequencies (Weinreb et al., 1963). It is a building block of more complex chemistry in
the far ultraviolet (FUV) illuminated gas. Its reaction with H2, C+, O, N, and
S+ leads to the formation of H2O, CO+, O2, NO, and SO+, respectively. In
addition, OH is the product of H2O photodissociation, the main destruction
route of water vapor in the gas unshielded against FUV radiation. With OH observations it is, thus, possible to constrain different chemical routes of oxygen chemistry. OH is strongly paramagnetic and, thus, also widely used to measure the magnetic field in the ISM through the Zeeman effect.
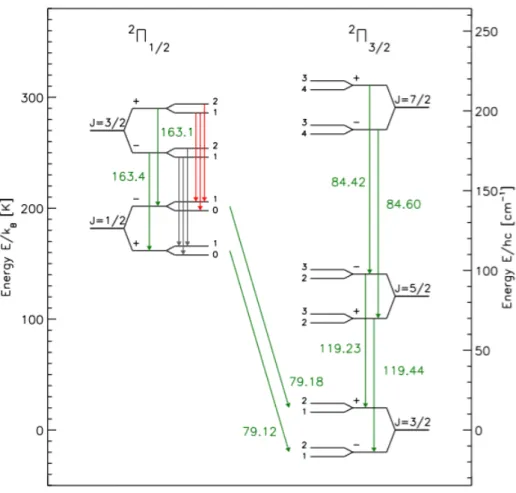
The use for magnetic field measurements is based on the nature of OH as a free radical, having one unpaired electron and, thus, a nonzero elec-tronic angular momentum. While the rotational levels of OH have energies that can be calculated from the Eq.3.4, the rotational levels are also divided into sublevels of nearly equal energy. This Λ-doubling is an interaction be-tween the nuclei rotation and the unpaired electron motion around its orbit. The rotational levels and their sublevels for the transitions relevant to this thesis, can be seen in Fig. 3.3. The use for magnetic measurements is due to the magnetic hyperfine splitting, which can be seen as sublevels of the Λ-doubling in Fig.3.3. Hyperfine splitting is caused by the interaction with the unpaired spin of the proton. The two ladders in the figure correspond to the opposite orientations of the unpaired electron’s spin.
Hydroxyl was first detected in the Orion Bar byGoicoechea et al.(2011).
They observed several transitions towards the CO+peak (α
J2000= 05h35m20.6s, δJ2000= -05◦2501400) in the Bar (Störzer et al.,1995). These were pointed
ob-servations of the Orion Bar and not fully sampled maps. The measured intensities can be seen in Table 3.1. I have included here only the transi-tions relevant to this thesis, but also transitransi-tions at 65 µm and 79 µm were observed.
Table 3.1: PACS OH line intensities towards the Orion Bar PDR (Goicoechea et al., 2011). Iobs (σobs) λ[µm] OH transition [10−5 erg s−1 cm−2sr−1] 119.441 2Π3/2 J= 5/2+− 3/2− 10.09 (0.21) 119.234 2Π3/2 J= 5/2−− 3/2+ 9.44 (0.21) 84.597 2Π3/2 J= 7/2−− 5/2+ 4.07 (0.79) 84.420 2Π3/2 J= 7/2+− 5/2− 2.38 (0.91) 163.396 2Π1/2 J= 3/2−− 1/2+ 1.34 (0.17) 163.015 2Π1/2 J= 3/2+− 1/2− 2.74 (0.16)
All the observed transitions were clearly detected in the Orion Bar. The transitions at 84 µm and 163 µm are of similar intensity, which is not
sur-3.5 oh 31
Figure 3.3: Level diagram of the lowest excited states of OH. Splitting of the levels because of Λ-doubling and hyperfine structure is not to scale. (Wampfler et al.,2010)
prising as they have similar upper level energy temperatures as seen in Fig. 3.3. Goicoechea et al. (2011) found OH emission to be extended, but
cor-relating well with CO and CH+ observations, thus, suggesting a common origin. They also interpreted that the OH emission originates in unresolved dense structures instead of the lower density "interclump" medium. The ob-servations discussed in Chapter 7 cover a larger area and we are thus able to better compare the morphologies of these lines.
The fact that OH has also been found in young stellar objects, Herbig stars, and protoplanetary disks (Wampfler et al., 2010; Fedele et al., 2012; Wampfler et al., 2013; Lindberg et al., 2014) supports the idea, that OH in
the ISM originates in dense structures, although the effect of shocks cannot be always ruled out. It does need a luminous star, since it is difficult to excite the rotational states of OH in quiescent clouds. However, it has been previously thought to be a tracer of diffuse gas (e.g., Neufeld et al., 2002; Dawson et al.,2014;Porras et al.,2014), and has been used widely as a probe
of the local magnetic strength (e.g., Troland and Crutcher, 2008; Asanok et al.,2010;Crutcher et al.,2010;Maeda et al.,2015).
3.6 r a d e x: model for analysis of molecular tracers RADEX1
(van der Tak et al., 2007) is a one-dimensional non-LTE radiative
transfer code2
. It uses uniform density and temperature layer and solves the statistical equilibrium equations assuming local excitation. The equations include collisional and radiative processes including background radiation and it treats optical depth with an escape probability method. The program uses the Leiden Atomic and Molecular Database (LAMDA, Schöier et al.,
2005), which is being expanded and improved continuously.
RADEX is more sophisticated than the rotational diagram which does not solve the radiative transfer (e.g.,Blake et al.,1987;Helmich et al., 1994; Goldsmith and Langer,1999) and comparable to escape probability method
and LVG method (Sobolev,1947;de Jong et al.,1975;Goldreich and Scoville, 1976), but simpler and, in consequence faster, than more complex codes, like
the PDR Meudon code (Le Petit et al.,2006) which computes the physical
conditions in the PDR, namely, density and temperature. It also constrains the column densities of the emitting species. Thus, RADEX is useful in providing a quick estimation of the physics in PDRs. It calculates the es-cape probability assuming a homogenous medium. It predicts the emitted spectrum for the molecular lines, but cannot calculate flux or specific lumi-nosity because it has no knowledge of the geometry of the source. Also, it calculates the intensities for one species at a time, thus, the effects of the line-overlap or different molecules are not taken into account.
The collision rates used depend on temperature and only limited range of temperatures are covered. RADEX uses interpolation or extrapolation to find the temperatures not covered in the database. Temperatures are han-dled well up to 500 K, but higher temperatures as well as high column densities can be problematic. In our CO modeling the high column densi-ties and temperatures did not give reasonable results for hydrogen density of 104 cm−3.
The input parameters for RADEX are 1) the spectral range for the output for which the program then calculates all transitions of the given molecule, 2) the kinetic temperature of the molecular cloud, 3) number of collision partners (maximum of 7 partners), 4) density of each collision partner, 5) equivalent black body temperature of the background radiation (usually taken to be TCMB=2.73 K), 6) molecular column density, and 7) line width
of the molecular lines (assumed the same for all lines).
Radex solves Tex and calculates the intensity, Itν, in erg s-1 cm-2Hz-1 sr-1
of the given species in the given range given by: Itν= Bν(Tex)[1 − e−τ0] + e−τ0Ib
ν. (3.5)
1 Available at:http://www.sron.rug.nl/~vdtak/radex/index.shtml
2 RADEX manual available at: http://home.strw.leidenuniv.nl/~moldata/radex_manual. pdf
3.6 radex: model for analysis of molecular tracers 33
In the equation Ibνis the background emission at line frequency, reduced by
any absorption in the line. Bν(Tex)is given in convenient units:
Bν(Tex) =
3.973 × 10⁻¹⁶˜ν3
exp(1.43883 ˜ν/T ) − 1erg
−1cm−2Hz−1sr−1, (3.6)
where ˜ν is the wave number in cm−1. In the Eq. 3.5 Tex is the excitation temperature, τ0 is the optical depth in the line at the line center. Similarly to
LVG programs, the optical depth, and consequently RADEX results, depend only on the ratio of column density to line width.
In addition to the calculated intensity, RADEX results list the quantum numbers of the upper and lower states, the line frequency, the excitation temperature of that line, the optical depth at the line center, and the Rayleigh-Jeans equivalent of the intensity of the line minus the background intensity.
In chapter8I compare the calculated intensities from RADEX with the in-tensities of CO observations. The comparison gives us the likely CO column density and kinetic temperature for the considered H2 density.
Part II
4
H E R S C H E L O B S E R VAT I O N SIn this chapter I introduce the telescope and describe the observations of the Orion Bar which were used in Chapters 7and8. The work on cold clumps in Chapter 6 is also based on Herschel observations. The molecular lines in the cold clumps were observed from the ground in Onsala. The 20-m radio telescope in Onsala is introduced and observations described in Chapter5.
4.1 i n t r o d u c t i o n t o t h e t e l e s c o p e 4.1.1 Herschel Space Observatory
Herschel Space Observatory is the largest space telescope ever launched with a primary mirror of 3.5 m. It was launched in 14 May 2009. The mission was named after Sir William Herschel, who discovered the infrared radiation in 1800. The mission continued until 29 April 2013, when last of the helium used for cooling the instrumentation of the telescope was evaporated. Dur-ing these four years over 35 000 observations were made. This included more than 25 000 hours of science data for ∼600 observing programs. Over 1 300scientific papers have been published by the end of February 20151.
The telescope was built to do photometry and spectroscopy in 55−671 µm range, a previously mostly unobserved region of the electromagnetic spec-trum2
. The evaporation of the liquid helium was keeping the instruments close to absolute zero, enabling the observations of the cool universe. The main objectives of Herschel were photometric surveys of extragalactic and galactic sky to measure dust-enshrouded star formation, detailed photomet-ric and spectroscopic studies of the physics and chemistry of ISM, obser-vational astrochemistry to understand stellar and interstellar lifecycle, and spectroscopic and photometric study of solar system objects and their atmo-spheres. The mission has also brought us technological advancements for future space missions which are already in use in ESA’s new space missions, including Gaia.
The Herschel Space Observatory measures 7.5 m in height and 4 m in width and weighs ∼3.4 tons. It is constructed almost entirely (∼90 % of mass) of silicon carbide (SiC). The different parts of the satellite are shown in Fig. 4.1. The telescope is a Cassegrain telescope with a primary mirror, 3.5 m in diameter, and a smaller secondary mirror, 30.8 cm in diameter. These are protected by the sunshade. The detectors and receivers (HIFI) of the scientific instruments are located in the cryostat. The detectors are kept at very low and stable temperatures by liquid superfluid helium to make the
1 SAO/NASA Astrophysics Data System (ADS)http://adsabs.harvard.edu/
2 Infrared Space Observatory (ISO) Long Wavelength Spectrometer has a range of 45−200 µm.