HAL Id: hal-02632111
https://hal.inrae.fr/hal-02632111
Submitted on 27 May 2020
HAL is a multi-disciplinary open access
archive for the deposit and dissemination of
sci-entific research documents, whether they are
pub-lished or not. The documents may come from
teaching and research institutions in France or
abroad, or from public or private research centers.
L’archive ouverte pluridisciplinaire HAL, est
destinée au dépôt et à la diffusion de documents
scientifiques de niveau recherche, publiés ou non,
émanant des établissements d’enseignement et de
recherche français ou étrangers, des laboratoires
publics ou privés.
Gene co-expression analysis unravels a link between
C9orf72 and RNA metabolism in myeloid cells
Serge Nataf, Laurent Pays
To cite this version:
Serge Nataf, Laurent Pays. Gene co-expression analysis unravels a link between C9orf72 and RNA
metabolism in myeloid cells.
Acta Neuropathologica Communications, BioMed Central part of
LETTER TO THE EDITOR
Open Access
Gene co-expression analysis unravels a link
between C9orf72 and RNA metabolism in
myeloid cells
Serge Nataf
1,2*and Laurent Pays
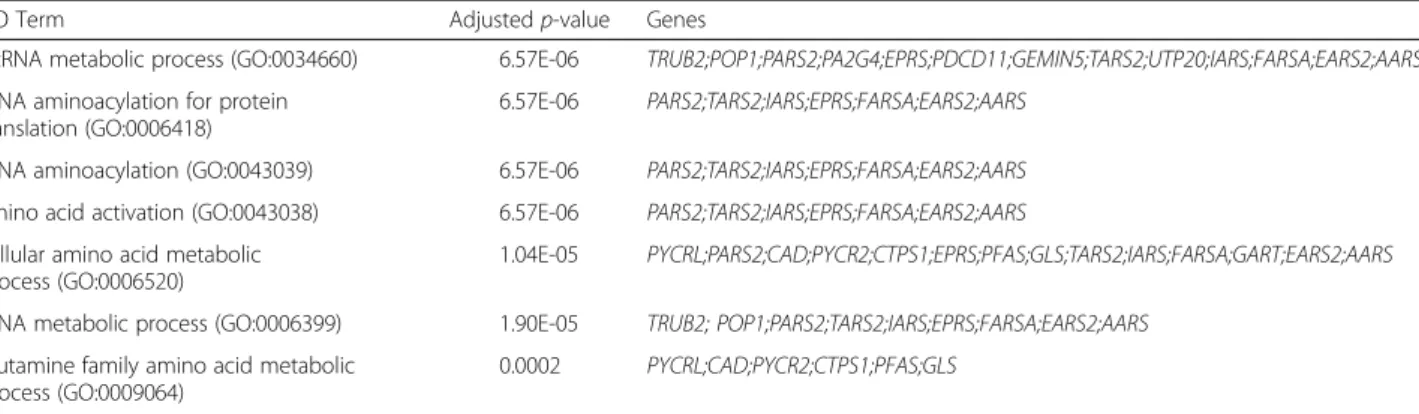
1,2GGGGCC hexanucleotide repeat expansion in the promoter or intronic regions of C9orf72 is responsible for the most common familial forms of amyotrophic lateral sclerosis (ALS) and frontotemporal lobar degeneration (FTLD) [4]. Gain-of-function ofC9orf72, at the mRNA and/or protein level, is currently consid-ered as a major mechanism of neurodegeneration in these patients [2, 5, 7]. To further elucidate the genomic impact of a C9orf72 gain-of-function, we performed a gene co-expression analysis using the open source bioinformatics tool Multi Experiment Matrix (MEM) [1] that covers a large set of human transcriptomic data (n = 1794) on the same expression array platform (Affymetrix HG-U133_Plus_2). This ap-proach allowed us to identify the 100 mRNA species that are overall the most positively correlated with C9orf72 mRNA levels and, conversely, the 100 mRNA species that are the most inversely correlated with C9orf72 mRNA levels. We then used “EnrichR” [3] to assess these two gene lists with regard to their enrichment in subsets of genes sharing the same Gene Ontology (GO) annotations i.e. belonging to the same functional family. While we did not find any significant enrichment in the list of genes whose expression levels were positively correlated with C9orf72, the list of mRNA species that were inversely correlated with C9orf72 was highly significantly enriched in genes annotated with RNA metabolism-related GO terms. These included notably the terms “ncRNA metabolism” (adjusted p-value = 6.57E-6), “tRNA aminoacylation” (adjusted p-value = 6.57E-6)
and “tRNA metabolic process” (1.90E-5). Table 1 shows the full list of GO terms for which a significant enrichment with an adjusted p-value < 0.001 was found. This data shows that an increase of C9orf72 mRNA levels associates with a concomitant downreg-ulation of genes that exert key functions in RNA me-tabolism. Altered RNA metabolism is considered as a key pathological feature in not onlyC9orf72 mutation carriers but also patients bearing mutations inFUS or TDP43 genes as well as sporadic ALS patients [8]. Our observation suggests that an increased expression of non-mutated C9orf72 may similarly trigger RNA me-tabolism alterations. However, the relevance of such a finding in the context of C9orf72 mutation remains to be determined.
Interestingly, among the 1794 microarray expres-sion studies from which C9orf72 inverse correlations were calculated, data sets analyzing the transcrip-tomic profile of myeloid cells, in particular acute myeloid leukemia cells, were by far the most inform-ative i.e. giving rise to the most significant inverse correlations. In addition, it is worth noting that in the BioGPS Affymetrix expression atlas [9], C9orf72 probes are reported to detect much higher C9orf72 mRNA levels in monocytes than in neurons or astro-cytes. Monocytes belong to the myeloid lineage and share many phenotypic and functional properties with microglia, although both cell types derive from distinct progenitors [6]. Therefore, one may consider that a link between C9orf72 and RNA metabolism could similarly occur in microglia. This deserves fur-ther investigation. Finally, our observation suggests that C9orf72 is possibly a key regulator of RNA me-tabolism in acute myeloid leukemia cells.
* Correspondence:serge.nataf@inserm.fr
1Lyon 1 University, CarMeN Laboratory, INSERM U-1060, INRA USC-1235,
69921 Oullins, France
2Banque de Tissus et de Cellules des Hospices Civils de Lyon, Hôpital
Edouard Herriot, Place d’Arsonval, 69003 Lyon, France
© 2015 Nataf and Pays. Open Access This article is distributed under the terms of the Creative Commons Attribution 4.0 International License (http://creativecommons.org/licenses/by/4.0/), which permits unrestricted use, distribution, and reproduction in any medium, provided you give appropriate credit to the original author(s) and the source, provide a link to the Creative Commons license, and indicate if changes were made. The Creative Commons Public Domain Dedication waiver (http://creativecommons.org/publicdomain/zero/1.0/) applies to the data made available in this article, unless otherwise stated.
Nataf and Pays Acta Neuropathologica Communications (2015) 3:64 DOI 10.1186/s40478-015-0242-y
Competing interests
The authors declare that they have no conflict of interest. Authors’ contribution
SN and LP carried out the bioinformatics analyses and wrote thepaper. All authors read and approved the final manuscript.
Received: 8 September 2015 Accepted: 7 October 2015
References
1. Adler P, Kolde R, Kull M, Tkachenko A, Peterson H, Reimand J et al (2009) Mining for coexpression across hundreds of datasets using novel rank aggregation and visualization methods. Genome Biol 10:R139. doi:10.1186/gb-2009-10-12-r139 2. Chan HYE (2014) RNA-mediated pathogenic mechanisms in polyglutamine
diseases and amyotrophic lateral sclerosis. Front Cell Neurosci 8:1–12. doi:10.3389/fncel.2014.00431
3. Chen EY, Tan CM, Kou Y, Duan Q, Wang Z, Meirelles GV et al (2013) Enrichr: interactive and collaborative HTML5 gene list enrichment analysis tool. BMC Bioinformatics 14:128. doi:10.1186/1471-2105-14-128
4. DeJesus-Hernandez M, Mackenzie IR, Boeve BF, Boxer AL, Baker M, Rutherford NJ et al (2011) Expanded GGGGCC hexanucleotide repeat in noncoding region of C9ORF72 causes chromosome 9p-linked FTD and ALS. Neuron 72:245–56. doi:10.1016/j.neuron.2011.09.011
5. Gendron TF, Belzil VV, Zhang Y-J, Petrucelli L (2014) Mechanisms of toxicity in C9FTLD/ALS. Acta Neuropathol 127:359–76. doi:10.1007/s00401-013-1237-z 6. Prinz M, Mildner A (2011) Microglia in the CNS: immigrants from another world.
Glia 59:177–87. doi:10.1002/glia.21104
7. Rohrer JD, Isaacs AM, Mizlienska S, Mead S, Lashley T, Wray S et al (2015) C9orf72 expansions in frontotemporal dementia and amyotrophic lateral sclerosis. Lancet Neurol 14:291–301. doi:10.1016/S1474-4422(14)70233-9 8. Sreedharan J, Brown RH (2013) Amyotrophic lateral sclerosis: problems and
prospects. Ann Neurol 74:309–16. doi:10.1002/ana.24012
9. Wu C, Macleod I, Su AI (2013) BioGPS and MyGene.info: organizing online, gene-centric information. Nucleic Acids Res 41:D561–5. doi:10.1093/nar/gks1114
Submit your next manuscript to BioMed Central and take full advantage of:
• Convenient online submission
• Thorough peer review
• No space constraints or color figure charges
• Immediate publication on acceptance
• Inclusion in PubMed, CAS, Scopus and Google Scholar
• Research which is freely available for redistribution
Submit your manuscript at www.biomedcentral.com/submit
Table 1 Enrichment analysis of genes inversely correlated with C9orf72 mRNA levels
GO Term Adjustedp-value Genes
ncRNA metabolic process (GO:0034660) 6.57E-06 TRUB2;POP1;PARS2;PA2G4;EPRS;PDCD11;GEMIN5;TARS2;UTP20;IARS;FARSA;EARS2;AARS tRNA aminoacylation for protein
translation (GO:0006418)
6.57E-06 PARS2;TARS2;IARS;EPRS;FARSA;EARS2;AARS tRNA aminoacylation (GO:0043039) 6.57E-06 PARS2;TARS2;IARS;EPRS;FARSA;EARS2;AARS amino acid activation (GO:0043038) 6.57E-06 PARS2;TARS2;IARS;EPRS;FARSA;EARS2;AARS cellular amino acid metabolic
process (GO:0006520)
1.04E-05 PYCRL;PARS2;CAD;PYCR2;CTPS1;EPRS;PFAS;GLS;TARS2;IARS;FARSA;GART;EARS2;AARS tRNA metabolic process (GO:0006399) 1.90E-05 TRUB2; POP1;PARS2;TARS2;IARS;EPRS;FARSA;EARS2;AARS
glutamine family amino acid metabolic process (GO:0009064)
0.0002 PYCRL;CAD;PYCR2;CTPS1;PFAS;GLS
A gene enrichment analysis was performed on the list of top 100 genes that are the most inversely correlated with C9orf72 mRNA levels. Left column: GO terms for which enrichment was found; middle column: p-values adjusted from Fisher exact test; right column: C9orf72 inversely correlated genes annotated with the corresponding GO term. AARS: alanyl-tRNA synthetase; CAD: carbamoyl-phosphate synthetase 2, aspartate transcarbamylase, and dihydroorotase; CPTS1: CTP synthase 1; EARS2: glutamyl-tRNA synthetase 2, mitochondrial; EPRS: glutamyl-prolyl-tRNA synthetase; FARSA: phenylalanyl-tRNA synthetase, alpha subunit; GART: phosphoribosylglycinamide formyltransferase, phosphoribosylglycinamide synthetase, phosphoribosylaminoimidazole synthetase; GEMIN5: gem (nuclear organelle) associated protein 5; GLS: glutaminase; IARS: isoleucyl-tRNA synthetase; PA2G4: proliferation-associated 2G4, 38kDa; PARS2: prolyl-tRNA synthetase 2, mitochondrial (putative); PDCD11: programmed cell death 11; PFAS: phosphoribosylformylglycinamidine synthase; POP1: processing of precursor 1, ribonuclease P/MRP subunit (S. cerevisiae); PYCR2: pyrroline-5-carboxylate reductase family, member 2; PYCRL: pyrroline-5-carboxylate reductase-like; TARS2; threonyl-tRNA synthetase 2, mitochondrial (putative); TRUB2: TruB pseudouridine (psi) synthase family member 2; UTP20: UTP20, small subunit (SSU) processome component, homolog (yeast)