UNIVERSITÉ DU QUÉBEC
MÉMOIRE PRÉSENTÉ À
L'UNIVERSITÉ DU QUÉBEC
À
TROIS-RIVIÈRESCOMME EXIGENCE PARTIELLE DE LA MAÎTRISE EN GÉNIE ÉLECTRIQUE
PAR CHAO LI
THE OPTIMIZA TION OF HYDROGEN CONSUMPTION BASED ON THE CONTROLLING OF CHARGING CIRCUIT
IN NEMO HYBRID ELECTRIC VEHICLE
Université du Québec à Trois-Rivières
Service de la bibliothèque
Avertissement
L’auteur de ce mémoire ou de cette thèse a autorisé l’Université du Québec
à Trois-Rivières à diffuser, à des fins non lucratives, une copie de son
mémoire ou de sa thèse.
Cette diffusion n’entraîne pas une renonciation de la part de l’auteur à ses
droits de propriété intellectuelle, incluant le droit d’auteur, sur ce mémoire
ou cette thèse. Notamment, la reproduction ou la publication de la totalité
ou d’une partie importante de ce mémoire ou de cette thèse requiert son
autorisation.
Summary
The project of the thesis is the economic optimization of the electric vehicle.
It
is to
predict the hydrogen consumption and improve the energy efficiency of the Nemo. In the
operating process
, hydrogen consumption, the battery life decrease and the aging of fuel
cell are the three main parts of the operating cost. This optimization will begin with the se
parts. Computation,
simulation and mathematics modeling are included in the process of
optimization. AlI these results are simulating the real operating status of the low speed
hybrid electric truck - Nemo.
The Nemo truck which is designed and manufactured in Quebec is a low speed hybrid
electric vehicle (HEV) which has incredible agility and solid dependability. A proton
exchange membrane fuel cell (PEMFC) is equipped on as its generator in which hydrogen
is used as its fuel. 9 series of 8V V.S. battery are used for supplying the electricity to the
motor. The simulator is designed to reproduce the operating status which includes a
dynamic model, a lead-acid batteries model and a PEMFC model.
The first objective is to optimize the operating co st through controlling the switching time
of the fuel cell. The switching time is important in the operating process because early
starting will consumes more hydrogen and late starting will cause the decrease of battery
life. Therefore, this optimization is to find an appropriate time point when the sum of total
cost is the lowest.
The second work is to optimize the charging circuit. The automatically switching circuit
and an adjustable charging resistor are included. The automatically switching circuit is to
improve the fault tolerance during the operating process.
It
can avoid the unnecessary
deepening of the depth of discharge which willshorten the life of battery. The
participation of the adjustable resistance is to control the charging current.
It
can keep the
SOC at the set level stably. Meanwhile,
it can also increase the charging efficiency and
reduce the depth of discharging.
As a preliminary study of the energy management
,
the results of the simulation and the
optimization are satisfactory
.
Through predicting the operating status
,
the total cost can be
controlled effectively. Additionally
,
the results indicate that the charging methods and the
form of charging affect the battery life significantly.
Résumé
Le projet de la thèse est l'optimisation économique du véhicule électrique hybride Nemo.
n
s'
agit de prévoir la consommation d'hydrogène et d'améliorer l'efficacité énergétique du
Nemo
.
Dans le processus de fonctionnement,
la consommation de l'hydrogène,
la
diminution de la durée de vie de la batterie et le vieillissement de la pile à combustible
sont les trois principaux éléments du coût de fonctionnement. Cette optimisation
commence par l'analyse de ces parties. Les calculs,
la simulation et la modélisation
mathématique sont inclus dans le processus d'optimisation. Tous les résultats simulent
l'état réel de fonctionnement du électrique hybride - Nemo.
Le camion Nemo qui est conçu et fabriqué au Québec est un camion électrique hybride à
faible vitesse a une incroyable agilité et une bonne fiabilité
.
Une PEMFC est équipé
comme générateur électrique. L'hydrogène est utilisé comme combustible. Neuf batteries
de 8 V sont utilisées pour fournir de l'électricité au moteur. Le simulateur est conçu pour
reproduire l'état de fonctionnement qui comprend un modèle dynamique
, un modèle de
batteries plomb-acide et un modèle PEMFC.
Le premier objectif est d'optimiser les coûts de fonctionnement en contrôlant le temps de
commutation de la pile à combustible. Le temps de commutation est important dans le
processus d'exploitation parce que commencer trop tôt augmente la consommation
d'hydrogène et commencer trop tard entraînera la diminution de la vie de la batterie. Par
conséquent, cette optimisation constitue à trouver un point de moment approprié, lorsque
la somme du coût d
'
usure et de carburant est le plus bas.
Les deuxième travaux sont constitués par l'
optimisation du circuit de charge. Le circuit de
commutation automatique et une résistance de charge réglable sont inclus. Le but du
circuit de commutation automatique est l'amélioration de la résistance aux pannes au
cours du processus d'exploitation.
n peut diminuer la profondeur de décharge qui va
raccourcir la vie de la batterie. Lebut de la résistance réglable e
s
t de contrôler le courant
de charge. Il peut garder le SOC de manière stable au niveau par défaut. En outre
,
il peut
augmenter l
'
efficacité de charge et la réduction de la profondeur de décharge.
Comme étude préliminaire de la gestion de l'énergie
,
les résultats de la simulation et
l'optimisation sont satisfaisants. Par la prédiction de l'état de fonctionnement
,
le coût total
peut être contrôlé efficacement. En outre
,
les résultats indiquent que les méthodes de
charge et l
'
intensité de la forme de charge affectent la vie de la batterie de manière
significative
.
Acknowledgements
Obviously,
such a research is not to
be
done by one person and is the result of
collaboration between multitudes of individuals. Although many have contributed in one
way or another to the success of this project, it is impractical to list themall here
. Thus,
here are the thanks that are needed for the main contributors to this document.
First and foremost,
1 am most grateful to my supervisor,
Professor Kodjo Agbossou
Professor Yves
Dube
,
whose useful suggestions,
incisive comments and constructive
criticism have contributed greatly to the completion of this thesis. They de vote a
considerable portion of their time to reading my manuscripts and making suggestions for
further revisions. Their tremendous assistance in developing the framework for analysis
and
in
having go ne through the draft versions of this thesis several times as weIl as her
great care in life de serve more thanks than 1 can find words to express.
Secondly, 1 want to thank my parents who give me financial support. l'm also grateful to
my wife who encourages my studies and takes care of my new bom daughter.
Finally,
1 want to gratitude Professor Loïc Boulon,
Professor
.
Sousso Kelouwani,
Francois Martel and Khalid Ettihir who are my colleague
in
my research work. They
always give me the crucial help when 1 was confusing with my project.
1 am also greatly indebted to aIl my teachers who have helped me directly and indirectly
in my studies. Any progress that 1 have made is the result of their profound concem and
selfless devotion.
Table of Contents
Summary ... i
Résumé ... iii
Acknowledgements ... v
Tables List ... viii
Figures List. ... ix
List ofSymbols ... xi
Chapter 1 - Introduction ... 1
1.1 Fuel cell ... 1
1.1.1 Classification and characteristics ... 2
1.1.2 PEMFC ... 6
1.1.3 Electric vehicle ... 10
1.2 Introduction of the devices ... 15
1.2.1 Nemo-fuel cell electric vehicle ... 15
1.2.2 Basic principles of the Nemo ... 17
1.2.3 Utilization of battery series ... 18
1.2.4 Utilization of PEMFC ... 19
1.3 Chapter summary ... 20
Chapter 2 - CUITent Situation and Expected Optimization ... 22
2.1 Existing optimization ... 22
2.1.1 Energy management of fuel cell ... 22
2.1.2 Energy management of battery ... 24
2.2 Objective and expected optimization -Energy management of charging system ... 25
2.2.1 Flow chart ofNemo truck ... 26
2.2.2 Battery status ... 27
2.2.3 Cycles ofbattery charging ... 29
2.2.4 Aging co st of fuel cell system ... ~ ... 30
2.2.5 Cost ofbattery ... 31
2.2.6 Present hydrogen consumption of fuel cell ... 31
2.2.7 Cost economization ... 33
2.3 Chapter summary ... 34
Chapter 3 - Simulation ... 36
3.1 Basic model ofNemo truck ... 36
3.2 Physics and mathematics models of the Nemo ... 37
3.2.1 Dynamic model ... 37
3.2.2 Power demand ... 39
3.3 Voltage distribution offuel Cell ... 41
3.3.1 Nernst equation ... 42
3.3.2 Activation ... 43
3.3.3 Ohmic over-potential ... 44
3.4 Hydrogen consumption ... 47
3.5 Battery state ... 48
3.5.1 Power transferring among fuel cell, battery and motor ... 49
3.5.2 Charging-discharging circuit ... 50
3.6 Chapter summary ... 52
Chapter 4 - Optimization of the Nemo truck ... : ... 53
4.1 Hydrogen and battery loss consumption ... 53
4.2 Starting time optimization of the fuel cell ... 55
4.3 Optimization of the circuit ... 57
4.3.1 Monitoring and controlling of the SOC ... 57
4.4 Further modified circuit ... 58
4.5 New charging circuit with variable resistor ... 59
4.6 Chapter summary ... 63
Chapter 5-5.1 Conclusions and discussion ... 64
Discussion of the results observed ... : ... 64
5.2 Prospects and future work ... 65
References ... 66
Chapter 6 - Appendix A-Résumé du travail de recherché ... 72
6.1 Introduction ... 72
6.1.1 Travaux existants ... 72
6.2 Modélisation de Nemo ... 75
6.2.1 Modèle dynamique ... 77
6.2.2 Modèle du fuel cell ... 77
6.2.3 État de la batterie ... 78
6.2.4 Consommation d'hydrogène ... 79
6.3 Optimisation de la Nemo ... 80
6.3.1 L'optimisation des temps de départ ... 80
6.3.2 Optimisation du circuit ... 81
6.3.3 Poursuite de l'optimisation de la résistance de charge ... 82
6.3.4 Caculation de l'optimisation des ecnomy ... 83
6.4 Conclusion ... 85
Appendix B Technical Specifications Manufacturer ... 87
Tables List
Table 1-1. Operation parameters ofsome common used fuel cells[6] ... 2
Table 1-2. Original specifications of Nemo truck ... 17
Table 1-3. Parameters of 8V V.S Battery ... 19
Table 1-4. Parameters ofAxane® PEMFC ... 20
Table 3-1. Mechanical operating parameters of Nemo truck ... 40
Table 4-1. Data of simulation (137000 second; 100 UDDS loops) ... 56
Table 4-2. Comprehensive data analysis ... 61
Figures List
Figure 1-1. Fuel cell block diagraml4] ... 1
Figure 1-2. Structure of alkaline fuel cells[8) ... 3
Figure 1-3. Operating principle of solid oxide fuel cell[2] ... 4
Figure 1-4. Operating principle of molten carbonate fuel cell[2] ... 6
Figure 1-5. Schematic of a single typical proton exchange membrane fuel cell[ 16] ... 8
Figure 1-6. Structure and principle of proton exchange membrane fuel cell[l7] ... 8
Figure 1-7. Full electric vehicle and the charging device[23] ... 11
Figure 1-8. Classification of different type hybrid electric vehicles[24] 125] ... 12
Figure 1-9.Hybrid electric vehicle[28] ... 13
Figure 1-10.The concept model offuel cell electric vehicles[29] ... 15
Figure 1-ll.Characteristic and parameters of Nemo electric truck[33] ... 16
Figure l-12.Exterior and interior of Nemo ... 16
Figure 1-13. System model of Nemo HEV ... 17
Figure 1-14. 8V deep cycle V.S Battery[34] ... 18
Figure 1-15. AXANE® PEMFC[36] ... 19
Figure 2-1. Energy distribution in the fuel cell[39] ... 23
Figure 2-2. Synoptic of a fuel cell system and the model of the air supply management system[39] .... 23
Figure 2-3. Original Nemo EV architecture and modified Nemo HEVarchitecture[41] ... 24
Figure 2-4. Block diagram of the Nemo[41] ... 25
Figure 2-5. Charging circuit of PEMFC-battery[41 J ... 25
Figure 2-6. Flowchart of Nemo's operating principle ... 26
Figure 2-7. Ideal graph of discharging and charging ... 28
Figure 2-8. Capacity of battery status ... 29
Figure 2-9.Relationship between depth of discharge and Iife cycles of battery[46] ... 30
Figure 2-10.Hydrogen charging consumption curve from SOC 0%-100% ... 32
Figure 2-11. Charging efficiency and SOC in different charging stages[48J ... 33
Figure 2-12. Curve of the operating cost ... 34
Figure 3-l.The force which was received by the vehicle during the process of driving ... 37
Figure 3-2. UDDS cycle (1370 seconds) of Nemo ... ; ... 40
Figure 3-3. Acceleration of the Nemo ... 41
Figure 3-4. Ohmic over-potential caused by semi-contact ... 44
Figure 3-5.Relationship of current and voltage of PEMFC ... 46
Figure 3-6. a: Integration of the hydrogen consumption; b: The process of discharging and charging (retlected by SOC) ... 47
Figure 3-7.Battery SOC of discharge-charge & hydrogen consumption, a: Discharge and switch on fuel cell at 5% (SOC); b: Charge from 45%-95% (SOC) ... .48
Figure 3-9. Battery status in the operating process without charging ... 51
Figure 4-1. Cost of hydrogen consumption ... 54
Figure 4-2. Cost of battery life loss ... 54
Figure 4-3.Cost curve of battery loss + hydrogen consumption + fuel cell aging ... 55
Figure 4-4. Present charging-discharging circuit ... 57
Figure 4-5. Optimized automatically-manually control of the charging circuit ... 57
Figure 4-6. Flowchart of automatically-manually charging circuit ... 58
Figure 4-8. Hydrogen consumption and charging curve of SOC limit 75% ... 59
Figure 4-9.The charging circuit with variable resistance installed ... 60
Figure 4-10. Charging situation after increase the charging current ... 60
Figure 4-11. Hydrogen consumptions comparison of original and optimized models ... 62
Figure 4-12. Comparison of the total cost ... 63
Figure 6-1. Original Nemo EV architecture and modified Nemo HEV architecture[41] ... 73
Figure 6-2. Schéma du système de commande de puissance dans le Nemo[41] ... 74
Figure 6-3. Le circuit de charge fourni par PEMFC[41] ... 75
Figure 6-4. Modèle de système de la NEMO ... 76
Figure 6-5. Ordinogramme du principe de fonctionnement de Nemo ... 76
Figure 6-6. Cycle de UDDS (1370 secondes) et l'accélération de Nemo ... 77
Figure 6-7. Relation de la tension actuelle et des PEMFC ... 78
Figure 6-8. Batterie SOC de décharge-charge et la consommation d'hydrogène, un: décharge et l'interrupteur sur la pile à combustible à 5% (SOC); b: Charge de 45% -95% (SOC) ... 79
Figure 6-9. a: Intégration de la consommation d'hydrogène; b: SOC de la batterie ... 80
Figure 6-10. Le coût de l'hydrogène et le coût de la batterie ... 80
Figure 6-11. La consommation totale de la Nemo ... 81
Figure 6-12. Circuit de charge actuel et modidié ... 81
Figure 6-13. Organigramme du circuit de charge automatiquement et manuellement ... 82
Figure 6-15. Amélioration de la résistance variable ... 82
Figure 6-16. Charge situation après modifiée ... 83
List of Sym bols
Acost=
price conversion of hydrogen ($jmol
--+$jkg)
Aaero= the contact area of the windshield and the air
u
acc=
the accleration of vehicle
Ured/ox
=
chemical activity of oxidized and reduced (activity
= concentration
x
activity coefficient, where [ox]is oxidized, [red]is reduced)
C
rr=
the coefficient of friction
C
x=
the drag coefficient
CCh
=
charging cycles during the operating process
Ecell
=
cell voltage (V)
Er,T,P
=
reversible voltage according to temperature and pressure (V)
F =
the faraday constant (96,485.3365 Cjmol)
F
acc=
the power of acceleration
Fr
=
the friction power of tire
F
ad=
the resistance of aerodynamic drag
F
cr=
the resistance of climbing
9
=
the gravit
y (9.8N
jkg)
1
Re=
the recharging current (A)
I
ch=
charging current (A)
i
cell=
the current density of the cell (Ajcm
2) iL= the loss of current (Ajcm
2)io
=
the exchange current reference (Ajcm
2)ium
=
the current density limit(Ajcm
2)
LB
=
life of battery
mtotal
=
the mass of vehicle and fuel eell
N
fe=
the number of fuel cell series
neleetron
=
the number of electrons involved in the reaction(mol)
nhalf=
the number of half - electron transfer reaction (mol)
nB=
number of batteries
nf
=
the number of fuel eell series
PB
=
single battery priee
P
fuel=
the priee of fuel (hydrogen)
Ri=
the internal resistance (fl/cm
2)Rgas
=
the ideal gas constant
(8.314472J
x
K-
1x
mol-
1)t'
=
modified charging time which is shortened by pulse charging method
T
=
the temperature (K)
aslop
=
the slop of ground
Utransfer
=
the transfer coefficient (n/a)
Pair=
the density of air
À
=
empirical factor of the water content in proton exchange membrane
11
=
Faraday efficiency of fuel eell
[oxidized]/[reduced] It represeIits the concentratjon of all the substances
jnvolved jn the electrode reactÏon ratÏo of the concentratÏon of the product and the
product of the reactjon products. And the concentratjon should be equal to the
square oftheÏr second coeffjdent jn the electrode reactÏon
Chapter 1
-
Introduction
The purpose of this chapter is to describe the background and status of the new energy
industry. The classification and the characterization of the fuel cell and electric
vehicles
will be introduced in this chapter. Additionally, the study will be launched around the
hybrid electric truck - Nemo.
1.1
Fuel cell
Fuel cell is a generator which produces electricity by the chemical energy. Hydrogen is
mostly used as the fuel, sometime, hydrocarbons such as natural gas and alcohols
like methanol are also used[l].
In 1838, the first fuel cells were invented. A century later, NASA uses the fuel cell to
supply the power for probes, satellites and space capsules[2]. From then on, the fuel cell
became
widely use in many area, such as: forklifts, automobiles, buses, airplanes
,
boats,
motorcycles and submarines[1][3].
Figure 1-1. Fuel cell block diagram[4]
Fuel cells have many varieties,
such
as alkaline fuel cell, phosphoric acid fuel cell, molten
carbonate fuel cell, etc. They are made up of three adjacent segments: the anode,
the electrolyte and the cathode. Two chemical reactions occur at the interfaces of the three
different segments. The net result of the two reactions is that fuel is consumed and at the
same time water and carbon dioxide is produced as byproducts
.
The main production is
electric current[ 5].
1.1.1 Classification and characteristics
Fuel cell can be classified in many species and the y are designed separately by their
required working environment. According to their operating temperature, efficiency
,
volume and power, they can be equipped on different devices or buildings. In the
researching and developing of electric vehicles
,
an important classification rule is the
operating temperature [1].
Sorne popular species of fuel cells are introduced in the following table:
Table 1-1. Operation parameters of some common used fuel cells [6]
Fuel ceIl name
Alkaline fuel
cell (AFC)
Proton
exchange
membrane fuel
ceIl (PEMFC)
Phosphoric
acid fuel ceIl
(PAFC)
Molten
carbonate fuel
cell (MCFC)
Planar Solid
oxide fuel cell
(S0FC)
alka1ine carb
6
nate
<
100
MW
.0perating
Efficiency
(cell)
60-70%
50-70%
55%
55%
60-65%
55:-,60%
Compared with the other types of fuel cell (Table 1-1)
,
PEMFC is the best candidate to be
system efficiency and the output power of PEMFC are not the highest, the low operating
temperature is the most important element in the auto motive area.
It doesn
't need to be
outfitted additional insulation and heat dissipation devices.
1.1.1.1 AFC
Alkaline fuel cell (AFC) technology is the first proven fuel cell technology which is
applied in NASA's space program[7].
Figure 1-2. Structure of alkaline fuel cells[8]
The electrolyte used in the AFC is the aqueous solution or a stable potassium hydroxide
matrix. In most types of fuel ce Il
,
hydroxyl moves from the cathode to the anode and
reacts with hydrogen to generate water and ions. However,
the reaction of AFC is
different. These electrons are used to provide energy to an external circuit. Then,
these
electrons return to the cathode and react with oxygen to generate more hydroxyl ions.
Anode reaction:
Cathode reaction:
2Hz
+
40H-
--74HzO
+
4e-The operating temperature of the alkaline fuel cell is about 80°C. 4e-Therefore, the start time
cornes short. However, its electricity density is ten times lower than the proton exchange
membrane fuel cell. Additionally, being installed in vehicles makes the AFC appear to be
clumsy. But their production cost is the lowest among aIl the fuel cells. That is why they
can be used as the small stationary power generation apparatus.
Alkaline fuel cells are very sensitive to carbon monoxide ànd other impurities will pollute
the catalysts[9]. In addition
,
the electrolyte should not contain carbon because the carbon
dioxide can react with potassium hydroxide and form potassium carbonate. Under the se
situations
,
the fuel cell 's performance will be lowered
.
1.1.1.2 SOFC
A solid oxide fuel cell (SOFC) is an electrochemical conversion device which produces
electricity directly from oxidizing fuel. Solid oxide fuel cell (Solid Oxide Fuel Cell
,
referred SOFC) is the third generation fuel cell. The chemical will be stored in a direct
fuel and oxidizer at high temperature
.
It is generally considered to be widely applied in
the future.
oJu.d 'Gnes
out:
Figure 1-3. Operating principle of solid oxide fuel cell[2]
In all fuel cells
,
SOFC operating temperature is the highest. l t belongs to the type of high
temperature fuel cells. In recent years
,
distributed power station became an important part
of the world's energy supply due to its low cost
,
high maintainability and sorne other
advantages. Since SOFC power generation has high exhaust temperatures
,
has high value
in use
,
can provide natural gas reforming heat required can also be used to pro duce steam.
Additionally
,
the composition cycle of the gas turbine is the ideal mode of distributed
generation. Fuel cells
,
gas turbines
,
steam turbines and other co-generation system not
only have high power generation efficiency
,
but also have low-pollution environmental
benefits
.
1.1.1.3 PAFC
Presently, phosphoric acid fuel cell (PAFC) is a fuel cell which grows faste st in
cornmercialization. Phosphoric acid solution is used as the electrolyte in PAFC which is
usually placed in the silicon carbide substrates. The operating temperature of phosphoric
acid fuel cell is slightly higher than the proton exchange membrane fuel cells. However
,
the expensive platinum electrode catalyst in si de which is used to accelerate the reaction is
still irreplaceable[IOl
Anode reaction:
Cathode reaction:
Overall cell reaction:
2H
2+
O
2 -+2H
20
The efficiency of phosphoric acid fuel cell is lower than other fuel cells (about 40%).
Simultaneously, the heating time is longer than others.
1.1.1.4 MCFC
Molten carbonate fuel cell (MCFC) is a high temperature fuel cell (about 650
°
C).
It
uses a
molten carbonate salt suspended in a porous ceramic matrix as the electrolyte. Salts
cornmonly used include lithium carbonate, potassium carbonate and sodium
carbonate[ll].
Figure 1-4.
Operating
principle of molten carbonate fuel cell[2]
The reaction principle is as follows:
Anode:
Cathode:
Total:
O
2+
2H
2 ~2H
20
It has features such as high efficiency (greater than 40
%
)
,
low noise
,
no pollution
,
fuel
diversification (hydrogen gas
,
natural gas and bio-fuels etc
.
)
,
waste heat utilization of
high-value and low-cost battery construction materials and many other advantages.
It
hopes to be the green energy storage in the next century[12].
Molten carbonate fuel cells (MCFC) can also use NiO as the porous cathode. However
,
since the NiO which dissolved in molten carbonate can be reduced to Ni by H
2and CO.
This easily provokes a short circuit.
1.1.2
PEMFC
Proton exchange membrane fuel cell (PEMFC) uses a water-based and acidic polymer
membrane as its electrolyte. The platinum-based is used as the electrodes[13]. The single
unit cell is composed of an anode
,
a cathode and a proton ex change membrane. Hydrogen
in anode reacts with the oxygen in cathode through the proton ex change membrane.
Additionally, the catalyst on the electrode will accelerate this
slow reaction[14].
1.1.2.1 Principle of PEMFC
Anode reaction:
Cathode reaction:
Overall reaction:
1
H
2+'2°2
~H
2
0
Since the proton exchange membrane on1y conducts protons. Therefore, the proton
ex change membrane can directly reach the cathode and the electrons can on1y
go
to the
cathode through the external circuit. When electrons flow to the cathode through the
external circuit, CUITent is generated. Superimposing several fuel cells can build up the
fuel ceIl stack in order to match the different output voltage requirements in the practical
application.
1.1.2.2 Structure
In the central of the PEM fuel ceIl, the membrane electrode assembly (MEA) is set
(Figure 1-5).
It
is typically sandwiched by two flow field plates that are often mirrored.
This structure can make a bipolar plate that is easily to be series connected when the ceIls
should be stacked for greater voltages. The MEA consists of a proton ex change
membrane, catalyst layers, and gas diffusion layers (GDL). These components are
fabricated separately and then pressed to together at high temperatures and pressures[15].
EIcl<uI~Cl .. uit
(~O%·6()% *ffi<:lenoy)
Figure 1-5.
Schematic
of a
single typical
proton exchange membrane fuel
cell[16]
Figure 1-6. Structure and principle
of proton
exchange membrane fuel cell[17]
Figure
1-6
is the intuitive diagram of a single
PEMFC.
Hydrogen in the anode meets the
oxygen in the cathode at the proton exchange membrane in the interlayer between the
electrodes. Then electricity will be produced and transported into the circuit. Heat and
water will be exhausted as the byproducts. Then
,
the unused hydrogen (mixed in the
water) will
be
exhausted with the water. After recyc1ing and dehydration
,
the hydrogen
will be reused.
1.1.2.3 Characteristics
Proton exchange membrane fuel cell has following advantages:
The generating process does not involve hydrogen combustion. Thus, it is not limited by
the Carnot cycle and improves energy conversion rate. In the process of power generating,
there is almost "0"
pollution noise. Generating units is integrated, Therefore, this
generating system is modular and high reliability .. At the same time,
maintenance and
assembly are very convenient. Therefore, this power is a green power which is clean and
efficient.
Typically,
the operating of PEMFC requires a senes of auxiliary equipments which
constitutes the generating system. The generating system of PEMFC consists of the stack,
hydrogen supply systems, water and heat management systems,
power conversion,
control systems and other. The stack system is the core of generating systems. PEMFC
has sorne obvious advantages such as: low temperature, fast starting, simple structure and
easy operating[18][19].
1.1.2.4 Application
After many years of researching and application developing, PEMFC has already got the
substantial progress for automotive power. Miniature and small portable PEMFC and has
reached giant achievements. Additionally,
medium and large PEMFC power generating
system has also achieved sorne results. Since the PEMFC is expired to become the main
development direction in mobile equipment,
backup power supply and sorne special
buildings[20]. In the study of altemate hydrogen power systems,
the researching is not
only being focused on the fuel cells. The stack quality, efficiency and reliability are also
important in the application which includes:
2. fuel cells
'
adaptability to the environment
3
.
output compensation and power conversion technology
4. parallel operating and controlling of the generator
5. altemate hydrogen and hydrogen storage
6
.
air (oxygen) supplying
7. hydrogen monitoring and emission
8. development of automation equipment and control systems in hydrogen power plant
9. construction of the power plant and sorne other application[21]
1.1.3
Electric vehicle
Electric vehicle (EV) is a vehicle which uses the automotive battery as its power to drives
wheels by the electric motor. As a vehicle
,
it also needs to follow the road specifications
,
safety regulations and other transportation requirements. Compared with the conventional
cars
,
the electric vehic1es impact environment fewer. Thus
,
its prospects àre promising
widely.
In their power systems
,
electric vehic1es can be c1assified to: pure electric vehic1es (EV)
,
hybrid electric vehic1e (PHEV) and fuel cell vehicles (FCEV)[22].
1.1.3.1
Pure electric vehicles (EV)
Pure electric vehic1e is the vehic1e which is driven by eclectic motor. Its power cornes
from a rechargeable battery or other energy storage devices.
Most of the EV s are directly driven by motor which
lSinstalled in the engme
compartments. However
,
sorne vehicles use the four wheels motors. The difficulty is the
power storage technologies. The electric vehic1e does not emit harmful gases into the
atmosphere. However
,
the electricity to charge the vehic1e is mostly come from the
thermal power station and little part come from hydropower or other source. The
electricity for charging can be obtained from sorne renewable resources such as: hydro
,
wind, solar, heat, etc.
It
and temporarily relieve the lacking of fossi! energy resources.
Undoubtedly, the pure electric vehicles are the excellent transitional technology.
Figure 1-7. Full electric vehicle and the charging device[23]
Advantages: Technology is mature and relatively simple. Wherever there is power supply,
the vehicles can be charged.
Disadvantages:
Energy
storage of battery (per unit
weight)
is relatively
smal!. The price
of battery is expensive which will cause the cost of operating higher than
sorne
normal
vehicles.
It
mainly depends on the life of the battery and the prices of local gas and
electricity.
1.1.3.2 Hybrid electric vehicle (PHEV)
PHEV is the
vehicle which
is able to obtain power
from
at least two of the following
types (in Figure 1-8). (According to the form of system structure,
the power can be
(jjJ S..,riç~ liyhû4 (pl f'l!twlk! hybnd T
IL
~
U; Hiith't); j::~' Ln;gtt%~ F.; l'weill""" U : n"'fWr'l:lm M; MOK>r p ,P;,w.:r u;n,,<n1.~.· - Hl",tfoo.i lins , -H}'clt"ùlk hl1k='
M<i .. ùlIltiCid kakl' ; lr.,,,,,,mi~~.,,,,,· ('nduding.br .. k" ... du!".1:0,,~ ""d s""n) T
Figure 1-8. Classification of different type hybrid electric
vehicles[24][25]
Series hybrid electric vehicle (SHEV): SHEV is the vehicle whose driving force only
cornes from the hybrid motor (electric). Its characteristic of structure is that the generating
motor drives generator and supplies the power. Power is delivered to the electric motor
through the controller and drives the vehicle[25].
Parallel hybrid electric vehicle (PHEV): PHEV is the hybrid electric vehicle whose
driving force is supplied by the electric motor and the engine simultaneously or
independently. Its characteristic of structure is that the parallel drive system could not
only use motor or engine independently as its power source
,
but also can use a motor and
engine simultaneously as its power source to drive the vehicle[26][27].
Series-Parallel hybridelectric vehicle (SPHEV): according to its name, this structure is a
combination of series and parallel principles. This combination can provide more
flexibility at the cost of increased complexity. This is a parallel arrangement where the
heat engine is connected to an electrical generator. Then
,
the management system will
easily control the amount of torque to move the wheels. However
,
the high operating and
maintenance cost is its disadvantage[25].
Complex hybrid electric vehicle (CHEV): CHEV is the vehicle which both possesses
series and parallel mode of driving. Its characteristic of structure is that it could work not
only in series mode but also in parallel mode[25].
Figure 1-9.Hybrid electric vehicle[28]
Advantages:
1. After using the hybrid power mode, vehicle can determine the maximum power of
the engine according to the average requirement. In this case, the fuel consumption
and the pollution are low. When the vehicle needs to accelerate but the power is
insufficient, battery will supply it. While the load is low, the surplus power can
generate electricity to charge the battery. In the operating process, the internaI
combustion engine could operate continuously if the fuel is enough. Then the battery
can be charged continually. So its endurance is equal to the normal vehicle.
2.
With the participation of battery, the energy can be easily recovered after sorne
situation such as: braking, downhill and idle speed.
3. In city, the engine could be switch off and the vehicle will be driven by battery
independently in order to achieve "zero local".
4.
With the internaI combustion engine, the problems of energy consumption such as air
conditioning, heating
,
and illumination which the pure electric vehicle faces could be
easily solved.
5. Refueling can be finished
IIIthe existing gas station and the more reinvest is
unnecessary.
6.
Complex hybrid technologies can keep the battery in good working condition.
It
avoids over charging-discharging which could extend battery life and reduces costs.
1.1.3.3 Fuel
cell
electric vehicles (FCEV)
A fuel cell electric vehicle uses the fuel cell as its generator which can charge the battery
in the running process. Chemical reaction process of the fuel cell does not pro duce
harmful products. Therefore
,
it can be called non-polluting vehicle. The energy
conversion efficiency of the fuel cell is 2-3 times higher than the internaI combustion
engine. On the hand of environmental protection, fuel cell vehicle is an ideal vehicle.
Individual fuel cells must be integrated into a fuel cell stack, in order to obtain the
necessary power to meet the requirements of the vehicles. In the development of fuel cell
vehicle, technical challenges are still exist such as: integrating the fuel cell stack
,
improving the commercialization of fuel processors, manufacturing of automobile
accessory
,
integrating components and others.
FUELCELL
CAR
Cathode Eleetroenglne,
Figure 1-10.The concept model of fuel cell
electric vehicles[29]
Comparing with ordinary internaI combustion engine vehicle
,
fuel cell vehicle has the
following advantages:
1.
It
is zero local or approximately zero local.
2. There will be no water pollution caused by oilleakage.
3.
It
can reduce the emissions of greenhouse gas.
4. Fuel economy and efficiency of engine combustion will be improved.
5.
It
runs smoothly with no noise.
1.2
Introduction of the devices
1.2.1
Nemo-fuel
cell
electric vehicIe
Nowadays
,
vehicle exhausting acts a main part in the
"
Greenhouse Gas
"
emission which
caused serious affect in the environment. In order to solve these environment problems
,
the electric vehicles including Hybrid Electric Vehicles (HEV) and Battery Vehicles
(BV)[30] gradually replace the internaI engine vehicles. However
,
the HEV is still
indivisible with the oil industry and its future is not optimistic. On the other hand
,
BV
doesn
'
t act very satisfactory while being compared with the HEV[31]
.
most advantageous candidate
because
of its zero
local,
high energy efficiency and fast
recharging[32]
.
Figure l-l1.Characteristic and parameters of
Nemo electric
truck[33]
Nemo is a low speed fuel cell vehicle (LSV) which can give a high loading and torque
.
(Figure 1-11
&
Figure 1-12)
Figure
1-12.Exterior
and
interior of
Nemo
In order to improve Nemo
'
s endurance and solve the problem of its power source, the
integrating
PEM
fuel cell produced by Axane
®
is equipped in the vehicle. This designing
and modification is made in IRH (Institut de recherche sur l'hydrogène). Further research
is continued in the institute including the embedded systems and the optimization of the
vehic1e,
battery
,
and fuel
cell. The original
parameters
are shown in Table 1-2
.
Table 1-2. Original
specifications
of Nemo truck
L: Vl: H Tires Weight Maximum Load Dimensions 3 .4gm: 1. 52m: 1. 90m 175/70R13 896kg 453kg Driving Performance Maximum Speed 40km/h Acceleration Autonomy 6. Ss (O-Max) 115 km Transmission Engine Transmission Report
Battery series Sattery Type Banery charger
1.2.2 Basic principles of the Nemo
••
.~»~.»"
; ~.O
i';:><-"~ Batteries ACX-2043j4.8kW 12;44:1 9X8V U.Sbattery® lead~add deepcycle 1.3kW lead·add BatteryFigure 1-13.
System
model ofNemo HEV
e
In Figure 1-13
,
it shows the system model of the Nemo. The driving power is given b
y
the
When the state of charge (SOC)
is lower
than the set depth of discharge (DOD)
,
the
generator will be switched on to charge the
battery.
Therefore
,
the PEMFC acts as the
generator in this system
.
1.2.3
Vtilization
of battery
series
Figure
1-14. 8V deep cycle
V.S
Battery[34]
Nemo uses the 9 series 8V U.S batteries as its power source. This type of batteries is the
most suitable candidate for the golf cart and multi-propose vehicle. Its feature is fully
complying with Nemo
'
s request for carrying the freight or mounting trailer and other
applications.
In
the 8V U.S battery series
,
there are three productions
:
8VGC XC2
;
8VGCHC XC2 and 8VGCE XC2.
Among the three productions
,
the
"
US 8VGCHC XC2
"
battery is chosen to be installed in
Nemo
because
of its high capacity which can drive Nemo for a
longer
distance.(parameters are compared in Table 1-3 [35]. Additionall
y,
the 8V series battery
has a marvelous performance on its output power which can help the
v
ehicle quickly start
and accelerate.
Table 1-3. Parameters of8V
V.S
Battery
C<M!f' and P.U4l't
~ Wldth H~ght Ca2 Qty
U.s. 8attety Amp~(20
51w-M'*I hr.~~) rate M.CA032F MJnutes 0 Amps 75 MInutes. 25 Amps
us SV'GC XC2 liO
Ba
lZSmltlutes ;G 331 lO 114" il/S" l! 114" R,ED,'Wl{t 4S(2&1mtn} f~lHrnm) (ZBotnm}
V$SVGCkC lin 1~' 13~rr,i">ltU* 'ta 1!4" 7 lIB" 11 lf4" eWfWHT ~
XCl 5Q~mp (2~O"'t1'Il (tSt",m) US~"''''}
USllVGŒXC2 21 101 90 min~tes &l tO fl: flIB" 111/4" Bl<tWHT 4S
56dmp (2êOmm) {lS1mml !2Sômm}
1.2.4 Vtilization of PEMFC
Figure 1-15. AXANE
®
PEMFC[36]
The 48 series
PEMFC
which produced
by
Axane
®
is the energy support of the Nemo
truck and
they
are
used
to charge the
battery.
Therefore
,
the energy exchanging between
fuel cell and
battery
is the
pure
electrical energy conversion
.
Axane
®
designed
and made fuel cells for different uses
,
such as emergency backup
generators. For example, it can
be used
when the power grid is not reliable or if it
becomes
unavailable[3 7].
Table 1-4. Parameters ofAxane® PEMFC
Parameters
of
Fuel cell
Company
Axane®
Power (W)
2500
Max Voltage (V)
48
Max CUITent (A)
52
Temperature (
O
C)
1-45
Hydrogen pressure (bar)
1.25
Air pressure (bar)
1.013
Weight (kg)
82
Normally, the price of fuel cell depends on its power (280$/kW)[38]
.
However
,
as a fuel
cell which is used for the researching experiment
,
the price is not comparable. The cost of
Axane®
PEMFC should be discussed under special conditions. Therefore
,
in this work
,
the cost of fuel cell refers to the commercialized fuel cell.
1.3
Chapter
summary
In this chapter, the classifications and features of sorne species of fuel cells are introduced.
The electrical vehicles are also presented including their system structures (series and
parallel) and reload methods (refueling or charging).
The proton ex change membrane fuel cell is the emphasis of the study because of its low
operating temperature
.
It is the best candidate of automotive fuel cell. The Nemo truck,
which is being optimized in
"
L'Institut de recherche sur l'hydrogène (IRH)
"
is a low
speed vehicle and with incredible solid dependability and flexibility
.
The parameters ofNemo are given in this chapter
.
The other devices which are used in the
Nemo are also introduced. By the control s
y
stem
,
the dynamic module
,
the fuel ceIl
module and the battery module are linked. The objective of this work is to optimize the
operating cost through comprehensively analyzing the consumption of each module.
Chapter 2 - Current Situation and Expected Optimization
The existing optimizations for the Nemo truck have achieved certain results. The two
e~ergy
managements (energy managements for the fuel cell and energy managements for
the
battery)
which are related to this work are described. Continually
,
the optimization
method which is used in this work
is
introduced. Economic optimization for hydrogen
cost and
battery
cost is the main purpose of this work.
2.1
Existing
optimization
Nemo is a
battery
vehicle which is modified to be a hybrid electric vehicle in IRH-UQTR.
To improve its endurance
,
energy saving and environment protection
,
a 2
.
5kW proton
exchange membrane fuel cell and a 5kW internaI combustion engine generator are both
installed. The objective of optimization is to get rid of the fossil fuel gradually under the
premise of its work stability. To ameliorate the performance of the vehicle
,
energy
efficiency
is
the most important factor. Not only in the fuel cell system but also in the
battery
system
,
the energy management control is the effective method to increase the fuel
efficiency.
2.1.1 Energy management of fuel cell
Figure 2-1 reflects the energy distribution in the fuel cell. The energy occupation of the
air supply is 25% and second only to the electric load. To increase the energy efficiency
,
a
air compressor is used to solve this problem[39].
t:-.1\.'\""to't' t~:~1
~~;~
..
,l!~J:-<>~~
·~~!r:.,:dy !~>l Ikmi«!i.:Mi.,,, r~J<f,~U;~'I';i.
~~~ ,~~
Figure 2-1. Energy distribution in the fuel cell[39]
This optimization is to obtain an air supply with a compressor or an air pump. In a fuel
cell
,
air supply acts very important[40]. Result by its inner energy consumption
,
it affects
the quality of the energy conversion and efficiency in the fuel cell stack. There is a
problem which is often
been neglected.
That is on
the
water management
,
the gas supply
has
an important impact. Therefore, the accuracy of
the
energy management control is
highly required.
tfflr"".
~'!d.Figure 2-2. Synoptic of a fuel cell
system
and the model of the air supply
management
system[39]
A fuel
cell
system is a multi-physics energy converter which implies
elec~ricity,thermodynamics
,
fluidic and electrochemistry
.
This method is most focusing on the
humidity
management and
the
influence of the air supply management as the output of
the fuel cell stack which is shown in Figure 2-2. Additionally
,
by using a
real
time control
loop to improve
the
air supply energy management
,
a tirst indicator of the quality of the
water
management
has
been
presented.
Through the method of adding in the aIr compressor, a significant result of the first
analysis for the energy management is provided. The future work can be begun by the
designing of an efficient air supply control strategy which should be aided by the fuzzy
logic.
2.1.2 Energy management of battery
The power management strategy optimization has
been
done and the battery life cycles
and the aging model are included[ 41]. To improve the Nemo from BV to HEV, the
modification is shown in Figure 2-3 :
g;:~w'~ ~~*,~~~" ._ .
(.~~'i<: .• t:",w~
a.s;(~~1t: ~~ ti(':'".... _ (~"'"f'v.;?·"i'$I'!<,.x"<o
Figure 2-3. Original Nemo
EV
architecture and modified
Nemo
HEV
architecture[
41]
When
being
parked
,
the charging power is provided by the grid. PEMFC and internaI
combustion engine generator will be started while driving.
As the figure shows, PEMFC is added into the operating circuit as the power resource. At
the same time, internaI combustion engine generator also works in another power
provision
branch
as its alternate power when the fuel (hydrogen) in tank is empty. The
alternating current is supplied by the ICE generator. Therefore, the Lead-acid battery will
be charged by the direct current while the
DC-AC
converter is set between the generator
and battery. Both of the direct current will be controlled by the main controller. The block
diagram is presented as:
Figure 2-4. Block diagram
of the Nemo[41]
The two driving charging systems can work independently. Therefore
,
the optimization
will be only focused on the branch of the PEMFC charging circuit and the flow chart is
shown in Figure 2-5
:
Powergdd Electric power flow _ CQmrnunicatîol'lS
Figure 2-5. Charging circuit of PEMFC-battery[ 41]
2.2
Objective and expected optimization - Energy management of charging system
Fuel Cell acts as a converter of energ
y
exchanging between electric and chemical. This
electro-chemical reaction between h
y
drogen and ox
y
gen produces electricity
,
water and
heat[42]. By adjusting the operating parameters
,
such as temperature
,
switching time and
drag
,
the best operating status will be found which is called
"
optimization
"
[32]. This
work presents the methods of efficient management and the optimization of consumption.
By using these methods, the utilization of fuel (hydrogen) and the cost caused by the
battery life will be improved.
Another factor which cannot be ignored is the energy consumption of the charging circuit.
In other word, the charging form and the charging efficiency are important factors
because charging the battery is the purely conversion from chemical energy to electrical
energy (appending with thermal consumption). At the same time, the battery life is also
significantly affected by the charging methods. Consequently, the energy management of
charging circuit will directly affect the operating cost of battery. Sorne effective charging
methods are used to achieve the goal, such as trickle charging and constant voltage
charging.
In this optimization work, the variable resistor is added in the charging circuit. The
charging efficiency is increased and the consumption of the fuel and the battery life will
be effectively improved.
2.2.1 Flow chart of Nemo truck
Evolving from the model in Figure 2-5, the logical relationship among each parts of the
Nemo's system is expressed in Figure 2-6:
Discheirge Recharge ·
if 50C=0
Fuel cel!
Motor
In Nemo truck
,
battery supports the power to the electric motor directly. Therefore
,
the
state of charge is the monitor of the total mode!. The Nemo uses 9 series "American
Battery
®
"
8&12
volt battery as its power source.
Because
of the high price of battery
(200$
/
single battery), to find a
balance
point (SOC
limit)
between the cost of battery and
hydrogen is the aim of optimization.
Discharge Recharge if
soc=o
Fuelcell MotorAs
Figure
2-6
shows
,
if the SOC is higher than the set
limit
,
the fuel cell is off
.
While the
SOC is lower than the set limit
,
fuel cell will be switched on to charge the battery. EIse
,
when hydrogen in tank is empty
,
there will be no chemical energy for the fuel cell to
produce
electricity. With the continued operating, SOC will tend to 0%. At this time
,
the
total system (including the fuel ceIl
,
the vehicle and the battery) will stop[43].
2.2.2 Battery
status
To reflect
the
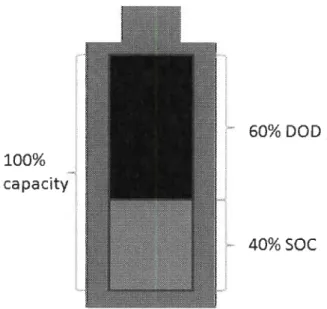
status of battery, there are two parameters: Depth of Discharge (DOD) and
State of Charge (SOC).
In
the
operating of battery, the percentage of battery capacity release is called the depth of
discharge (DOD). The level of DOD concemed with the life of secondary batteries
(rechargeable storage battery or battery).The deeper the depth of discharge is
,
the shorter
the battery
'
s life will be. Therefore
,
deep discharging should be avoided in operating.
reflect the status of the remaining power in the batter
y
and especially in the electric
vehicle. The function of SOC is same as the fuel gauge in the internaI combustion engine
vehicles. The measurement of SOC is percent (0% is empty
,
100% is full).
Discharging and charging curve
100 90 80 70 <ft. 60 U 0 50 <.Il 10
+---...,
2
o ... . Time (s)Figure 2-7. Ideal graph of discharging and charging
Figure 2-7 is an ideal graph of discharging and charging
,
there is no interference in the
process of discharging and charging. Point 1 is the beginning of discharging and the SOC
decreases continuousl
y
. While SOC reaches the limit le
v
el (point 2)
,
the fuel cell will be
started and the motor is turned off at the same time. (Usually
,
the process of charging is
longer than the process of discharging because the output power is larger than the input
power.)
.
When SOC is charged to a certain level (point 3)
,
the charging rate decreases
obviously because of the aging phenomenon of battery. Generally
,
the fuel cell can be
switched off at this time because the charging efficiency is very low. If continue to charge
,
the SOC will rise till the full status (point 4).
Theoretically
,
in a single battery
,
the maximum of charging lev el is about 95%. When the
SOC reaches this level
,
the charging efficiency will decrease significantl
y
. Therefore
,
in
the operating of Nemo
,
the maximum charging level is set at 95
%
. Thus
,
the
unnecessarily wasting of hydrogen can be avoided. In operating
,
DOD and SOC are
antithetical parameters (DOD+SOC=100
%
) which is shown in Figure 2-8
.
100%
capacity
60% DOD
40% SOC
Figure 2-8. Capacity of battery status
2.2.3 Cycles of battery charging
A charge cycle is the process of discharging a rechargeable battery and charges
i
t
.
The
term is typically used to specify a battery's expected life
,
as the number of charge cycles
affects life more than the process time. Discharging the battery fully before recharging is
called "deep discharge"; partially discharging then recharging may be called "shallow
discharge" .
In general
,
number of cycles for a rechargeable battery indicates how many times it can
undergo the process of complete charging and discharging until failure or it is starting to
lose capacity[44].
ExpeetH Ute Cyelu
t~ ' ... w .. m ... -.·.·.,·.w.-.-•. ·.-... ·. ....-.·.·"-.·..,..· ... ,>" ... >,.,.»",,.>'.>"'~m .... '
lOO··\-. - .,...".."4'---,.-- - - -,.,....,..,..-.----:----J
• ~ • • • • W • • _
%C~c'~
Figure 2-9.Relationship between depth of discharge and life cycles of battery[ 46]
Figure 2-9 is constructed for a Lead acid battery. The trend of curve is caused by the
principle that battery life depends on the total energy throughput that the active chemicals
can tolerate. Ignoring the battery aging phenomenon, the total energy is fixed. (It can be
regarded that 1 cycle (100% DOD)
;::
2 cycles (50% DOD)
;::
10 c
y
cles (10% DOD)
;::
100
cycles (1 % DOD)). Therefore
,
for the chemical battery
,
the aging effects are the main
cause ofthe battery cycles life[45].
2.2.4 Aging co st of fuel cell system
For the fuel cell system, the cost is depending on the degradation ofthe system itself.
Powert
XPrieet
C
osttuel cell
=
L
.f
Xt
l
et
In the N emo truck
,
Power!
=
2.5kW
Priee!
=
280$jkW[38]
Lite!
=
2,000 - 2,500
hours
Then
,
the cost of fuel cell is 0.28-0.35$/hour.
(2.1)
fuel
cell system will not be taken into account in the optimization
.
2.2.5 Cost of battery
Equation (2.2) is the expression of the battery.
It
is determined by several factors
:
output
power of battery
,
available charging cycles
,
numbers of battery series and the charging
cycles
in
the operating process.
Here
,
PB
Costbattery
=
LB
XC
ch XnB
PB
=
single battery priee
LB
=
life
of
battery
CCh
![Figure 1-5. Schematic of a single typical proton exchange membrane fuel cell[16]](https://thumb-eu.123doks.com/thumbv2/123doknet/14644870.735849/22.918.243.633.100.523/figure-schematic-single-typical-proton-exchange-membrane-fuel.webp)
![Figure 1-8. Classification of different type hybrid electric vehicles[24][25]](https://thumb-eu.123doks.com/thumbv2/123doknet/14644870.735849/26.918.201.665.118.518/figure-classification-different-type-hybrid-electric-vehicles.webp)
![Figure 1-9.Hybrid electric vehicle[28]](https://thumb-eu.123doks.com/thumbv2/123doknet/14644870.735849/27.918.289.693.256.668/figure-hybrid-electric-vehicle.webp)
![Figure 1-10.The concept model of fuel cell electric vehicles[29]](https://thumb-eu.123doks.com/thumbv2/123doknet/14644870.735849/29.918.312.676.111.396/figure-concept-model-fuel-cell-electric-vehicles.webp)
![Figure l-l1.Characteristic and parameters of Nemo electric truck[33]](https://thumb-eu.123doks.com/thumbv2/123doknet/14644870.735849/30.918.175.698.175.553/figure-l-l-characteristic-parameters-nemo-electric-truck.webp)
![Figure 2-2. Synoptic of a fuel cell system and the model of the air supply management system[39]](https://thumb-eu.123doks.com/thumbv2/123doknet/14644870.735849/37.918.189.785.634.817/figure-synoptic-fuel-cell-model-air-supply-management.webp)
![Figure 2-3. Original Nemo EV architecture and modified Nemo HEV architecture[ 41]](https://thumb-eu.123doks.com/thumbv2/123doknet/14644870.735849/38.918.145.756.477.671/figure-original-nemo-architecture-modified-nemo-hev-architecture.webp)
![Figure 2-4. Block diagram of the Nemo[41]](https://thumb-eu.123doks.com/thumbv2/123doknet/14644870.735849/39.918.209.776.114.375/figure-block-diagram-of-the-nemo.webp)
![Figure 2-9.Relationship between depth of discharge and life cycles of battery[ 46]](https://thumb-eu.123doks.com/thumbv2/123doknet/14644870.735849/44.918.255.598.128.353/figure-relationship-depth-discharge-life-cycles-battery.webp)