1
“What-if” scenarios towards virtual assembly-state mounting for non-rigid
parts inspection using permissible loads
Sasan Sattarpanah Karganroudi1, Jean-Christophe Cuillière1, Vincent François1, Souheil-Antoine Tahan2 1Équipe de Recherche en Intégration Cao-CAlcul (ÉRICCA), Université du Québec à Trois-Rivières, Trois-Rivières, Québec, Canada 2Laboratoire d'ingénierie des products, procédés et systèmes (LIPPS), École de Technologie Supérieure, Montréal, Québec, Canada
Abstract
Recent developments in the fixtureless inspection of non-rigid parts based on computer-aided inspection (CAI) methods significantly contribute to diminishing the time and cost of geometrical dimensioning and inspection. Generally, CAI methods aim to compare scan meshes, which are acquired using scanners as point clouds from non-rigid manufactured parts in a free-state, with associated nominal computer-aided design (CAD) models. However, non-rigid parts are deformed in a free-state due to their compliance behavior. Industrial inspection approaches apply costly and complex physical inspection fixtures to retrieve the functional shape of non-rigid parts in assembly-state. Therefore, fixtureless inspection methods are developed to eliminate the need for these complex fixtures and to replace them with simple inspection supports. Fixtureless inspection methods intend to virtually (numerically) compensate for flexible deformation of non-rigid parts in a free-state. Inspired by industrial inspection techniques wherein weights (e.g. sandbags) are applied as restraining loads on non-rigid parts, we present a new fixtureless inspection method in this article. Our proposed Virtual Mounting Assembly-State Inspection (VMASI) method aims at predicting the functional shape (in assembly-state) of a deviated non-rigid part (including defects such as plastic deformation). This method is capable of virtually mounting the scan mesh of a deviated non-rigid part (acquired in a free-state) into the designed assembly-state. This is fulfilled by applying permissible restraining forces (loads) that are introduced as pressures on surfaces of a deviated part. The functional shape is then predicted via a linear FE-based transformation where the value and position of required restraining pressures are assessed by our developed Restraining Pressures Optimization (RPO) approach. In fact, RPO minimizes the orientation difference and distance between assembly mounting holes on the predicted shape of a non-rigid part with respect to nominal ones on the CAD model. Eventually, the inspection is accomplished by examining the mounting holes offset on the predicted shape of the scan model concerning the nominal CAD model. This ensures that the mounting holes on the predicted shape of a scan model in assembly-state remain in the dedicated tolerance range. This method is evaluated on two non-rigid parts to predict the required restraining pressures limited to the permissible forces during the inspection process and to predict the eventual functional shape of the scan model. We applied numerical validations for each part, for which different types of synthetic (numerically simulated) defects are included into scan meshes, to determine whether the functional shape of a geometrically deviated part can be virtually retrieved under assembly constrains.
Keywords
Fixtureless inspection, non-rigid parts, virtual mounting in assembly-state, computational metrology, optimization, FEA.
1. Introduction
1.1. GD&T of non-rigid parts
Geometric Dimensioning and Tolerancing (GD&T) is an essential need for the functionality and quality control of
manufactured parts. Geometrical precision of manufactured parts directly affects functional efficiency of assembled products. Despite recent progress in manufacturing methods towards reducing the lead time of production, quality control is still time-consuming and requires significant manual intervention. Dimensional inspection in the quality control process is especially challenging for thin-walled sheet metals that are used in various industrial sectors among which aerospace and automotive industries. These parts feature a very small thickness compared to the other dimensions that makes them non-rigid (flexible). This is referred to as a compliant behavior in a tolerancing context. The main issue of GD&T is that these non-rigid parts may easily deform during a free-state inspection process. This requires applying over constrained fixtures and restraining the part under permissible loads during the dimensional inspection process to retrieve the functional part shape. Therefore, even though the shape variation of non-rigid parts due to flexible deformation in a free-state exceeds the allocated dimensioning tolerances of the model, these manufactured parts can still be assembled when the functional shape of the model is retrieved under permissible loads on the inspection fixtures.
Metrology standards such as ASME Y14.5 and ISO-GPS state that the inspection of parts is performed in a free-state, except for non-rigid parts, as mentioned in ISO-10579 and ASME Y14.5 (2009). Free-state refers to a situation in which a manufactured part is not submitted to any other load than its weight. A non-rigid aerospace panel in a
POSTPRINT VERSION. The final version is published here :
Sattarpanah Karganroudi, S., Cuillière, J.-C., François, V., & Tahan, S.-A. (2018). “What-if” scenarios towards virtual assembly-state mounting for non-rigid parts inspection using permissible loads. In International Journal of Advanced Manufacturing Technology (Vol. 97, pp. 353-373): Springer Nature.
2 free-state, as shown in Figure 1-a, deforms due to compliance under its weight and/or residual stress remaining from manufacturing processes. Conventional dimensioning and inspection methods for non-rigid parts require sophisticated, expensive and time-consuming inspection fixtures to compensate for the flexible deformation of these parts. These fixtures reacquire the functional shape of the manufactured part with respect to its designed CAD model ensuring measurement repeatability and reproducibility. The measurement setup (fixture) represents the nominal assembly-state wherein the manufactured part is aligned with the reference frame during the measuring process. Figure 1-b illustrates an example of such an inspection fixture for the part shown in a free-state in Figure 1-a.
Figure 1: An ordinary aerospace panel a) in free-state, b) constrained on supports of the inspection fixture [1]
The dimensional inspection of non-rigid parts is generally accomplished in restrained conditions, such as applying limited forces to impose the functional shape of the part on the fixture [2]. As shown in Figure 2, a practical inspection technique applies weights (sandbags) on the surface of a deviated non-rigid part to retrieve its functional shape constrained on the physical fixture. These sandbags are permissible weights that present pressure loads in the gravity direction on surfaces of a part. The permissible loads are commonly presented as a note in design drawings authorizing their application during the inspection process. An example of such a note that specifies the permissible load and the associated fixture is “A load of X N/m can be used to achieve tolerance,” which is indicated next to the associated geometrical requirements. The restraints which apply permissible loads on non-rigid parts are usually used for large parts such as aerospace panels for which the functional requirements are retrieved by imposing certain constraints during assembly.
Figure 2: An aerospace panel under permissible restrained loads (the weight of black sandbags applied on the surface of part) achieves the functional shape on physical fixture [1].
In order to accomplish geometric dimensioning, the first step is to assign proper tolerances with respect to property, functionality and part manufacturing process. Tolerance allocation and analysis for non-rigid parts take into account parts’ shape variation (such as warping or changing in the nominal curvature of the model) in their final assembly-state. These geometrical variations are due to manufacturing defects (such as springback effect and residual stress), handling and transporting defects (such as plastic deformation) or assembling defects (such as welding deformation caused by locally overheating the part).
1.2. Fixtureless inspection methods
Once proper tolerances are specified, GD&T specifications are assessed through inspection of the parts based on computer-aided inspection (CAI) methods. The improvements in 3D non-contact data acquisition devices, such as 3D laser and optic scanners [3], along with computational calculations allow progress in CAI methods. The CAI methods apply optic and laser scanners to obtain a 3D point cloud from the surface of a part in a free-state. A triangular mesh is then generated from this point cloud, which represents the shape of a manufactured part as a scan
3 mesh. The inspection is accomplished by virtually comparing this scan mesh with the associated nominal CAD model to evaluate geometric deviation of the manufactured part with respect to assigned tolerances. Conventional inspection methods apply a hard inspection fixture [4] to keep non-rigid parts in its functional state, but ongoing studies on fixtureless inspection methods intend to eliminate the need of these complex and expensive fixtures. Fixtureless non-rigid inspection methods [1, 5-13] are developed as CAI methods in which different approaches are applied to compensate for the flexible deformation of measured manufactured part in a free-state. These methods take into consideration the permissible displacements, due to the compliance behavior, during the assembly of non-rigid parts. The primary step for fixtureless inspection of non-non-rigid parts is performing a non-rigid registration. During this process, a transformation matrix is applied (regardless of the flexible deformation of the parts) to displace the CAD and scan models close to each other in a common coordinate system. Then, the fixtureless inspection methods try to distinguish between flexible deformation of the scan model in free-state and geometrical deviations associated with defects. Therefore, virtually compensating for the flexible deformation of the scan model in a free-state allows the estimation of defects on the parts with respect to the nominal CAD model. In general, these fixtureless non-rigid registration methods search for correspondence between the CAD and scan models to deform the CAD or scan model towards the other one, by using FEA or using iterative displacements. However, the permissible assembly loads are not considered in these fixtureless inspection methods. The assembly loads are practically applied in inspection techniques (for instance by applying weights) to place a geometrically deviated non-rigid part into assembly-state. Therefore, even a deviated manufactured part including defects that exceed the geometrical tolerances can be accepted for final assembly within the assembly tolerance ranges. These defects (geometrical deviations) such as warpage, shrinkage, springback or any type of plastic deformation can occur during manufacturing or handling before inspection. These defects result in misalignments during the assembly process, but excessive geometrical variations with respect to the assembly tolerances can be absorbed by the compliance of non-rigid parts.
Inspired by inspection techniques using weights, a fixtureless inspection method for non-rigid parts is presented in this paper that aims to verify the feasibility of assembling deviated parts in the nominal assembly-state with respect to assembly tolerances. This virtual mounting assembly-state inspection (VMASI) method considers the presence of profile [k, d] and localization [j] defects, as defined by ASME Y14.5, on inspected non-rigid parts. This method develops a virtual fixture using the GD&T specification of the CAD model to retrieve the functional shape of a deviated non-rigid part in assembly-state. The VMASI estimates the required restraining loads which are limited to the permissible assembly loads. The estimated loads in this method are in fact estimated pressures on specific zones distributed on the surface of deviated part. These estimated pressures are oriented in the gravity direction, to replicate the weight of sandbags on the surface of manufactured part. To this end, the scan mesh of the deviated manufactured part is partitioned into zones where the estimated pressures are introduced. The required pressures are estimated using our developed restraining pressures optimization (RPO) approach to minimize the distance and orientation differences between assembly mounting holes on the scan mesh and nominal mounting holes on the CAD model. The predicted shape of scan mesh in an assembly-state is obtained applying the estimated pressures in a FE-based transformation. The inspection is performed by verifying each mounting hole on the predicted shape of scan mesh with respect to assembly tolerance values as specified. Based on the proposed inspection method, a deviated non-rigid part is likely to be assembled if all mounting holes on the predicted shape of scan mesh remain within the tolerance range. Scan mesh of deviated non-rigid parts, including different synthetic (numerically simulated) defects, are studied to determine the feasibility of retrieving the functional shape of deviated parts under assembly constrains. These numerical validations establish what-if scenarios that tend to assess what type of deviated non-rigid parts, including defects with certain amplitude and locations, can be assembled under assembly constraints. In other words, we investigate the assemblability of deviated parts that cannot be normally assembled without assembly constrains.
This paper is organized as follows. Section 2 presents a literature review of tolerancing and fixtureless inspection of non-rigid parts. It is followed by an introduction of the proposed virtual mounting assembly-state inspection (VMASI) method in section 3. This section describes the steps to estimate the required restraining loads on scan mesh of deviated manufactured non-parts using the developed restraining pressures optimization (RPO) approach. Results obtained using our VMASI method on non-rigid parts are then presented in section 4. For this, two typical non-rigid parts used in the aerospace industry are considered, wherein various types of defects are presented. The paper ends with a conclusion and perspectives for future work in section 5.
2. Literature review
In order to assess the required quality of manufactured parts, geometrical dimensioning and tolerancing (GD&T) based on ASME Y14.5 and ISO-GPS standards are handy references. Unlike traditional GD&T methods, non-rigid tolerancing methods must take into consideration permissible displacements of non-rigid parts during the assembly process due to flexible deformations. A review of studies on computer-aided tolerancing (CAT), tolerance analysis and allocation strategy for compliant (non-rigid) parts is presented in [14-16]. Like tolerance allocation, relevant inspection methods for non-rigid parts must take into consideration the flexible deformation of non-rigid parts for
4 evaluating the geometrical deviation of manufactured parts with respect to assigned tolerances. A classification of specifications for GD&T of non-rigid parts is presented in [2] wherein GD&T requirements have to be respected in a restrained condition such as restraining shape fixtures, datum reference frame, movable datum targets and restraining forces. Therefore, the CAI methods that apply rigid registration only, such as iterative closest point (ICP) algorithm [17], do not fit the inspection of non-rigid parts in a free-state. To this end, classical inspection methods are used by restraining non-rigid parts in physical fixtures [4] during the inspection process. However, significant drawbacks of these complex fixtures, where the setup and repeatability of the fixtures are costly, lead to developing inspection methods by eliminating the need of fixtures. The core idea of fixtureless inspection methods is to compensate for flexible deformation of non-rigid parts in a free-state and enable comparison between the scan mesh of part and its CAD model. To this end, a few fixtureless inspection methods are developed based on virtually deforming the scan model towards the CAD model [1, 5, 6], while other methods are developed based on virtually deforming the CAD model toward the scan model [7-13].
The first group of fixtureless methods apply a set of displacement boundary conditions (BCs) in a finite element analysis (FEA) to displace the scan mesh towards the corresponding CAD model. BCs used in the virtual fixation
concept [5] are imposed on the assembly fixation features (e.g. holes) of the scan mesh, which can be automatically
identified using feature extraction techniques [18]. However, imposing BCs on all fixation features to displace them towards their design location for complex non-rigid parts is not always possible and may cause geometrical deviations in the part during assembly. An alternative approach is proposed in [6], which estimates the optimized BCs to virtually deform the scan mesh via FEA towards the CAD model. Considering a pre-defined BCs applied on scan mesh, this method estimates new BCs to minimize the location and orientation of fixation features between the predicted shape of the scan model (after virtual deformation) and the CAD model. The predicted displacement BCs applied on the scan mesh via FEA, satisfy the requirements of assembly constraints. Eventually, a virtual inspection is performed by comparing the deformed scan mesh in its assembly-state and the CAD model. However, the movable datum targets and restraining forces are not considered in the mentioned CAI methods. These restraining forces are commonly used in aerospace industry to constrain non-rigid parts during inspection. To this end, a virtual
fixture method based on boundary displacement constrained (BDC) optimization is developed in [1]. The BDC
optimization virtually constrains the scan mesh of a part, which is acquired in a free-state, by a combination of restraining forces that are located only on datum targets. This method aims at a non-rigid registration by estimating required restraining forces to displace the scan mesh towards the datum targets. Meantime, these restraining forces minimize the Euclidian distance between the deformed scan mesh and CAD model. The final inspection is performed by evaluating the distance between the positions of datums on the deformed scan mesh in assembly-state and the nominal ones on the CAD model.
The second group of fixtureless inspection methods is developed to especially eliminate the time-consuming drawbacks of treating the scan point cloud to generate a FE mesh and of locating appropriate BCs for each scan model. The high-quality mesh of CAD model is always used in these methods to be deformed towards scan mesh. Therefore, in contrast to the virtual fixation concept [5], displacement BCs applied in virtual reverse deformation [7] are imposed on each fixation feature of the CAD model. These BCs are used to displace these features towards their corresponding features on the scan model. During the scanning process, some zones on the surface of parts can be missed in the scan point clouds. The loss of scan data is more crucial for fixation features of the scan mesh because the BCs associated with these fixation features cannot be calculated and applied. A fixtureless inspection method based on approximating the location of missing fixation features by an interpolating technique is presented in [8]. In this method, an iterative transformation to the CAD model has been applied, wherein the error between the deformed CAD and partially scanned mesh is minimized. The application of iterative transformation without using a FEA to the CAD model is presented in the iterative displacement inspection (IDI) approach [9, 10], whose aim is to displace the CAD model iteratively towards the scan mesh except for defects. IDI applies identification methods that distinguish between defects and flexible deformation and identify possible defect areas on the scan mesh. Afterwards, a smooth and iterative displacement of the CAD model towards the scan mesh is performed by applying proper displacement vectors, while identified defects are excluded from the calculation of these displacement vectors. However, an IDI identification algorithm is limited to localized defects which make it inefficient for manufactured parts with big (global) defects. The generalized numerical inspection fixture (GNIF) approach [11] also features a fixtureless inspection method that claims to inspect both small (local) and big (global) defects. GNIF assumes that the deformation of a non-rigid part in free-state is isometric (preserves geodesic distances). In other words, the assumption is that there is no stretch in the free-state deformation of inspected non-rigid parts. GNIF generates sets of corresponding sample points between CAD and scan meshes by considering them as geodesic distance metric spaces and finding sample points distributions that minimize distortion between metrics using
generalized multidimensional scaling (GMDS) [19]. Discrete geodesic distances for CAD and scan meshes are
calculated using fast marching [20]. These corresponding sample points are then used as BCs in a FE calculation referred to as finite element non-rigid registration (FENR) to deform the CAD mesh towards the scan mesh. However, some of the sample points generated by GNIF can be located on and/or around defects. Therefore, in [11] sample points are only located on bounding edges, assembly features, which are used as BCs in FENR. This
5 assumes that there are no defects on these features and they are perfectly scanned, which is not necessarily the case. In [12], specific pre-selected sample points calculated as barycenters of manually selected groups of sample points in specific areas on the CAD model are used, as displacement BCs, to deform the CAD mesh towards the scan mesh through FEA. In order to fully automate the inspection process, an automatic fixtureless inspection approach based on filtering sample points is presented in [13]. In this last method, corresponding sample points that are on or close to defects are automatically filtered out, based on curvature and von Mises stress criteria, which
automatically leads to a more accurate inspection of non-rigid parts.
However, none of those above-mentioned inspection methods can automatically assess whether or not a given manufactured non-rigid part with defects can still be assembled by using permissible restraining loads. As already stated regarding the virtual fixture developed in [1], the required restrained forces are only estimated and introduced on random datum targets. Therefore, the method is not capable of assessing the feasibility of retrieving the functional shape of a geometrically deviated part (scan mesh) because the location of restraining forces is limited to specific zones. In other words, the functional shape of a geometrically deviated scan mesh may be retrieved by applying required restraining loads on zones rather than only datum targets. This is practically confirmed in aerospace industry inspection techniques wherein random restraining loads on the surface of deviated non-rigid parts in a physical fixture retrieve the functional shape of the part. In fact, manufactured parts including different types of defects may still be accepted and assembled under restraining loads introduced at specific locations on the surfaces of the deviated part. The fixtureless inspection method presented along with the following section is inspired by industrial inspection techniques using weights (such as sandbags) at specific locations on the surface of manufactured parts to retrieve their functional shape. The proposed method can automatically predict the functional shape of a scan mesh acquired from a deviated non-rigid manufactured part and make the decision to accept or reject the part by verifying the predicted shape with respect to GD&T requirements.
3. Virtual Mounting Assembly-State Inspection method (VMASI)
The virtual inspection method presented in this paper seeks two purposes for non-rigid parts: 1) eliminating the need for expensive and time-consuming inspection fixtures, 2) finding the possibility of assembling a deviated manufactured part that includes defects. This method applies a rigid registration to retrieve the shape of a non-rigid part that may have some level of geometrical deviation, by virtually mounting the part into its assembly-state. The geometrical deviations caused by springback effect, residual stress or any plastic deformation can be presented in manufactured parts. The proposed method assesses the required loads and virtually introduces them on specific zones on the surface of part to find a possibility of placing the deviated manufactured part into assembly-state. This is done by adjusting and aligning assembly mounting features (e.g. holes) which are essential for assembling the part. These mounting features hold the non-rigid part in its functional shape in the assembly position. Considering that the scan mesh of the part is acquired in a known arbitrary free-state condition, this method restricts the scan mesh using permissible loads via FEA and predicts the shape of the scan mesh in assembly-state condition. This is followed by inspecting each mounting hole on the predicted shape of the scan mesh in assembly-state with respect to the dedicated tolerances.
The scan mesh of a part is generated from the scan point cloud obtained by data acquisition devices such as 3D optic scanners. This scan mesh represents the outer surface (skin) of the manufactured part in a free-state. Due to their compliant behavior, non-rigid parts usually do not match with their final assembly configuration, and their shape in a free-state varies significantly from the nominal CAD geometry [21]. Therefore, the proposed virtual inspection method determines an optimal mapping of scan mesh toward the CAD model under restricting loads on virtual inspection fixtures. Typically, these loads are limited by thresholds that are specified in the engineering technical drawing depending on part material, dimensions and thicknesses. As mentioned, the method is inspired by inspection techniques used in the aerospace industry. These techniques use weights or vacuum as restraining loads on a physical inspection fixture (see Figure 2). The proposed method virtually applies equivalent permissible pressures over pre-partitioned zones on the surface of scan model with the objective of retrieving the functional shape in the assembly-state. These partitioned zones replicate areas of contact between weights and the part surface. The virtual mounting assembly-state inspection (VMASI) method intend to virtually deform the scan mesh in an optimal way to adjust and align its mounting holes, as accurately as possible, with corresponding holes in the CAD model. Then the VMASI method assesses if the non-rigid part is acceptable for assembly or if it has to be rejected. This decision depends on how accurately the mounting holes of the part can be oriented and aligned in the virtual assembly-state. The part is rejected when it cannot be put in its assembly-state by using permissible loads as specified in the drawing.
As already mentioned, a triangulated mesh (STL format) is generated from the point cloud. This mesh is smoothed and simplified (decimated) to decrease the effect of scanning noise and to reduce the mesh size [22]. The geometrical deviations associated with the scan model of manufactured parts are generated by adding different synthetic defects to the CAD model of the parts. This is done to control and quantify the type and size of synthetic defects and to assess the effect of defect type, shape and amplitude on results obtained.
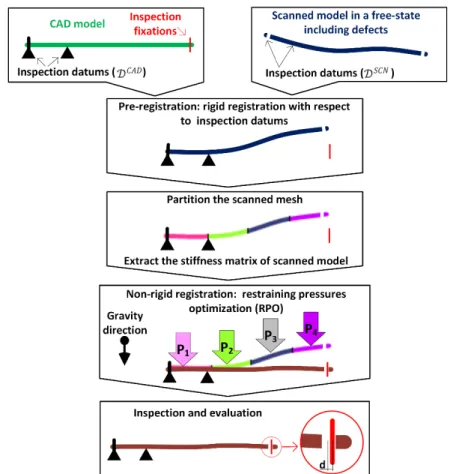
6 A detailed explanation of the proposed VMASI method is provided in the following sub-sections. The VMASI method features four modules as shown in Figure 3. After the scanning process, these modules are sequentially applied. These modules are pre-registration (section 3.1), partitioning of the scan mesh (section 3.1), non-rigid registration (section 3.2), and inspection evaluation (section 3.3). After presenting these modules, the whole sequence is summarized in section 3.4.
Figure 3: Schematic flowchart of the proposed assembly assessing method.
3.1. Pre-registration and partition of the scan mesh
As shown in Figure 3, the nominal CAD model along with GD&T specifications such as inspection datum information is part of the inputs of the proposed VMASI method. A 3D scan mesh of the part in a free-state is the other input of the method. The pre-registration module seeks to find a proper ICP-based rigid registration to bring the scan mesh and the CAD model close together in a common coordinate system. The assumption of VMASI is that the datum features of the scan model can be perfectly positioned and aligned with respect to the position and orientation of corresponding datums on the CAD model.
The processed scan mesh with FE-mesh quality in the measurement coordinate system can be presented by a set of 𝑁𝒮𝑆𝐶𝑁 nodes in scan mesh with 𝒮𝑆𝐶𝑁= {𝑠1𝑆𝐶𝑁, … , 𝑠𝑁
𝒮 𝑆𝐶𝑁
𝑆𝐶𝑁 |𝑠
𝑖𝑆𝐶𝑁∈ ℝ3}. On the other side, the CAD mesh in design
coordinate system also can be presented by a set of 𝑁𝒮𝐶𝐴𝐷 nodes in CAD mesh with 𝒮𝐶𝐴𝐷=
{𝑠1𝐶𝐴𝐷, … , 𝑠𝑁
𝒮 𝐶𝐴𝐷
𝐶𝐴𝐷 |𝑠
𝑖𝐶𝐴𝐷∈ ℝ3}. GD&T specifications of the part determine the datums where the part should be
constrained during inspection process. Therefore, a subset of scan mesh presented as 𝒟𝑆𝐶𝑁=
{𝑑1𝑆𝐶𝑁, … , 𝑑𝑁
𝐷𝑆𝐶𝑁
𝑆𝐶𝑁 |𝑑
𝑖𝑆𝐶𝑁∈ ℝ3 , 𝑑𝑖𝑆𝐶𝑁∈ 𝒮𝑆𝐶𝑁} are 𝑁𝐷𝑆𝐶𝑁 nodes on inspection datums of scan mesh. Meanwhile, a
subset of CAD mesh presented as 𝒟𝐶𝐴𝐷= {𝑑
1𝐶𝐴𝐷, … , 𝑑𝑁
𝒟𝐶𝐴𝐷
𝐶𝐴𝐷
|𝑑𝑖𝐶𝐴𝐷∈ ℝ3 , 𝑑𝑖∈ 𝒮𝐶𝐴𝐷} are the 𝑁𝐷𝐶𝐴𝐷 nodes on
inspection datums of CAD mesh. During the pre-registration process, a rigid registration displaces the scan mesh (as a single part) to place it on designed datums and align it with CAD mesh based on datums. Therefore, datum features such as flat surfaces along with fixation holes that considered as datums are aligned between the scan mesh with those of the CAD mesh. The rigidly aligned scan mesh based on designed datums is presented as 𝒮 = {𝑠1, … , 𝑠𝑁𝒮|𝑠𝑖∈ ℝ3} with a set of 𝑁𝒮 nodes on the rigidly aligned scan mesh. Consequently, the nodes on the datums
7 identified on the rigidly aligned scan mesh is 𝒟 = {𝑑1, … , 𝑑𝑁𝒟|𝑑𝑖 ∈ ℝ3 , 𝑑𝑖∈ 𝒮} where 𝑁𝒟 nodes are located on
inspection datums of scan mesh after rigid registration.
The inspection result is based on evaluating the distance of assembly fixation features such as mounting holes on the scan mesh with their corresponding mounting hole on the CAD mesh. Therefore, 𝑁ℐ nodes presented by ℐ =
{𝜄1, … , 𝜄𝑁ℐ|𝜄𝑖∈ ℝ3 , 𝜄𝑖∈ 𝒮} are also a subset of scan mesh after rigid registration located on inspecting mounting
holes. A list of ℒ = [{ℒ1} … {ℒ𝑁ℒ}] represents 𝑁ℒ mounting holes that are used for inspection of the scan mesh. For each inspection mounting hole 𝑖, {ℒ𝑖} contains of nodes located on the edge of the mounting hole associated with
scan mesh after rigid registration. For the CAD mesh, ℐ𝐶𝐴𝐷= {𝜄
1𝐶𝐴𝐷, … , 𝜄𝑁
ℐ𝐶𝐴𝐷
𝐶𝐴𝐷 |𝜄
1𝐶𝐴𝐷∈ ℝ3} represents 𝑁ℐ𝐶𝐴𝐷nodes on
the inspecting mounting holes, and a list ℒ𝐶𝐴𝐷= [{ℒ
1𝐶𝐴𝐷} … {ℒ𝑁
ℒ𝐶𝐴𝐷
𝐶𝐴𝐷 }] presents nodes located on the edge of each
𝑁ℒ𝐶𝐴𝐷 mounting hole on the CAD mesh where 𝑁ℒ𝐶𝐴𝐷= 𝑁ℒ.
The step after pre-registration is to partition the scan mesh to meet the requirements for applying the VMASI method. As already mentioned, VMASI method is inspired by the inspection technique using loads as restraining method. Therefore, the scan mesh is properly partitioned into zones where each zone represents the contact surface between each load and the part surface. The partitioning operation can be done automatically by applying Voronoi
tessellation [23], or it can be performed manually by separating and partitioning connected triangles on scan mesh
for each zone. The partitioned into 𝑁𝒫 zones is presented as 𝓣 = [{𝒯(1)} … {𝒯(𝑁𝒫)}], where 𝒯(𝑖) represents a list of connected triangles allocated to each partitioned zone. A non-rigid registration based on our proposed VMASI method, applies restraining loads in the gravity direction introduced on the partitioned zones to deform the scan mesh towards the nominal assembly-state. This method applies an optimization method to determine restraining loads as presented in section 3.2 aiming to minimize the distance and orientation differences between the mounting holes on the scan mesh and their corresponding mounting holes on the CAD mesh.
3.2. Non-rigid registration using restraining pressures optimization (RPO)
In this step, the rigidly aligned and partitioned scan mesh of a manufactured part is virtually deformed towards the CAD mesh to place the scan mesh in assembly-state. To virtually deform this aligned and partitioned scan mesh towards the designed assembly mounting holes, the permissible forces are applied on the scan mesh using FEA. In this article, the linear FE-based transformation is applied and presented as:
{𝑓} = [𝐾]{𝑢} (1)
Where {𝑓} is the force vector, [𝐾] is the global stiffness matrix and {𝑢} is the displacement vector. It should be underlined that the global stiffness matrix for FEA is calculated using Code_AsterTM software. To fulfill the proposed VMASI method, the applied weights (sandbags) used in the practical inspection technique is simulated as pressures introduced in the gravity direction on the scan mesh. Therefore, the force vector applied in the FE calculation based on Equation (1) should be modified to take into consideration the applied pressures on each zone of partitioned scan mesh. Therefore, an extrapolation of applied presser to nodal forces is calculated for each triangle of scan mesh.
After establishing the FE-based transformation model of scan mesh, a non-rigid registration is performed using our developed Restraining Pressures Optimization (RPO) approach. The RPO approach aims at minimizing the distance and orientation differences of mounting holes on the scan mesh with respect to the nominal mounting holes on the CAD mesh. For each mounting hole, a center along with a normal vector of the hole are calculated based on the nodes located on the edge of the hole. The center of a hole is the center of mass associated with the nodes located on the edge of the hole. The normal vector of the hole, which presents the orientation of mounting hole, is the normal vector of a plane passing approximately through all the nodes on the edge of the mounting hole. The RPO approach intends to minimize the distance and orientation differences of mounting holes on the scan mesh with respect to those on the CAD mesh by estimating the required pressures on partitioned zones of the scan mesh. The RPO approach estimates these restraining pressures by setting up an optimization problem to minimize both Euclidean distances for the center of mass and orientation differences between the holes on scan and CAD meshes. The center of mass 𝑪ℒ is calculated for each list of {ℒ𝑖} presenting the nodes located on the edge of a mounting hole
in the scan mesh. On the other side, the center of mass 𝑪ℒ𝐶𝐴𝐷𝐶𝐴𝐷 is also calculated for each list of {ℒ𝑖𝐶𝐴𝐷}, which is
representing the nodes on the edge of mounting hole in the CAD mesh. As shown in Equation (2), an arithmetic average of differences (∆) between centers of mass associated with mounting holes on the scan and CAD mesh for 𝑁ℒ number of mounting holes are calculated. Meanwhile, for each mounting hole the best planar fit to the coordinate
of nodes located on the edge of a hole is calculated via a least squares regression, and then a unite vector normal to this plane presents the orientation of the hole. The normal to the plane passing through the nodes on the edge of a
8 mounting hole (for each list of {ℒ𝑖}) in scan mesh is presented by 𝒏ℒ, whereas the normal vector for CAD mesh (for
each list of {ℒ𝑖𝐶𝐴𝐷} ) is presented by 𝒏ℒ𝐶𝐴𝐷 𝐶𝐴𝐷 . ∆= 1 𝑁ℒ∑ ‖𝑪𝑖− 𝑪𝑖 𝐶𝐴𝐷‖ 𝑁ℒ 𝑖=1 (2)
To compare the mounting hole orientation on the scan mesh with respect to the CAD mesh, the angle between the normal of holes on the CAD and scan meshes is represented by 𝜃𝒏,𝒏𝑪𝑨𝑫. A root mean square deviation (𝑂), as shown
in Equation (3), is calculated for 𝑁ℒ number of mounting holes.
𝑂 = √𝑁1
ℒ∑ (𝜃𝒏,𝒏 𝑪𝑨𝑫(𝒊))2
𝑁ℒ
𝑖=1 (3)
In order to establish a proper objective function based on both distance and orientation values, a weighting factor (w) is applied to balance the magnitude between the values of distance (∆) and orientation (𝑂). Therefore, the objective function (𝑂𝐹) is generated as Equation (4).
𝑂𝐹(𝑝) = ∆ + (𝑤 × 𝑂) (4)
Wherein w can be formulated based on the proportion of initial values for distance and orientation as presented in Equation (5).
𝑤 ≈∆𝑖𝑛𝑖𝑡𝑖𝑎𝑙
𝑂𝑖𝑛𝑖𝑡𝑖𝑎𝑙 (5)
As mentioned in section 3.1, the scan mesh is partitioned into 𝑁𝒫 zones presented as triangulations lists of the
scan mesh 𝓣 = [{𝒯(1)} … {𝒯(𝑁𝒫)}] wherein {𝒯(𝑖)} is a list of connected triangles associated with each partitioned zone
on the scan mesh. The RPO approach is followed by solving the constrained nonlinear optimization problem, presented in Equation (6), to minimize both distance and orientation differences between the scan and CAD meshes by estimating the permissible required pressures (𝒫) applied on 𝑁𝒫 partitioned zones of scan mesh in the gravity
direction. arg min
𝒫 𝑂𝐹(𝒫) (6)
𝑠𝑢𝑏𝑗𝑒𝑐𝑡 𝑡𝑜 𝑃𝑖≤𝑃𝑖𝑀𝑎𝑥 , 𝑖 = 1, … , 𝑁𝒫
The argument of the objective function 𝒫 represent the magnitude of pressures in the gravity direction introduced to each partitioned zone on the scan mesh. This optimization problem is solved using the constrained nonlinear optimization function fmincon with the active-set algorithm implemented in MATLABTM. The output of Equation (6) is an estimation of required pressures on the scan mesh that predicts the functional shape of scan mesh through the FE-bases transformation in the assembly-state whereas the minimum distance and orientation differences between the mounting holes on the predicted shape of scan mesh and nominal CAD model are achieved. The argument is generated as a 𝑁𝒫× 1 vector 𝓟 = 〈𝑃1, … , 𝑃𝑁𝒫〉, where 𝑃𝑖∈ ℝ
+ and the magnitude of the pressur 𝑃 𝑖 is
limited, with an inequality constraint in the optimization problem, to the magnitude of maximum permitted pressure on each partitioned zone (𝑃𝑖𝑀𝑎𝑥). The permitted pressure 𝑃𝑖𝑀𝑎𝑥is calculated by multiplying the magnitude of
maximum permitted restraining force as presented in the GD&T specifications multiplied by the area of each partitioned zone 𝐴𝒫𝑖. The direction of restraining pressures is always that of the gravity since it is simulating the
realistic weight of sandbags applied in each partitioned zone. Applying the optimized pressure values 𝓟 in the FEA-based transformation, the scan mesh (𝒮) is deformed towards the nominal assembly mounting holes generating the
predicted functional shape of scan mesh in assembly-state (𝒮𝑜𝑝𝑡).
3.3. Inspection and evaluation
As mentioned in section 3.2, the optimization problem of Equation (6) estimates the required restraining pressures on the partitioned zones of the scan mesh. Using the optimized pressures in the FEA-based transformation presented in Equation (1), the scan mesh (𝒮) is deformed to generate the predicted functional shape of a scan mesh in
assembly-state (𝒮𝑜𝑝𝑡). The nodes associated with the 𝑁ℒ mounting holes on the predicted shape of scan mesh are
accordingly presented with ℐ𝑜𝑝𝑡, and a list of ℒ𝑜𝑝𝑡 = [{ℒ𝑜𝑝𝑡1} … {ℒ𝑜𝑝𝑡𝑁ℒ}] specify nodes located on the edge of
each mounting hole on the predicted shape of scan mesh. To evaluate the acceptance of the deviated manufactured part in assembly-state, each mounting hole on the predicted shape of scan mesh is examined with reference to the nominal mounting holes and the dedicated tolerances. Based on GD&T standards, the assembly tolerance of a part consists of the position and profile tolerances. For ordinary non-rigid parts used in aerospace industry, the position
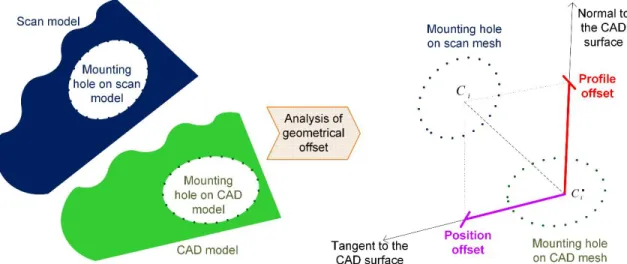
9 and profile tolerances are commonly determined as ±0.4 mm. Referring to section 7.5 (paragraph 7.5.5) in ASME Y14.5 (2009), the position and profile offset of a part, as shown in Figure 4, depends directly to the position of center of mass associated with a mounting hole. The Euclidian distance between the center of mass for the hole on scan and CAD mesh (between 𝑪𝑖 and 𝑪𝑖𝐶𝐴𝐷) is presented with blue dotted-lined in Figure 4. According to ASME
Y14.5 (2009), the projection of this line on the normal direction of the CAD surface presents the profile offset, whereas the projection of the Euclidian distance on the tangent direction of the CAD surface presents the position offset. Therefore, a deviated manufactured part can be accepted for the assembly-state if the position and profile offsets for each mounting hole on the predicted shape of the scan mesh under estimated pressures remains in the dedicated tolerance range (∅0.8 mm).
Figure 4: Analysis of geometrical offset based on GD&T specification.
The orientation of mounting holes on the predicted shape of a scan mesh is an additional criterion for accepting or rejecting a deviated manufactured part. As depicted in Figure 5, the orientation offset (𝛿) of a mounting hole depends to the thickness of non-rigid part. The acceptance criterion of a non-rigid part in an assembly-state based on GD&T specification mandates that the orientation offset (𝛿) of a mounting hole must remain in the tolerance range. The orientation difference, which is the representative angle between the normal vectors associated to the mounting hole on the CAD and scan models, is related to the orientation offset with Equation (7).
𝑡 × tan 𝜃𝒏,𝒏CAD= 𝛿 (7)
Regarding the determined tolerance for typical aerospace parts (±0.4 mm) and considering the thickness of a non-rigid part, the maximum tolerable orientation difference (𝜃𝒏,𝒏CAD) is obtained from Equation (7).
Figure 5: Schematic misalignment of assembly mounting hole on predicted shape of scan model with respect to the CAD model.
10 3.4. The proposed VMASI algorithm
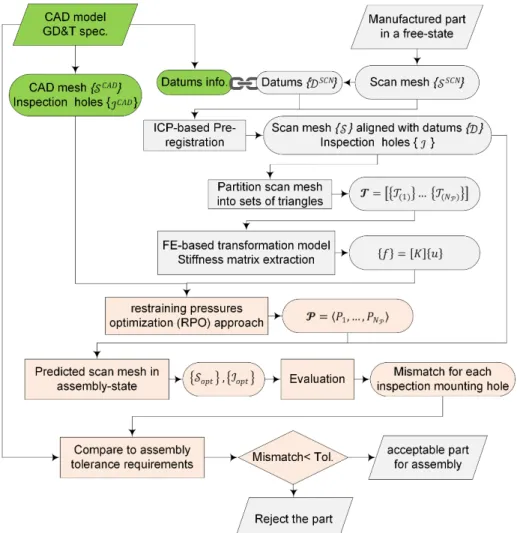
The VMAI method outlined in the above four modules is summarized and illustrated in the flowchart shown in Figure 6. The scan mesh of a manufactured part in a free-state and its nominal CAD model along with GD&T specification is considered as the inputs of our proposed method. In other words, inspection datums information, mounting holes position, CAD mesh (𝒮𝐶𝐴𝐷) and scan mesh (𝒮𝑆𝐶𝑁) with acceptable mesh quality for FEA are the
inputs required for the proposed method. From these inputs, the method proceeds through the following main steps: 1. ICP-based pre-registration between 𝒮𝑆𝐶𝑁 and 𝒮𝐶𝐴𝐷 aligns the datums on scan mesh with respect to
datums on the CAD mesh for which the scan mesh after rigid registration is presented as 𝒮.
2. Partitioning the scan mesh into 𝑁𝒫 zones for which the partitioned scan mesh is presented by lists of
connected triangles in each partition as 𝓣 = [{𝒯(1)} … {𝒯(𝑁𝒫)}].
3. Establishing the FE-based transformation as {𝑓} = [𝐾]{𝑢}, and extracting the relevant stiffness matrix for the scan mesh of manufactured part.
4. Applying a non-rigid registration using the RPO approach to estimate the required restraining pressures as 𝓟 = 〈𝑃1, … , 𝑃𝑁𝒫〉 for minimizing the distance and orientation differences between the scan and CAD
mounting holes.
5. Introducing the required restraining pressures to the scan mesh via the FE-based transformation and predicting the shape of scan mesh in assembly-state as 𝒮𝑜𝑝𝑡.
6. Inspecting each mounting hole on the predicted shape of scan mesh with respect to tolerances to accept or reject the manufactured part for pursuing the assembly stage.
Figure 6: Flowchart algorithm of proposed VMASI method.
4. Application of proposed VMASI method on real parts
4.1. Introduction: validation cases
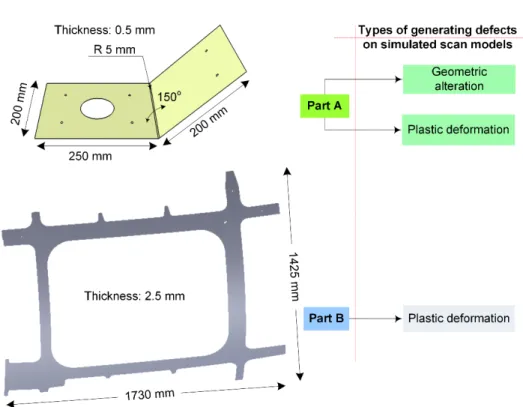
In this section, our proposed fixtureless inspection method (VMASI) is applied on two aluminum parts referred as part A and part B to validate the performance of the proposed method including different types of defects in
free-11 state. Part A is a non-rigid support V-shaped part formed with a specific forming angle, and part B is a relatively large non-rigid panel typically used in aerospace industry. Scan models of the parts studied in this paper are generated by adding synthetic defects to the CAD models of these parts. Thus shape, amplitude and location of all defects are known, which allows a detailed analysis of VMASI results. The generated scan meshes, representing different types of deviated non-rigid manufactured parts (as depicted in Figure 7), are then virtually inspected by VMASI method to ensure the feasibility of assembling these deviated parts in its functional assembly-state. The VMASI assesses the required restraining loads as a set of pressure on the scan mesh in the direction of gravity, which replicates the inspection technique using weights (sandbags). These required pressures are calculated using our developed restraining pressures optimization (RPO) approach. As introduced in section 3, along this optimization process, a maximum threshold is applied on restraining pressures depending on part material, dimensions and thicknesses. Applying these required pressures on a scan mesh of a deviated part predict the functional shape of scan mesh wherein the position and orientation of mounting holes are well-aligned with those of nominal CAD model. Inspecting each mounting hole on the predicted shape of scan mesh in assembly-state with respect to the determined assembly tolerances ensures the possibility of successful assemblage for the geometrically deviated part. As mentioned in Equation (6), the proper weighting factor (w) is required to be calculated for these non-rigid parts to balance the magnitude of distance and orientation (respectively Equation (2) and (3) in the RPO approach). Based on different attempts for each case studied in this paper, the weighting factor (w) that properly satisfy the magnitude balance between the elements of Equation (6) is calculated by Equation (7). The coefficient of proportionality in this Equation is empirically determined as 0.5 because this value well-moderate the proportion that is used as trials for the cases studied in this paper.
𝑤 = 0.5 (∆𝑖𝑛𝑖𝑡𝑖𝑎𝑙
𝑂𝑖𝑛𝑖𝑡𝑖𝑎𝑙) (7)
Figure 7: Synthesis of validation cases with different types of defects.
We have implemented our fixtureless method on validation parts using several tools. Mesh generation, FEA simulation and extracting the stiffness matrix of scan mesh are performed using the research platform developed by our research team [24]. This platform is based on C++ code, on Open CASCADETM libraries for geometry and on Code_AsterTM as FEA solver. We also use GmshTM [25] for visualizing 3D models. Finally, the automatic mesh partition process, as well as optimization problem, is solved using the constrained nonlinear optimization function in MATLABTM (using fmincon with the active-set algorithm) to validate the distance distribution of estimated defects. This process takes approximately 8 minutes on a computer equipped with an Intel(R) CoreTM i7 at 3.60 GHz with 32 GB RAM.
12 4.2. Results for part A
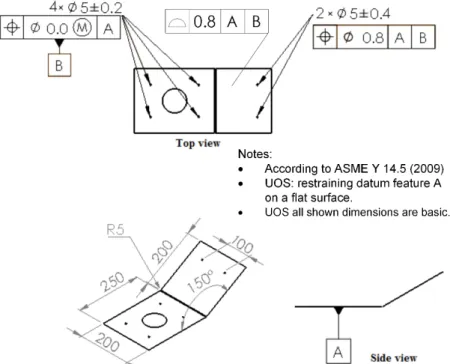
The different scan meshes for cases studied based on part A are attained by adding two different types of synthetic defects such as geometric alterations for some selected features and plastic deformation(s) (see Figure 7). Part A is an aluminum plate with 0.5 mm thickness which is formed in a V-shape with an angle 150 deg. (250 × 200 mm for the horizontal side, and 200 × 200 mm for the other side). The horizontal side of the part should be constrained as shown in Figure 8. Therefore, the horizontal side of the part is located on the plane as datum A. Referring to the GD&T specification, the pattern of 4 holes also should be constrained as datum B. These holes during the inspection are fixed in the design datum position. It should be emphasized that we assume datum features on the scan models are perfect, which means the flatness of the horizontal side and the position of four datum holes are perfectly respected. The inspection is also accomplished on the two mounting holes located on the right side where the assembly tolerance is ∅0.8 mm.
Figure 8: GD&T specification for part A (dimensions are in mm).
To evaluate the performance of our proposed method, different types of defects are generated and simulated based on the CAD model. Therefore, geometric alterations (described in section 4.2.1) representative for springback effect in sheet metal forming process are used to generate a defect by decreasing the forming angle. Another type of defect that is simulated on part A is plastic deformation that can be occurred during any manufacturing or handling process before inspection process. As described in section 4.2.2, a non-linear FE simulation is performed wherein a plastic deformation is added into the CAD model of part A. To accomplish this, a proper load is first introduced on the CAD model to deform the model into the plastic zone. Plastic deformation remaining on the model after releasing the load represents the added defect to the CAD model of the part. In Table 1, a synthesis of validation cases for part A, describing each validation case along with an assigned label, is shown. It should be underlined that the maximum permissible restraining pressure for part A is 10 lbf/ft2 (approximately 480 Pa). Meanwhile, the maximum tolerable orientation difference for mounting holes on the CAD and scan models is calculated as 38 deg. with respect to the dedicated tolerance (∅0.8 mm) and the constant thickness of part A (0.5 mm).
Table 1: Synthesis of validation cases defects for part A.
Description for defects of part A Assigned label for each validation case
Generated by decreasing 1 deg. of forming angle A-1 Generated by decreasing 3 deg. of forming angle A-2 Generated by decreasing 5 deg. of forming angle A-3
Simulated as a small plastic defect A-4
13 4.2.1. Scan models of part A with defects generated by geometric alteration
As previously mentioned, scan models in this study are generated by adding defects to the CAD model. In this section, defects are generated by decreasing the forming angle of the V-shaped model using geometric transformation. Therefore, three magnitudes of defects are performed by decreasing 1, 3 and 5 deg. of forming angle with respect to the nominal forming angle (150 deg.). These defects respectively result in a maximum displacement of 3.5, 10.5 and 17.5 mm in the corresponding scan models. To implement the proposed VMASI method on the scan models of part A, a FE mesh of the scan model is generated to present the scan mesh.
The first scan model of part A, as labeled in Table 1 with A-1, includes a defect where the V-shaped forming angle is decreased to 149 deg. with respect to the nominal angle, which is 150 deg. The displacement distribution of scan model with respect to the CAD model of part A is depicted in Figure 9-a. This shows the maximum displacement between the models reaches to 3.5 mm. The scan mesh of this model is generated with a FE mesh quality and then is partitioned into 10 zones as shown in Figure 9-b. Then the stiffness matrix of the scan mesh is extracted based on the mechanical property and thickness of the part. Applying the restraining pressures optimization (RPO) approach, the required pressures in the gravity direction on each partitioned zone of the scan mesh is found in which the scan mesh under these pressers is deformed to predict the functional shape of scan mesh in assembly-state. To this end, the optimization approach aims to minimize the distance and orientation difference between the mounting holes on the predicted shape of scan mesh with respect the CAD mesh. Based on GD&T specification, the horizontal side of the part consisting zones 7, 8, 9 and 10 should be constrained on datum A. Therefore, applying restraining pressures on these zones is meaningless since these partitions of the part are already constrained on a flat surface in the gravity direction. For this reason, the RPO approach is applied to estimate the restraining pressures only on the right side of the part restraining the zones 1, 2, 3, 4, 5 and 6. As depicted in Figure 9-b and summarized in Table 2, these pressures should be applied on partitioned zones of 3, 4, 5 and 6 respectively with 60, 62, 19 and 30 Pa. The inspection for predicted shape of scan mesh under the required pressures is performed for the mounting holes placed on the right side of the part A shown as FEATURE 1 and FEATURE 2 in Figure 9-b. As depicted in Table 3, position and profile offsets for both mounting holes are less than the dedicated tolerances while the orientation of holes is also acceptably aligned with the CAD model. This means that the geometrically deviated scan mesh (presenting defect) can be assembled in the functional position with respect to the tolerance. Therefore, the deviated manufactured part is accepted to pass forward to the assembly stage.
Figure 9: a) Displacement distribution [mm] of deviated scan model generated by decreasing 1 deg. of forming angle; b) The partitioned scan model and predicted assembly pressure.
14
Table 2: Assembly pressure and force results for the validation case A-1.
Zones [mmArea 2] Permissable restraining pressures [Pa] Pressure [Pa] Force [N]
1 7563 480 0 0.00 2 7563 480 0 0.00 3 6208 480 60 0.37 4 6208 480 62 0.38 5 6490 480 19 0.12 6 6490 480 30 0.20
Table 3: Position, profile and orientation results for the validation case A-1.
Mounting holes Position offset [mm] Profile offset [mm] Orientation difference [deg.] Feature 1 0.03 (accepted ) 0.03 (accepted ) 0.25 (accepted ) Feature 2 0.03 (accepted ) 0.02 (accepted ) 0.25 (accepted )
The second scan model, as shown in Table 1 with A-2, is generated in the same way with a forming angle decreased by 3 deg., which consequently result in 10.5 mm of maximum displacement comparing as shown in Figure 10-a. The FE mesh of this deviated model is generated and partitioned into 10 zones. Considering the constraints of datum A, the RPO approach is applied to zones 1, 2, 3, 4, 5 and 6. The required pressures in the gravity direction on the corresponding partitioned zones minimize the distance and orientation differences between the mounting holes of the scan and CAD meshes. These required pressures and the corresponding zones are summarized in Table 4 and depicted in Figure 10-b. Recovering the predicted shape of a scan mesh in assembly-state under the required pressures via FEA, the inspection is accomplished by comparing each mounting hole on the predicted scan mesh and CAD model with respect to the tolerance. As presented in Table 5, the position and profile offset of mounting holes on the predicted scan mesh in assembly-state are still in the tolerance zone, and the orientation differences are negligible.
Figure 10: a) Displacement distribution [mm] of deviated scan model generated by decreasing 3 deg. of forming angle; b) The partitioned scan model and predicted assembly pressure.
15
Table 4: Assembly pressure and force results for the validation case A-2.
Zones Area
[mm²] Permissable restraining pressures [Pa] Pressure [Pa] Force [N]
1 7731 480 0 0.00 2 7731 480 0 0.00 3 6125 480 199 1.22 4 6125 480 207 1.27 5 6407 480 8 0.05 6 6407 480 27 0.17
Table 5: Position, profile and orientation results for the validation case A-2.
Mounting holes Position offset [mm] Profile offset [mm] Orientation difference [deg.] Feature 1 0.22 (accepted ) 0.18 (accepted ) 0.71 (accepted ) Feature 2 0.21 (accepted ) 0.21 (accepted ) 0.71 (accepted )
Decreeing the forming angle by 5 deg. (from 150 deg. to 145 deg.) in the third case of part A, as labeled in Table 1 with A-3, the maximum displacement between the scan and CAD models reaches 17.5 mm as shown in Figure 11-a. The scan mesh with FE mesh-quality is generated from the deviated scan model, and then it is partitioned into the zones. Applying RPO, the required pressures on the right side of the part (zones 1, 2, 3, 4, 5 and 6) to minimize the distance and orientation difference between the predicted shape of scan mesh and CAD is calculated as presented in Figure 11-b and Table 6. Using these pressures on the scan mesh and recovering the predicted shape of scan mesh in the assembly-state, the inspection is accomplished by comparing between the mounting holes of the scan mesh with the CAD mesh. As summarized in Table 7 in red, both position and profile offsets are exceeding the assembly tolerance for typical non-rigid parts, and the orientation offset surpasses 1 deg. of orientation difference. In fact, this deviated scan model cannot be assembled in the functional state with respect to the assembly tolerances.
Figure 11: a) Displacement distribution [mm] of deviated scan model generated by decreasing 5 deg. of forming angle; b) The partitioned scan model and predicted assembly pressure.
16
Table 6: Assembly pressure and force results for the validation case A-3.
Zones Area
[mm2] Permissable restraining pressures [Pa] Pressure [Pa] Force [N]
1 7915 480 0 0.00 2 7915 480 0 0.00 3 6032 480 351 2.11 4 6032 480 358 2.16 5 6315 480 37 0.24 6 6315 480 49 0.31
Table 7: Position, profile and orientation results for the validation case A-3.
Mounting holes Position offset [mm] Profile offset [mm] Orientation difference [deg.] Feature 1 0.56 (rejected) 0.52 (rejected) 1.05 (accepted) Feature 2 0.56 (rejected) 0.54 (rejected) 1.05 (accepted)
4.2.2. Scan models of part A with defects simulated by plastic deformation
Deviations in the scan model can also originate from residual plastic deformation. This type of defect is simulated using non-linear FEA and simulating the residual plastic deformation of a model after releasing the applied loads. The fourth case of part A, as labeled in Table 1 with A-4 and shown in Figure 12-a, represents a scan model in which the maximum displacement with reference to the CAD model reaches to 9.2 mm. This scan mesh of the model is generated and partitioned into 10 zones. Applying the RPO approach on the right side (on zones 1, 2, 3, 4, 5 and 6), the required pressures are presented in Table 8. These pressures on the scan mesh are calculated to minimize the distance and orientation difference of the mounting holes on the predicted shape of scan mesh with respect to the CAD mesh. Inspecting the predicted shape of scan mesh, as summarized in Table 9, the position and profile offsets for both mounting holes are in tolerance range, and the orientation difference is negligible. Therefore, this deviated scan model is acceptable for being assembled in the assembly-state.
Figure 12: a) Displacement distribution [mm] of slightly deviated scan mesh simulating a plastic defect; b) The partitioned scan model and predicted assembly pressure.
17
Table 8: Assembly pressure and force results for the validation case A-4.
Zones [mmArea 2] Permissible restraining pressures [Pa] Pressure [Pa] Force [N]
1 7486 480 0 0.00 2 7486 480 0 0.00 3 6247 480 195 1.22 4 6247 480 204 1.28 5 6529 480 19 0.12 6 6529 480 36 0.24
Table 9: Position, profile and orientation results for the validation case A-4.
Mounting holes Position offset [mm] Profile offset [mm] Orientation difference [deg.] Feature 1 0.30 (accepted) 0.15 (accepted) 0.32 (accepted) Feature 2 0.30 (accepted) 0.15 (accepted) 0.32 (accepted)
The last case of part A, as labeled in Table 1 with A-5, is simulating a greater plastic defect. In this case, the maximum displacement of scan model reaches 12.5 mm (see Figure 13-a). Applying the RPO approach on the deviated scan mesh (on zones 1, 2, 3, 4, 5 and 6), the required pressures are calculated as presented in Figure 13-b and Table 10. Applying these pressures on the deviated scan mesh via FEA and recovering the predicted shape of scan mesh in the assembly-state. As presented in Table 11, position offsets for both mounting holes exceed the tolerance value which means that we cannot accept this deviated part for precise assembly.
Figure 13: a) displacement distribution [mm] of deviated scan mesh simulating a plastic defect; b) the partitioned scan model and predicted assembly pressure.
Table 10: Assembly pressure and force results for the validation case A-5.
Zones [mmArea 2] Permissible restraining pressures [Pa] Pressure [Pa] Force [N]
1 7486 480 0 0.00 2 7486 480 0 0.00 3 6247 480 279 1.75 4 6247 480 283 1.77 5 6529 480 38 0.25 6 6529 480 58 0.38
18
Table 11: Position, profile and orientation results for the validation case A-5
Mounting holes Position offset [mm] Profile offset [mm] Orientation difference [deg.] Feature 1 0.56 (rejected) 0. 28 (accepted) 0.34 (accepted) Feature 2 0.56 (rejected) 0. 22 (accepted) 0.39 (accepted)
4.3. Results for part B
Part B (Figure 7) is representative of an aerospace aluminum panel with 2.5 mm thickness, and dimensions of approximately 1730 × 1425 mm (area of 0.59 m2). To make an inspection on this part, as depicted in Figure 14, the part is first mounted on datum targets (datum A). Then, the tooling (fixing) hole of datum B is adjusted in its designed position by using an adjusting pin. In order to perform the inspection in reality, applying physical datums, the part is imposed to be statically stable by inserting another adjusting pin into a slotted tooling hole (datum C). The tooling hole of datum C located on the diagonally opposite side with respect to the tooling hole associated with datum B. In fact, the slotted tooling hole is aligned along the diagonal line (dotted line in Figure 14-b) passing through the center of the tooling hole for datum B. The datum C constrained the part against free rotation around datum B but still let freedom for adjustment and alignment of the part in its assembly-state along the diagonal line. The restraining loads such as weights (sandbags) on different zones on the surface of the panel can be applied to place the deviated manufactured panel in its assembly position. As shown in Figure 14-a, conventional inspection methods apply a huge number of fixtures to retrieve the fictional shape of the deviated manufactured part on these physical complex inspection fixture. However, the simulation through our VMASI method aims at virtually mounting deviated manufactured parts in assembly-state, wherein datums are imposed as boundary conditions in a FEA. In this study, the least possible number of fixtures (only 9 fixtures) are used for simulating datum targets (datum A). It is supposed that the tooling (fixing) hole of datum B is perfectly positioned in the design location. Therefore, imposed displacement on the edges of tooling hole is introduced as constraints in FEA. Imposing displacement constraints on the edges of a tooling hole provides a statically stable model for our VMASI method. Therefore, the VMASI method for the cases studied on part B considers only datum A and B as imposed BCs applied in FEA regardless of imposing any boundary condition on datum C. The position and value of required pressures, representing weights, are calculated using our RPO approach where the scan model in the assembly-state is predicted by minimizing the distance and orientation difference of mounting holes. Then, the inspection is accomplished on these mounting holes shown as FIXTURE 1, 2, 3 and 4 in Figure 15-b, to ensure they are placed in the assembly-state with respect to the tolerance range (∅0.8 mm). Dimensions of part B make that the maximum permissible restraining force is 20 lbf/ft2 (approximately 960 Pa). Meanwhile, the maximum tolerable orientation difference for mounting holes on the CAD and scan models is calculated as 9 deg. based on the constant thickness of part B (2.5 mm).
19
Figure 14: a) The manufactured part mounted on inspection fixtures where a real point cloud of scan mesh can be acquired, in our proposed method only 9 fixation features are kept as datums; b) GD&T specification for part B
(dimensions are in mm).
The first case of part B presents a deviated scan model as shown in Figure 15-a, which simulates a plastic deformation remaining in the manufactured part. This defect results in a maximum displacement of 15 mm in the scan mesh of the part in a free-state. This defect on the scan mesh is simulated using a non-linear FE where the CAD mesh is loaded to deform into the plastic zone, and then the residual displacement simulates the defects after removing the load. Partitioning the deviated scan mesh and applying RPO approach on all partitioned zones, the required pressures on each partitioned zone is calculated to predict the functional shape of scan mesh in assembly-state as presented in Figure 15-b and Table 12. Inspecting the predicted shape of a scan mesh on each mounting hole concerning the CAD mesh, as presented in Table 13, demonstrates that the mounting holes on the predicted scan mesh in assembly-state are in the tolerance range. This means that the deviated scan model can be assembled in its assembly-state with respect to the tolerance.
20
Figure 15: a) Displacement distribution [mm] of deviated scan mesh simulating a small plastic defect; b) The partitioned scan model and predicted assembly pressure.
21
Table 12: Assembly pressure and force results for the validation case of part B simulated as a small plastic defect.
Zones [mmArea 2] Permissible restraining pressures [Pa] Pressure [Pa] Force [N]
1 79536 960 0 0.00 2 27415 960 0 0.00 3 47603 960 1 0.05 4 64293 960 4 0.23 5 87762 960 2 0.16 6 79926 960 1 0.10 7 80801 960 0 0.00 8 52094 960 0 0.00 9 42547 960 0 0.00 10 30067 960 50 1.50
Table 13: Position, profile and orientation results for the validation case of part B simulated as a small plastic defect.
Mounting holes Position offset [mm] Profile offset [mm] Orientation difference [deg.] Feature 1 0.01 (accepted) 0.00 (accepted) 0.07 (accepted) Feature 2 0.03 (accepted) 0.17 (accepted) 0.02 (accepted) Feature 3 0.03 (accepted) 0.13 (accepted) 0.02 (accepted) Feature 4 0.00 (accepted) 0.01 (accepted) 0.08 (accepted)
The second case of part B simulates an intermediate plastic defect for deviated scan mesh in a free-state. Maximum displacement of this intermediate plastic defect reaches 21 mm (see Figure 16), which is an intermediate value between the small plastic defect ( (15 mm as shown in Figure 15 ) and the large plastic defect (28 mm as shown in Figure 17). After partitioning this scan model, the required assembly loads are estimated by RPO approach and presented in Table 14. Applying these estimated pressures on the partitioned zones via a FE-based transformation, the functional shape of scan model in assembly-state is predicted. The mounting holes on this predicted shape are aligned and approached with respect to the nominal features on the CAD model. The inspection is implemented on the mounting holes and presented in Table 15, which results that the profile offsets associated with mounting holes (Feature 1 and 2) are out of the tolerance range. This concludes that the deviated scan model cannot be appropriately assembled.
22
Figure 16: a) Displacement distribution [mm] of deviated scan mesh simulating an intermediate plastic defect; b) the partitioned scan model and predicted assembly pressure.
![Figure 1: An ordinary aerospace panel a) in free-state, b) constrained on supports of the inspection fixture [1]](https://thumb-eu.123doks.com/thumbv2/123doknet/14605505.731747/2.918.243.691.581.787/figure-ordinary-aerospace-panel-constrained-supports-inspection-fixture.webp)
![Figure 9: a) Displacement distribution [mm] of deviated scan model generated by decreasing 1 deg](https://thumb-eu.123doks.com/thumbv2/123doknet/14605505.731747/13.918.144.781.569.862/figure-displacement-distribution-deviated-scan-model-generated-decreasing.webp)
![Figure 10: a) Displacement distribution [mm] of deviated scan model generated by decreasing 3 deg](https://thumb-eu.123doks.com/thumbv2/123doknet/14605505.731747/14.918.147.778.558.854/figure-displacement-distribution-deviated-scan-model-generated-decreasing.webp)
![Figure 11: a) Displacement distribution [mm] of deviated scan model generated by decreasing 5 deg](https://thumb-eu.123doks.com/thumbv2/123doknet/14605505.731747/15.918.146.781.543.834/figure-displacement-distribution-deviated-scan-model-generated-decreasing.webp)
![Figure 12: a) Displacement distribution [mm] of slightly deviated scan mesh simulating a plastic defect; b) The partitioned scan model and predicted assembly pressure](https://thumb-eu.123doks.com/thumbv2/123doknet/14605505.731747/16.918.142.779.576.873/displacement-distribution-slightly-deviated-simulating-partitioned-predicted-assembly.webp)
