HAL Id: hal-01807796
https://hal.archives-ouvertes.fr/hal-01807796
Submitted on 5 Jun 2018
HAL is a multi-disciplinary open access
archive for the deposit and dissemination of
sci-entific research documents, whether they are
pub-lished or not. The documents may come from
teaching and research institutions in France or
abroad, or from public or private research centers.
L’archive ouverte pluridisciplinaire HAL, est
destinée au dépôt et à la diffusion de documents
scientifiques de niveau recherche, publiés ou non,
émanant des établissements d’enseignement et de
recherche français ou étrangers, des laboratoires
publics ou privés.
Replicating Speech Rate Convergence Experiments on
the Switchboard Corpus
Simone Fuscone, Benoit Favre, Laurent Prevot
To cite this version:
Simone Fuscone, Benoit Favre, Laurent Prevot. Replicating Speech Rate Convergence Experiments
on the Switchboard Corpus. Workshop on Replicability and Reproducibility of Research Results in
Science and Technology of Language, May 2018, Miyazaki, Japan. �hal-01807796�
Replicating Speech Rate Convergence Experiments on the Switchboard Corpus
Simone Fuscone
1,2, Benoit Favre
2and Laurent Prévot
2,3 1Aix-Marseille Univ, CNRS, LPL, Aix-en-Provence, France 2Aix Marseille Univ, Université de Toulon, CNRS, LIS, Marseille, France3Institut Universitaire de France, Paris, France
Abstract
Replicability of scientific studies grounded on language corpora requires a careful approach of each step from data selection and preprocessing up to significance testing. In this paper, we propose such a replication of a recent study based on a classic conversational corpus (Switchboard). The study (Cohen Priva et al., 2017) focuses on speech rate convergence between speakers in conversation. While the replication confirms the main result of the original study, it also shows interesting variations in the details. Moreover we take this opportunity to test further the study for its robustness with regard to data selection and preprocessing as well as to the underlying model of the variable (speech rate). The analysis also shows that another approach is necessary to consider the complex aspects of the speech rate in conversations. Pushing further a previous analysis is another benefit of replication in general: testing and strengthening the results of other teams and increasing validity and visibility of interesting studies and results.
Keywords:replication study, convergence, speech rate
1.
Introduction
Convergence phenomena are well known in the speech science community: two speakers tend to co-adjust their speaking style in order to ease communication. In a conver-sation, we call each conversant as ’speaker’ and his coun-terpart as ’interlocutor’. Behavior coordination between a speaker and his interlocutor has been shown to occur at var-ious levels, like syntactic structures or referring expressions (Pickering and Garrod, 2004) and to accommodate to each other (Giles and Coupland, 1991). This study sought to replicate and expand the work of (Cohen Priva et al., 2017) which shows evidence about the phenomenon of accommo-dation. Their work focused on the speech rate convergence between speakers in the Switchboard corpus (Godfrey et al., 1992), (Godfrey and Holliman, 1997). The goal of our study is at first show that it’s possible to replicate the results of the work by Priva et al. following the same procedure and using the same statistical tools.
Replicability starts to receive a well-deserved attention from the Natural Language Processing (NLP) community. In language sciences and in particular in NLP, replicating a result may involve many detailed steps from the raw data to actual results. The replicability effort concerns therefore mainly the choices for data selection, pre-processing and the different steps in the analysis for which we try to follow the exact procedure of the replicated study. Interestingly, while the main lines and results of the replicated study are confirmed, particular results differ despite our care in not altering the original experimental setup. Moreover, based on our replication we can explore the robustness of the results by varying some of the parameters of the original study. We believe this is another interest in replicating a study.
The replication includes two parts: (i) one related to the ef-fects of sex and age that affect the speech rate; (ii) and a second one which ensures the convergence of the speaker’s speech rate to their baseline and the interlocutor’s speech rate baseline. The second part will show further analysis performed on the corpus using the same model. At first we
used different subsets of the main corpus changing the num-ber of minimum conversations per speaker, then we tested another approach to compute the word expected duration and finally validated the model with a k-fold cross valida-tion technique. In this last part, we also point out the neces-sity to have a different approach that could considers the temporal dynamic of speech rate, showing an example of the complex nature of the convergence.
The paper is organized as follows. After motivating the general interest for the research question (Section 2.), we present our replication (Section 3.) of the different experi-ments. Before concluding we propose some addition to the initial study in section 4. in particular with regard to data set selection, to the underlying model, and pointing out the issue of the dynamic of the speech rate
2.
Motivation
Speech rate is one of the aspects in which convergence arises. In (Buller and Aune, 1992) some effects of the speech rate were shown in accommodation theory while (Manson et al., 2013) assess that convergence in speech rate predicts cooperation. As summarized in the work of (Cohen Priva et al., 2017), convergence during conversa-tions could be attributed to the sex and age of the speak-ers (Hannah and Murachver, 1999; Kendall, 2009; Babel, 2012). Moreover, they recall that research has suggested women generally converge more than men (R.Bilous and M.Krauss, 1988; Gallois and Callan, 1988; Willemyns et al., 1997), though such results are often small and com-plex. Additional effects have been found on the interaction between speaker sex and interlocutor sex.1(Kendall, 2009)
found that speech rates were more strongly affected by the interlocutor’s sex than by the speaker’s sex—both male and female speakers talked in a similar, slow rate when inter-viewed by a woman, and faster when the interviewer was a man. The aim of this work is to replicate and expand (Co-hen Priva et al., 2017), in order to take into account speech
1
For the sake of clarity, we will call the ’other speaker’, the
rate as one of the aspects to study convergence in dyadic conversations.
The goal of the Cohen et al. study was at first to analyze the effects of age and sex on speech rate and then study convergence in terms speakers and interlocutors’ baseline. As they showed a speaker may increase their usual speech rate (the baseline) in response to a fast-speaking interlocu-tor or vice versa. They also noted external facinterlocu-tors could affect speech rate too. For example, controversial topics may incur faster speech rates as speakers get more involved. Previous work has measured convergence using third-party judgment (human judgment) (Namy et al., 2002; Goldinger, 1989), a comparison of the speech rate in the same conver-sation or comparing the speech rate with various baseline (Street, 1984; Levitan and Hirschberg, 2011; Pardo, 2006; Sanker, 2015). Priva et al. instead compared the speech rate of both conversants with their baseline performed in conversations with different speakers/interlocutors respec-tively.
This choice avoids the influence of inner factors in the con-versations. As outlined in the previous work, in (Smith et al., 1975; Smith et al., 1980; Street, 1984) it is shown that people consider speakers with greater speech rate as more competent, so conversants could increase their speech rate to fit these impressions. Also, facial or body language expressions could affect the speech rate and the dynamic of the conversations. The use of the Switchboard dataset which is formed by telephone conversations with more than one conversation per speaker allows to smooth both these effects.
3.
Replication Study
To ease the comparison with the work of Priva et al. we will use the same definitions. The speaker speech rate while speaking with the interlocutor I is indicated as SI, while
in-terlocutor speech rate with the speaker S is IS. The speech
rate baseline of the speaker in other conversations, with ev-eryone except I is indicated as S−I. Similarly I−S is the speech rate baseline of the interlocutor while speaking with everyone except S.
The data used in the replication is the same of the paper by Priva et al., the Switchboard corpus (Godfrey et al., 1992) in which participants took part in multiple telephonic con-versations. There are 543 speakers in the corpus, with about 2400 conversations containing transcription for each dia-logue, with conversants of mixed/same sex and ages. The speakers are strangers and each speaker was paired ran-domly by a computer operator with various other speakers; for each conversation a topic (from a list of 70 topics) was assigned randomly. In the pure replication stage were taken into account just conversations in which both conversants have at least one additional conversation with a different speaker, as in the original study. So after filtering the data by excluding speakers occurring in only one conversation we have 4788 sides of conversations and 479 speakers.
3.1.
Speech Rate
In their work, Priva et al. computed Pointwise speech rate for an utterance as the ratio between utterance duration and
utterance expected duration. The speakers speech rate was
calculated as the mean of the log pointwise speech rates of all utterances having four or more words. Shorter ut-terances were removed because many of these are back-channels (Yngve, 1970), such as ’yeah’ or ’uhuh’, which may exhibit specific phenomena with regard to speech rate. In addition, both the speakers and the interlocutors baseline speech rate were calculated using the mean speech rate of that caller in other conversations (SI and IS, respectively).
Utterance expected duration was defined as the sum of the expected durations of all words in the utterance, excluding silences, filled pauses (uh, um) and oh. Utterance duration was defined as the time from the beginning of the first word in an utterance, which was not a silence or filled pause, until the end of the last word in that utterance, which was not a silence or filled pause, but including intermediate silences and filled pauses.
To calculate each words expected duration, Priva et al. used a linear regression model, in which the median duration of that word across the entire Switchboard corpus, the length of the utterance, and the distance to the end of the utterance (in words) are the predictors. Medians were used because the distribution of word durations is not symmetric. They included also the length of the utterance and the distance to the end of the utterance because it has been shown that both of these factors can affect rate of speech ((Jiahong Yuan, 1980; Quené, 2008; Jacewicz et al., 2009)). We find that the mean is 246 ms for both and the median 205 ms for actual, 208 ms for the expected.
3.2.
Statistical Models
The model used for their analysis was a linear mixed regres-sion model with the use of standardized speech rate as the predicted value. As specified the lme4 library in R (Bates et al., 2014) was used to fit the models and provide t-values. The lmerTest package (Kuznetsova et al., 2014), which encapsulates lme4, was used to estimate degrees of free-dom (Satterthwaite approximation) and calculate p-values. All numerical predictors were standardized. All models used the interlocutor, conversation, and topic identity as random intercepts. Study 1 also used the speaker as a ran-dom intercept. Binary predictors (speaker and interlocutor sex), were converted (“FEMALE") to 0 and (“MALE") to 1. Following the replication we used Rs p.adjust func-tion to adjust p values for multiple comparisons using the FDR (false discovery rate) method.
3.3.
Study 1: Sex and Age Effects on Speech
Rate
This part of the work seeks to validate previous studies es-tablishing that age and sex affect speech rate. In particular, younger speakers have been found to have faster rates than older speakers (Duchin and Mysak, 1987; Harnsberger et al., 2008; Horton et al., 2010), and male speakers slightly faster rates than female speakers (Jacewicz et al., 2009; Ji-ahong Yuan, 1980; Kendall, 2009). Sex, age, and their in-teraction were used as fixed effects. The models described used a random intercept for conversation.
Results As Priva et al., we find that older speakers are more likely to have a slower rate of speech (β = 0.2151, standard error (SE) = 0.0532, p < 10−5 , FDR-adjusted p
Estimate Standard Error FDR-adjusted p Variable us Priva et al. us Priva et al. us Priva et al.
Age 0.2151 0.2239 0.0532 0.0541 1.2· 10−13 6.3· 10−5
Speaker Sex −0.4089 −0.3912 0.0744 0.0760 2.5· 10−7 1.1· 10−6
Age· Sex −0.0716 −0.0795 0.0748 0.0762 0.338 0.297
Table 1: Comparison of the results between our replication and the original study 1 from Cohen et al.
Estimate Standard Error FDR-adjusted p Variable us Priva et al. us Priva et al. us Priva et al.
Speaker Baseline (SB) 0.7777 0.7940 0.0929 0.0090 2· 10−16 2· 10−16
Interlocutor′s Baseline (IB) 0.0464 0.0540 0.0094 0.0190 7· 10−6 0.034
Interlocutor′s Age (IA) 0.0231 0.0249 0.0089 0.0100 0.038 0.043
interlocutor′s sex (IS) −0.0181 0.0099 0.0927 0.0230 0.134 0.844
IB· speaker Age 0.0048 0.0025 0.0089 0.0090 0.720 0.844 IB· IA −0.0004 −0.0079 0.0082 0.0090 0.960 0.630 IA· speaker Age −0.2094 −0.0230 0.0092 0.0100 0.111 0.053 IB· speaker Sex −0.0075 0.0084 0.0092 0.0250 0.553 0.844 IB· SB −0.0173 −0.0176 0.0095 0.0100 0.183 0.162 IB· IS −0.0144 −0.0009 0.0093 0.0270 0.246 0.974 IS· Speaker Sex 0.0022 −0.0676 0.0101 0.0270 0.945 0.430 IB· Speaker Age · IA 0.0064 0.0040 0.0078 0.0070 0.550 0.844 IA· Speaker Sex · IS −0.0130 −0.0561 0.0091 0.0340 0.261 0.193
Table 2: Comparison of the results between our replication and the original study 2 from Priva et al
< 10−6). Male speakers are overall more likely to have a faster rate of speech (β = -0.4089, SE = 0.0744, p < 10−7 , FDRadjusted p < 10−6). Age did not affect male and fe-male speakers differently (β = -0.0716, SE = 0.0748, unad-justed p = 0.3389 , FDR-adunad-justed p > 0.05). These results summarized are shown in Table 1 and compared with the results of the work of Priva et al. As shown our work repli-cates the trend of the estimates of Priva et al., and the fact that both age and sex of speaker affect his speech rate.
3.4.
Study 2: Converging to baseline
The second part of the original study attempted to deter-mine to what extent speakers converge with their interlocu-tors baseline rate and to verify the influence of other fea-tures like sex and age on the convergence. The method is the same as explained in section 3.3.; moreover, were added several predictors. First two predictors for speech rate like the speakers baseline speech rate, estimated from their conversation with other interlocutors (SI), and the
in-terlocutors baseline speech rate, estimated from their con-versations with others (IS).
Other predictors are included, as described by Priva et al., to take into account that the identity of the speaker, both speaker and interlocutor properties like sex and age could affect the speech rate. The other predictors are:
• The age (standardized) of the interlocutor, as well
as its interaction with the (standardized) age of the speaker: Interlocutor age; Interlocutor age·
speakerage
• The sex of the interlocutor, and its interaction
with the sex of the speaker: Interlocutor sex; Interlocutor sex· speaker sex
• Interactions between the interlocutors baseline speech
rate and all other variables:
– Interlocutor Baseline· Speaker Baseline; – Interlocutor Baseline· Speaker Age; – Interlocutor Baseline· Interlocutor Age; – Interlocutor Baseline · Interlocutor Age ·
speaker Age;
– Interlocutor Baseline· Speaker Sex; – Interlocutor Baseline· Interlocutor Sex; – Interlocutor Baseline · Interlocutor Sex ·
Speaker Sex.
Results As shown in table 2, our replication is in agree-ment with the results of Priva et al. Speakers baseline speech rate has the most significant effect on their own speech rate in a conversation (β = 0.7777, standard error (SE) = 0.0929, p < 10−16 , FDR-adjusted p < 2· 10−16). The interlocutors baseline rate has a smaller yet signif-icant effect on speakers speech rate (β = 0.0464, stan-dard error (SE) = 0.0094 , p < 8· 10−8, FDR-adjusted p < 0.05 ). The positive coefficient indicates convergence, when speaking with an interlocutor who speak slowly or quickly, the speakers speech rate changes in the same di-rection. Difference between the effect of speakers base-line rate and interlocutors basebase-line rate on speaker speech rate, suggests that speakers are more consistent than they are convergent, and rely much more on their own baseline.
Speaker Baseline Interlocutor’s Baseline Interlocutor’s Age conv. per speaker Estimate SD adj.p Estimate SD adj.p Estimate SD adj.p
2 0.7777 0.0093 2· 10−16 0.0464 0.0094 7· 10−6 0.0231 0.0089 0.038
3 0.7824 0.0094 2· 10−16 0.0588 0.0192 0.018 0.0217 0.0089 0.084
4 0.7824 0.0096 2· 10−16 0.0589 0.0194 0.019 0.0205 0.0092 0.138
5 0.7802 0.0098 2· 10−16 0.0589 0.0197 0.023 0.0206 0.0093 0.144
6 0.7800 0.0102 2· 10−16 0.0652 0.0200 0.009 0.0220 0.0096 0.106
Table 3: Estimate, Standard deviation and adjusted p-value for the Speaker Baseline, Interlocutor’s baseline and Interlocu-tor’s age for different subsets of the Switchboard corpus. The subsets contain at least 2, 3, 4 ,5 and 6 conversations per speakers respectively.
Interlocutor age has a significant effect on speaker speech rate too (β = 0.0231, SE = 0.0089, p < 0.05, FDR-adjusted p < 0.05). The positive coefficient of this variable indi-cates that speakers are categorically slower while speaking with older speakers, regardless of the interlocutors baseline speech rate.
However, contrarily to the results of Priva et al. we don’t find significance to assess that the combination of speakers and interlocutors sex affects speech rate.
4.
Strenghting The Analysis
In this part we will show further analysis performed on the Switchboard corpus to test the model proposed by (Co-hen Priva et al., 2017). More precisely, we extend the study in three directions: (i) using a subset of the corpus in or-der to include just speakers with more conversations; (ii) applying a different model to compute the word expected duration, and (iii) finally testing the model on different data subsets following a k-fold approach.
4.1.
Taking a More Conservative Stance on
Baseline Estimate
As said before, external factors could affect speech rate, like the topic of the conversation. Indeed, a speaker could vary his speech rate depending on how he is immersed into the discussion or according to the importance he gives to the topic. This may have an effect on the computation of the baseline leading to an overestimating or underestimat-ing of the speech rate baseline. To smooth this effect we apply the same model to subsets of the Switchboard cor-pus considering just speakers who have at least 2, 3, 4, 5, 6 conversations, in order to have a greater number of con-versations per speakers to compute SI and IS even if this
implies to consider into the analysis a smaller number of total speakers; in this way we obtain 5 different datasets with respectively 479, 442, 406, 385, 357 different speakers and 4788, 4630, 4418, 4264 and 4018 ‘conversations sides’. The choice of using these datasets is also due to other fac-tors, such as the internal state of the speaker. For example, emotion could affect the way to talk of a speaker and sub-sequently his speech rate. In previous studies, (Ververidis and Kotropoulos, 2006) compared the effect of the emotion to recognize them by the analysis of speaking using sev-erals database, while (Siegman and Boyle, 1993) outlined people who feel sadness can speak slow and soft. Using a greater numbers of conversations per speakers it could be
possible to smooth this effects in the computation of the baseline. For study 2, We consider just predictors which were significant in the previous study and that still remain the only significant variables. Table 4 shows the magnitude of the estimates (for study 1) for each subsets. The magni-tude of the effect of sex on speech rate increases with the number of conversations, while the effect of age decreases. Moreover, both variables preserve significance with an ad-justed p-value that in the worst case (corresponding to the dataset with 6 conversations per speaker) is p = 0.009 for speaker age and p ∼ 10−8 for speaker sex. So, the trend of the estimates, still significant, suggests that considering a less quantity of data, lead to indicate the robustness of the model.
With regard to study 2 we consider just significant predic-tors. The results in table 3 shows that also in this case the magnitude of the speakers baseline, interlocutors baseline and of interlocutors age increase, but we note that the age loses significance as the number of minimum conversations increases. The speech rate so results to be affected mainly by the speaker baseline and by the interlocutor’s baseline. Moreover, the fact that the interlocutor age doesn’t seem to affect the convergence of speech rate, which implies the results can’t be reproduced if we reduce the size of the dataset, recall the issue outlined by (Benjamin et al., 2017); in their work they suggest the possibility to reduce (for same fields of the scientific research) the threshold of the p-value, in order to help the reproducibility task of the results in the scientific community.
4.2.
Variation on Expected Duration
Computation
Recalling the definition of speech rate at a level of an utter-ance as the ratio between utterutter-ance duration and utterutter-ance expected duration, it’s clear that the speech rate is influ-enced by the way of computing the expected duration of each individually word. Assuming that the duration of a word depends on the length of the utterance, the distance to the end and to the median duration of that word in the entire corpus, we fitted the expected duration using an arti-ficial neural network regression with a one-hidden layer of 10 neurons and an adaptive learning method. The model is integrated by the use of the Scikit-Learn package in Python (Pedregosa et al., 2011). In this case we obtained that me-dian of the expected word duration is ∼ 205 ms, as the median of the word duration in the corpus. Applying the same procedure of the previous paragraph, we obtained the
Speaker Sex Speaker Age Sex·Age
conv. per speaker Estimate SD adj.p Estimate SD adj.p Estimate SD adj.p
2 −0.4090 0.0745 2.6· 10−7 0.2151 0.0532 1.22· 10−4 −0.0716 0.0748 0.338
3 −0.4655 0.0765 1.04 · 10−8 0.2083 0.0544 2.00· 10−4 −0.0269 0.0770 0.726
4 −0.4861 0.0787 6.42 · 10−9 0.2055 0.0564 4.03· 10−4 −0.0593 0.0794 0.455
5 −0.4749 0.0807 3.49 · 10−8 0.1854 0.0585 2.21· 10−3 −0.0559 0.0822 0.496
6 −0.4747 0.0830 9.26 · 10−8 0.1634 0.0602 9.25· 10−3 −0.0032 0.0847 0.968
Table 4: Estimate, Standard deviation and adjusted p-value for the Sex, age and sex· age for different subsets of the Switchboard corpus. The subsets contain at least 2, 3, 4 ,5 and 6 conversations per speakers respectively.
Speaker Baseline Interlocutor’s Baseline Interlocutor’s Age conv. per speaker Estimate SD adj.p Estimate SD adj.p Estimate SD adj.p
2 0.7801 0.0093 2· 10−16 0.0548 0.0192 0.035 0.0232 0.0088 0.048
3 0.7868 0.0094 2· 10−16 0.0584 0.0192 0.019 0.0219 0.0089 0.078
4 0.7847 0.0096 2· 10−16 0.0581 0.0194 0.022 0.0206 0.0091 0.137
5 0.7822 0.0097 2· 10−16 0.0583 0.0190 0.024 0.0210 0.0093 0.140
6 0.7970 0.0100 2· 10−16 0.0650 0.0240 0.009 0.0217 0.0095 0.093
Table 5: The table reports the results obtained using the method described in Section 4.2. to compute the expected word duration. Estimate, Standard deviation and adjusted p-value for the Speaker Baseline, Interlocutor’s baseline and Interlocu-tor’s age for different subsets with at least 2, 3, 4 ,5 and 6 conversations.
estimate SD adj-p
Variable k-fold previous k-fold previous k-fold previous Speaker Baseline 0.764± 0.011 0.778 0.011± 0.002 0.009 2· 10−16 2· 10−16
Interlocutor Baseline 0.055± 0.007 0.046 0.001± 0.010 0.009 0.110± 0.071 7· 10−6 Interlocutor’s Age 0.016± 0.008 0.023 0.011± 0.001 0.009 0.130± 0.029 0.038 Table 6: Estimate, Standard deviation and adjusted p-value for the Speaker Baseline, Interlocutor’s baseline and Interlocu-tor’s age averaged on the 5 different subsets and compared with the value computed in Section 3.4.
.
results in table 5. The trend of the estimates and SD re-sults similar to what founded in Section 4.1., reinforcing the hypothesis that both speaker baseline and interlocutor baseline affect the speech rate.
4.3.
Validation of the Model
To validate the model described in the previous section, we apply a cross validation k-fold approach to determine if the results are still significant on a smaller independent dataset. We use k = 5, obtaining each subsets from the main cor-pus; differently from the section 4.1., we filter the data in order to create dataset with a size of conversations num-ber corresponding to the 80% of the total length of the corpus, used in section 3.. In this context, each of data set contained 3830 ’conversations sides’ with the condition that each speaker has at least 2 conversations. We com-pare the results of study 2 3.4. with the results averaged on the subsets as expressed in Table 6. We found that even if Interlocutor’s baseline and Interlocutor’s Age (estimate and Standard deviation values) are consistent with the value of Section 3., they are not still significant. Vice-versa, the estimate for the Speaker Baseline emerges to be slightly lower compared to the previous result, but it still have
sig-nificance. The non significance values cannot be attributed to the decrease of speakers in the datasets. Indeed, the min-imum number of speakers result to be 452, that is about the 95% of the total number used in Section 3.. These differ-ence of results could be attributed to the use of less con-versations sides per speaker in the k-fold subsets (after the filtering processing), that reinforce the hypothesis to con-sider more than 2 conversations per speaker. These results suggest the fact that speech rate is mainly affected by the Speaker baseline also when both the size of the conversa-tions and the number of speakers decrease.
4.4.
Speech rate as dynamic variable
The replication study performed in this work, including the further analysis about the robustness of the model, used speech rate averaged on all the utterances per each conver-sation. Even if this approach captures general properties and behavior of the speakers and their interlocutors while conversing, it can’t account for the dynamic of speech rate and how it evolves during time. In order to get a closer view to what speech rate variation looks like in conversation we realized a series of speech rate plots in actual conversation as shown in figure 1.
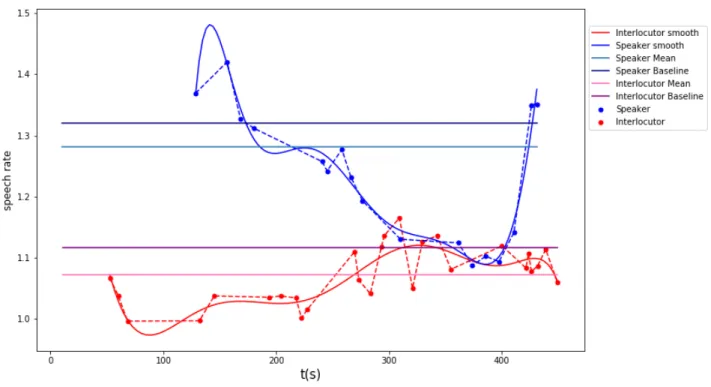
Figure 1: Blue shade (upper part) and red shade (bottom part) indicate respectively the speaker and interlocutor variables.
First of all, we should highlight that what does the repli-cated study (study 2) is to compare the base lines and the averages speech rates (all the straight lines). To show the variability and the complexity of the speech rate in a con-versation we plot the speech rate for each utterance for both speaker and interlocutor. As first step we smooth the data using a moving average with a window n = 6. Then we ap-ply a polynomial fit p(x) of order k = 8 to the filtered data to obtain the trend of the speech rate as a smoothed func-tion. As we can see, the difference between average speech rate of speaker and interlocutor (respectively in light blue and pink) is∼ 0.4. These averaged values are in according with the punctual speech rate (blue for speaker and red for interlocutor) at a level of the utterances for the first part of the conversation (up to 300 s) showing a huge difference between the conversants, but they hide that in the temporal interval 300−400s the difference is < 0.05. In the last part of the conversation speaker and interlocutor have a simi-lar trend in speech rate and a model that uses the average speech rate can’t take the temporal dynamic into account. Moreover, the average speech rate is sensitive to outliers. This issue could affect the analysis of the speech rate dur-ing conversation leaddur-ing to an erroneous description of the conversants behavior. The importance to analyze the trend of speech rate that evolves during the conversation, points out the possibility of analyze speech rate with the use of new approaches that could study the dynamic of the con-versation.
5.
Conclusion
Our replication of (Cohen Priva et al., 2017) confirms that both speaker baseline and interlocutor baseline have effects on the speech rate, supporting the theory that speakers tend
to convergence in speech rate as assesed in the work of (Co-hen Priva et al., 2017). Although we test the robustness of their model, showing that only speaker baseline preserve significance in the test we performed.
More general, despite their key importance, replication studies in Language Sciences of the kind presented here have been too rare. However it is a crucial ingredient for making scientific results more reliable and more credible outside the community. It is important that this approach could be moved in other scientific fields to develop within Language Sciences. Moreover replicated studies are the best ground for extending previous work. We hope that the benefits exhibited in the paper can convince more NLP researchers to initiate replications and present them in ded-icated papers.
Finally, the visual exploration of speech rate we presented allowed us to grasp the distance between the study we fo-cused on, our replication and the actual complexity of the phenomena. It does not reduce the interest of the origi-nal study but reveals how we still need to understand about conversational dynamics.
6.
Acknowledgements
This project has received funding from the European Union’s Horizon 2020 research and innovation pro-gramme under the Marie Skodowska-Curie grant agree-ment No713750. Also, it has been carried out with the financial support of the Regional Council of Provence-Alpes-Côte dAzur and with the financial support of the A*MIDEX (n ANR- 11-IDEX-0001-02), funded by the Investissements d’Avenir project funded by the French Government, managed by the French National Research
Agency (ANR). Research also supported by grants ANR-16-CONV-0002 (ILCB), ANR-11-LABX-0036 (BLRI).
7.
Bibliographical References
Babel, M. (2012). Evidence for phonetic and social se-lectivity in spontaneous phonetic imitation. Journal of
Phonetics, 40(1):177 – 189.
Bates, D., Maechler, M., Bolker, B., Walker, S., et al. (2014). lme4: Linear mixed-effects models using eigen and s4. R package version, 1(7):1–23.
Benjamin, D. J., Berger, J. O., Johannesson, M., Nosek, B. A., Wagenmakers, E.-J., Berk, R., Bollen, K. A., Brembs, B., Brown, L., Camerer, C., et al. (2017). Re-define statistical significance. Nature Human Behaviour, page 1.
Buller, D. B. and Aune, R. K. (1992). The effects of speech rate similarity on compliance: Application of communi-cation accommodation theory. Western Journal of
Com-munication, 56(1):37–53.
Cohen Priva, U., Edelist, L., and Gleason, E. (2017). Con-verging to the baseline: Corpus evidence for convergence in speech rate to interlocutor’s baseline. The Journal of
the Acoustical Society of America, 141(5):2989–2996.
Duchin, S. W. and Mysak, E. D. (1987). Disfluency and rate characteristics of young adult, middle-aged, and older males. Journal of communication disorders, 20(3):245–257.
Gallois, C. and Callan, V. J. (1988). Communication ac-commodation and the prototypical speaker: Predicting evaluations of status and solidarity. Language and
Com-munication, 8(3):271 – 283. Special Issue
Communica-tive Accomodation: Recent Developments.
Giles, H. and Coupland, N. (1991). Language: Contexts
and consequences. Thomson Brooks/Cole Publishing
Co.
Godfrey, J. J., Holliman, E. C., and McDaniel, J. (1992). Switchboard: Telephone speech corpus for research and development. In Acoustics, Speech, and Signal
Process-ing, 1992. ICASSP-92., 1992 IEEE International Con-ference on, volume 1, pages 517–520. IEEE.
Goldinger, S. D. (1989). Echoes of echoes? an episodic theory of lexical access. Psychological Review, 105(2):251–279.
Hannah, A. and Murachver, T. (1999). Gender and con-versational style as predictors of concon-versational behavior.
Journal of Language and Social Psychology, 18(2):153–
174.
Harnsberger, J. D., Shrivastav, R., Brown, W., Rothman, H., and Hollien, H. (2008). Speaking rate and fundamental frequency as speech cues to perceived age. Journal of
voice, 22(1):58–69.
Horton, W. S., Spieler, D. H., and Shriberg, E. (2010). A corpus analysis of patterns of age-related change in con-versational speech. Psychology and aging, 25(3):708. Jacewicz, E., Fox, R. A., O’Neill, C., and Salmons, J.
(2009). Articulation rate across dialect, age, and gender.
Language Variation and Change, 21(2):233256.
Jiahong Yuan, Mark Liberman, C. C. (1980). Towards an integrated understanding of speaking rate in
conversa-tion. Proceedings of Interspeech, Pittspurgh, pages 541– 544.
Kendall, T. (2009). Speech rate, pause, and linguistic variation: An examination through the sociolinguistic archive and analysis project. Phd Thesis, Duke
Univer-sity.
Kuznetsova, A., Bruun Brockhoff, P., and Haubo Boje-sen ChristenBoje-sen, R. (2014). lmertest: tests for random and fixed effects for linear mixed effects models. See
https://CRAN. R-project. org/package= lmerTest.
Levitan, R. and Hirschberg, J. (2011). Measuring acoustic-prosodic entrainment with respect to multiple levels and dimensions.
Manson, J. H., Bryant, G. A., Gervais, M. M., and Kline, M. A. (2013). Convergence of speech rate in conversa-tion predicts cooperaconversa-tion. Evoluconversa-tion and Human
Behav-ior, 34(6):419 – 426.
Namy, L. L., Nygaard, L. C., and Sauerteig, D. (2002). Gender differences in vocal accommodation:: The role of perception. Journal of Language and Social
Psychol-ogy, 21(4):422–432.
Pardo, J. (2006). On phonetic convergence during conver-sational interaction. The Journal of the Acoustical
Soci-ety of America, 119(2382).
Pedregosa, F., Varoquaux, G., Gramfort, A., Michel, V., Thirion, B., Grisel, O., Blondel, M., Prettenhofer, P., Weiss, R., Dubourg, V., et al. (2011). Scikit-learn: Ma-chine learning in python. Journal of MaMa-chine Learning
Research, 12(Oct):2825–2830.
Pickering, M. J. and Garrod, S. (2004). Toward a mecha-nistic psychology of dialogue. Behavioral and brain
sci-ences, 27(2):169–190.
Quené, H. (2008). Multilevel modeling of between-speaker and within-between-speaker variation in spontaneous speech tempo. The Journal of the Acoustical Society of
America, 1104(123).
R.Bilous, F. and M.Krauss, R. (1988). Dominance and ac-commodation in the conversational behaviours of same-and mixed-gender dyads. Language same-and
Communica-tion, 8(3):183–194.
Sanker, C. (2015). Comparison of phonetic convergence in multiple measures. in Cornell Working Papers in
Pho-netics and Phonology, page 6075.
Siegman, A. W. and Boyle, S. (1993). Voices of fear and anxiety and sadness and depression: the effects of speech rate and loudness on fear and anxiety and sadness and de-pression. Journal of Abnormal Psychology, 102(3):430. Smith, B. L., Brown, B. L., Strong, W. J., and Rencher,
A. C. (1975). Effects of speech rate on personality per-ception. Language and Speech, 18(2):145–152.
Smith, B. L., Brown, B. L., Strong, W. J., and Rencher, A. C. (1980). Effects of speech rate on personality attri-butions and competency evaluations.
Street, R. L. (1984). Speech convergence and speech eval-uation in fact-finding iinterviews. Human
Communica-tion Research, 11(2):139–169.
Ververidis, D. and Kotropoulos, C. (2006). Emotional speech recognition: Resources, features, and methods.
Willemyns, M., Gallois, C., Callan, V. J., and Pittam, J. (1997). Accent accommodation in the job interview: Im-pact of interviewer accent and gender. Journal of
Lan-guage and Social Psychology, 16(1):3–22.
Yngve, V. H. (1970). On getting a word in edgewise. In
Chicago Linguistics Society, 6th Meeting, pages 567–
578.
8.
Language Resource References
John J. Godfrey and Edward Holliman. (1997).
Switchboard-1 Telephone Speech Corpus. distributed
via LDC, Switchboard, 2.0, ISLRN 988-076-156-109-5. Godfrey, J. J., Holliman, E. C., and McDaniel, J. (1992). Switchboard: Telephone speech corpus for research and development. In Acoustics, Speech, and Signal
Process-ing, 1992. ICASSP-92., 1992 IEEE International Con-ference on, volume 1, pages 517–520. IEEE.