HAL Id: hal-00718085
https://hal.archives-ouvertes.fr/hal-00718085
Submitted on 16 Jul 2012
HAL is a multi-disciplinary open access
archive for the deposit and dissemination of
sci-entific research documents, whether they are
pub-lished or not. The documents may come from
teaching and research institutions in France or
abroad, or from public or private research centers.
L’archive ouverte pluridisciplinaire HAL, est
destinée au dépôt et à la diffusion de documents
scientifiques de niveau recherche, publiés ou non,
émanant des établissements d’enseignement et de
recherche français ou étrangers, des laboratoires
publics ou privés.
Friendship prediction and homophily in social media
Luca Maria Aiello, Alain Barrat, Rossano Schifanella, C. Cattuto, Benjamin
Markines, Filippo Menczer
To cite this version:
Luca Maria Aiello, Alain Barrat, Rossano Schifanella, C. Cattuto, Benjamin Markines, et al..
Friend-ship prediction and homophily in social media. ACM Transactions on the Web, http://tweb.acm.org/,
2012, 6 (2), pp.9. �10.1145/2180861.2180866�. �hal-00718085�
media
LUCA MARIA AIELLO
Department of Computer Science, University of Turin, Italy ALAIN BARRAT
Centre de Physique Th´eorique (CNRS UMR 6207), Marseille, France Complex Networks and Systems Laboratory, ISI Foundation, Turin, Italy ROSSANO SCHIFANELLA
Department of Computer Science, University of Turin, Italy CIRO CATTUTO
Complex Networks and Systems Laboratory, ISI Foundation, Turin, Italy BENJAMIN MARKINES
FILIPPO MENCZER
School of Informatics and Computing, Indiana University, Bloomington, IN, USA
Web 2.0 applications have attracted considerable attention because their open-ended nature allows users to create lightweight semantic scaffolding to organize and share content. To date, the interplay of the social and topical components of social media has been only partially explored. Here we study the presence of homophily in three systems that combine tagging of social media with online social networks. We find a substantial level of topical similarity among users who lie close to each other in the social network. We introduce a null model that preserves user activity while removing local correlations, allowing us to disentangle the actual local similarity between users from statistical effects due to the assortative mixing of user activity and centrality in the social network. This analysis suggests that users with similar interests are more likely to be friends, and therefore topical similarity measures among users based solely on their annotation metadata should be predictive of social links. We test this hypothesis on several datasets, confirming that social networks constructed from topical similarity capture actual friendship accurately.
Categories and Subject Descriptors: H.1.2 [Information Systems]: Models and
Principles—Hu-man information processing; H.3.5 [Information Storage and Retrieval]: Online Information
Services—Web-based services; H.5.3 [Information Interfaces and Presentation]: Group and Organization Interfaces—Collaborative computing, Web-based interaction
General Terms: Algorithms, Experimentation, Measurement
Additional Key Words and Phrases: Web 2.0, social media, folksonomies, collaborative tagging, social network, link prediction, topical similarity, Maximum Information Path
Contact author: Luca Maria Aiello, aiello@di.unito.it.
The present paper is an extended version of a previously published conference paper [Schifanella et al. 2010].
Permission to make digital/hard copy of all or part of this material without fee for personal or classroom use provided that the copies are not made or distributed for profit or commercial advantage, the ACM copyright/server notice, the title of the publication, and its date appear, and notice is given that copying is by permission of the ACM, Inc. To copy otherwise, to republish, to post on servers, or to redistribute to lists requires prior specific permission and/or a fee.
c
1. INTRODUCTION
Online social networking systems, together with online systems for content orga-nization and sharing, entangle cognitive, behavioral, and social aspects of a user community through an underlying technological platform. The resulting “ecosys-tems” provide new possibilities to mine and investigate the various processes at play in the interactions of individuals, and to study the ways in which users relate with the information they share.
Key open questions deal with understanding the concepts of similarity and in-fluence, tracking the emergence of shared semantics, and determining the interplay between social proximity and shared topical interests among users. The emergence, spreading, and stability of any shared concept depend critically on the above fac-tors. As observed by danah boyd [2009],
“In a networked world, people connect to people like themselves. What flows across the network flows through edges of similarity. The ability to connect to others like us allows us to flow information across space and time in impressively new ways, but there’s also a downside. [...] In a world of networked media, it’s easy to not get access to views from people who think from a different perspective. Information can and does flow in ways that create and reinforce social divides. Democratic philosophy depends on shared informational structures, but the combination of self-segmentation and networked information flow means that we lose the common rhetorical ground through which we can converse.”
We see a pressing need for a data-driven investigation of these issues. Social media supporting tagging are especially interesting in this respect because they stimulate users to provide light-weight semantic annotations in the form of freely chosen terms [Golder and Huberman 2006]. Social annotations based on tags are valuable for research because they externalize the three-way relation between users, items of interest (resources), and metadata (tags). Usage patterns of tags can be employed to monitor interests, track user attention, and investigate the emergence and spread of shared concepts through a user community. Moreover, several “Web 2.0” resource organization systems support explicit representations of social links between users, making an objective definition of social proximity available. They also combine several aspects of user activity, such as exposing resources, tagging items, belonging to discussion groups, and relating to other users.
In this paper, we consider three different online social systems: Flickr, Last.fm, and aNobii. In these systems, users expose resources (pictures, songs/artists, and books, respectively), form social networks and tag items producing social clas-sification of data commonly called folksonomies.
The three systems strongly differ by size, category of exposed resources, and the precise ways in which users tag resources and relate to each other. Taking advantage of the datasets built from the three systems, we address the following issue: How does the similarity between user profiles relate to their proximity on the social network? More precisely, are neighboring users more similar, both in the amount of activity they devote to the system, and in the content of their activity, than users who lie further apart in the social network? If so, how does this local
similarity fade when the distance on the social graph increases? And can we predict the existence of social links from knowledge of the similarity among user profiles?
In the remainder of this paper, after a brief description of related work in Section 2 and of our datasets in Section 3, we provide in Section 4 a thorough analysis along several axes. This data analysis highlights the heterogeneity of user activities and the correlations in the various metrics measuring the different activities of a single user. We also show the existence of non-trivial mixing patterns: the amount of different activities of a user is correlated with her neighbours’. Section 4 exposes the substantial level of several types of topical similarity that exist among users who are close to each other in the social network. In Section 5, we evaluate the performance of predictors of online social links based on the similarity of user profiles. We consider a number of topical similarity measures from the literature. Scalable similarity measures, such as Maximum Information Path, proposed by some of the authors, are among those achieving the best predictive performance. The role of language communities in these predictions is investigated in Section 6.
2. RELATED WORK
In prior work we explored the correlation between proximity in an online social network and topical similarity and we analyzed the extent to which similarity among users based only on tagging information can be an accurate predictor of social ties [Schifanella et al. 2010]. We analyzed samples from the Flickr and Last.fm social networks. The present paper expands on our prior work both in breadth and in depth. First, we extend our analysis to the aNobii network, which is very different in both its size and the types of items exposed. Second, we widen the social features analysis by including the predictive potential of groups and user libraries (i.e., collections of items like artists or books). Third, we compare the predictive power of topical similarity measures with more sophisticated baselines from the industry. Lastly, we investigate the influence that confounding aspects like user language can have on the link prediction performance.
Similarity between the members of social groups, or between individu-als sharing a social link, is known as homophily in the social networks lit-erature, and has long been observed and studied [McPherson et al. 2001]. Homophily phenomena can be present because of selection mechanisms (individuals create social links preferentially with other individuals shar-ing a certain degree of similarity), but also because of social influence (linked individuals influence each other and become more similar), two effects that are often confounded and actually difficult to disentangle [Leenders 1997; Aral et al. 2009; Shalizi and Thomas 2010]. Interest-ingly, the everincreasing availability of data sets concerning online so-cial networks have made such networks ideal laboratories for testing and quantifying such social phenomena and theories (see e.g. [Crandall et al. 2008; Aiello et al. 2010; Szell et al. 2010; ?]).
We find indeed in the literature several studies on the evolution of online so-cial systems and correlations between different user features. Leskovec and Hor-witz [2008] present a study on the Microsoft Messenger network, showing correlation between user profile information and communication patterns. Evolutionary
pat-terns in the Flickr social network have been studied by Kumar et al. [2006] and Mislove et al. [2007; 2008]. Marlow et al. [2006] perform a quantitative study on the tag usage in Flickr. They discuss the heterogeneity of tagging patterns and perform a preliminary analysis of vocabulary overlap between pairs of users. Their analysis shows that neighbors in the social graph have a higher vocabulary overlap, on average. However, no assessment is made of biases that could be responsible for the reported observation: here we explore such biases. The role of groups as coordination tools in Flickr is investigated by Prieur et al. [2008]. They also point out a strict relation between the density of the social network and the density of the network of tag co-usage among the group members. Leskovec et al. [2008] perform a comparative study on the microscopic evolutionary dynamics between several social networks, in which a special emphasis is placed on the arrival process of new nodes and on the dynamics of attachment. Influence of social contacts on browsing patterns in Flickr has been analyzed by Lerman and Jones [2007] and van Zwol [2007], who provide insights into the activity patterns of users. Correlation between topical overlap among user interests in tagging systems and other indi-cators of social behavior is explored by Santos-Neto et al. [2009]. They consider CiteULike and Connotea systems, which both lack an explicit social network com-ponent, so they look at collaboration relations determined by the participation in the same discussion group.
Predicting the presence of a link between two entities in a network is one of the major challenges in link mining [Getoor and Diehl 2005]. A common approach to the link prediction problem is to infer ties from the structural properties of the social network. Liben-Nowell and Kleinberg [2003] discuss several notions of node similarity based on social graph structural features for link prediction. Prediction of future links in a question-answering bulletin board service is performed by Mu-rata and Moriyasu [2007]. Here, network proximity scores calculated from local topological information are assigned to pairs of nodes, as the proximity values are shown to be accurate predictors of future links. Huan [2006] defines a cycle forma-tion model for social graphs that relates the probability of the presence of a link with its ability to form cycles. The parameters of the model are estimated using the generalized clustering coefficients of the network. The power of the model is evaluated on the Enron email dataset. Another probabilistic network evolution model aimed at link prediction is proposed by Kashima and Abe [2006]. The idea is that links appear in the network due to a copying process where status labels associated to edges are copied from one node to another with a probability that is dependent on the relative topological position of the two nodes. Clauset et al. [2008] present a hierarchical decomposition algorithm for network clustering which can also be applied to predict missing interactions in networks. The generated graph-dendrograms determine the probability of connection for every pair of vertices. Links are predicted between pairs that have high probability of connection within the hierarchical random graphs but that are unconnected in the observed network. This technique is tested with good results on several small-size networks.
Another line of works focuses on link detection through supervised learning methods trained on the topological features of graph [Popescul
et al. 2003; Hasan et al. 2006]. Prediction of the sign of an existing link in friends-foes social networks (e.g. Slashdot Zoo) using a machine learning approach is presented by Leskovec et al. [?]. They use a logistic regression classifier trained with two classes of topological features: node degree and triadic closure.
Link prediction can also be based on features that describe user profiles, based on the principle that people with similar tastes are more likely to establish social contacts. Caragea et al. [2009] study the interplay between social network struc-ture and user profile feastruc-tures in the prediction of social ties. The paper proposes an ontology-based classification of user features and shows that the semantics cap-tured by the ontology can effectively improve the performance of a topology-based machine learning classifier for link prediction. Li et al. [2008] propose a system to cluster users with similar topical interests. Starting from a Delicious dataset, the system extracts implicit relations between groups of users based on the similarity of their tag vocabulary. Although the authors do not refine the interest clusters in a set of binary social connections, the approach is related to the feature-based link prediction task. Leroy et. al. [Leroy et al. 2010] leverage the group mem-bership information from Flickr to build a probabilistic graph useful to detect the hidden social graph. Mislove et al. [2010] explore the complemen-tary question: can we predict topical similarity from the social network? Again, here we discuss the role of global correlation in biasing such prediction.
Even if the majority of papers is focused on link prediction on simple (directed or undirected) graphs, techniques have been developed also for different kind of networks like weighted networks [L¨u and Zhou 2009], bipartite networks [Dunlavy et al. 2010; Benchettara et al. 2010; Kunegis et al. 2010] and signed social graphs [?]. Finally, some approaches based on probabilistic models such as relational Markov networks [Taskar et al. 2003] and probabilistic relational models [Getoor et al. 2003] deserve to be cited. However, these approaches have not been extensively tested on real-world datasets.
A comprehensive survey on link prediction techniques has been re-cently drawn by L¨u and Zhou [2010]; authors compare several structural similarity metrics for link prediction in terms of accuracy and computa-tional efficiency.
In our previous work [Markines et al. 2008; Markines et al. 2009; Markines and Menczer 2009] we made a systematic analysis of a broad range of semantic similarity measures that can be applied to the three-dimensional folksonomy space to extract similarity networks of tags, resources, or users. Here, we use such measures to perform link prediction based on the folksonomy information.
3. DATASETS
In the following, we report on the main features of our datasets and we describe the data retrieval methods we used to build them. For each dataset, we collected at least the information about the social network, the tag assignments, and the group affiliations. A summary about the size of the quantities involved for each dataset is reported in Table I.
3.1 Flickr
We collected the tagging information about the pictures uploaded in Flickr between January 2004 and January 2006 by means of API methods (flickr.com/api). The crawling effort was distributed by splitting the above time interval into smaller time windows to be crawled independently. A global tag knowledge base, initialized with a minimal set, was shared between parallel crawlers. Crawlers issued search queries limited to their specific time interval to retrieve information about photos marked with the tags stored in the common database. New tags were added to the shared database as they were discovered by individual crawlers.
Separate crawls were made to explore group affiliations and the social network. In Flickr jargon, social ties are called contacts; they are directed and do not require acceptance by the linked user. The overall crawl was performed during the first half of 2007.
Our analysis will focus on the network of about 130 thousand users for whom we have tag, group, and contact information.
3.2 Last.fm
In Last.fm, each user is linked to friends through undirected links that are estab-lished given the consent of both endpoints. Users also have a public list of neighbors, computed by the system as recommendations for potential new friendship contacts. An affinity value, ranging from 0 to 1, is also assigned to each member of the neigh-bor set. Users can annotate songs, artists or albums with tags, and can create or join groups. Users also have a public library, i.e., a list of the artists they have listened to. User profile information includes an optional geographic specification at the country level.
We used both API calls (last.fm/api) and web crawling methods to build the dataset. The API can be used to retrieve user profiles, friendships and neighborhood relationships and a list of the 50 top artists in the user library (i.e., those with the highest playcount). The API does not allow for the collection of a user’s complete activity and group affiliation information, so we extracted the (user, item, tag) triples and the group membership relations via web crawling and scraping. The user set we consider was selected by a BFS crawl of the friendship network. The crawls took place in January 2010. We started from three randomly chosen users and for each of them we performed a crawl up to those nodes that resided 4 hops away. The corresponding snapshots include approximatively 100 thousand users each, with an overlap of about 20% between them. Since we found that the results of our analysis are consistent across the three samples, we report the findings for a single representative one.
Recently, the Last.fm API was extended with a similarity function, called tas-teometer, which, given in input a pair of users or artists, returns an affinity score ranging from 0 to 1. This value is different from the one provided by the neigh-borhood score and, most of all, it can be computed for any pair of users or artists. Jointly with the crawling activity, we retrieved the tasteometer values for a large set of user pairs to compare the performance of our tag-based similarity functions in the link prediction task with the performance of the tasteometer. Further details are given in Section 5.
Table I. Dataset statistics
Dataset Users Triples Tags Tagged items Groups Flickr 130, 840 90, 723, 412 1, 420, 656 20, 599, 583 92, 301 Last.fm 90, 049 6, 971, 166 194, 763 894, 615 69, 306 aNobii 86, 800 5, 378, 190 143, 182 918, 181 3, 581
3.3 aNobii
Users in aNobii (anobii.com) fill their digital book collections with titles selected from the public aNobii book database, which contains the metadata (such as pub-lication year, authors etc.) of about 20 millions different pubpub-lications, written in 49 different languages. Each personal book collection is partitioned into a library, which is a set of titles that the user is reading or has already read, and a wishlist that lists the books that the user wants to read in the near future. Books in the user collection can be annotated with arbitrary tags. Since books in libraries form the vast majority of the overall book collections, here we focus mainly on books from libraries.
Users can also provide public information about their profile, such as gender, age, marital status, and a detailed specification of their geographic location including country and hometown. Affiliation with thematic, user-generated groups is also possible.
Two different types of social ties can be established between users: friendship and neighborhood. The aNobii website suggests that people should be friends if they know each other in real life. Users should establish neighborhood ties with people who have a library they consider interesting. Surprisingly, although these two types of social links are formally different, they are equivalent from a structural point of view. In fact, both are directed and can be created without any consent of the linked user, who is not even notified when a new incoming tie is established. Furthermore, both links activate a monitoring on the linked user’s library that triggers notifications on library updates. Given this strong structural similarity, and since the two types of links are mutually exclusive, in the following we deal with the union between friendship and neighborhood networks and we generically refer to the union network as the aNobii social network.
We crawled the aNobii network in December 2009 starting from a random seed of users and following the social links in a forward BFS fashion. We explored the entire giant strongly connected component and the out component of the social network, for a total of 86, 800 users. We collected each user’s profile information, group affiliations, library, and tag assignments through web scraping.
4. DATA ANALYSIS
In most folksonomies, the activity of users has many facets. In Flickr, for instance, users can upload pictures and tag them, participate in groups, and comment on photos. In Last.fm, users can listen to music, tag songs according to the songs’ characteristics or the user’s tastes. In aNobii, users can add books to their libraries, tag them, join groups, and create a list of books they wish to read.
Since social networks are explicitly built by users, we can also consider the num-ber of friendship relations to be a measure of activity in each folksonomy we
con-10
2k
out10
410
-410
-210
0P(k
out)
10
010
2n
g10
-410
-210
0P(n
g)
10
010
210
4n
t10
-410
-210
0P(n
t)
10
010
210
4a
10
-410
-210
0P(a)
A)
B)
D)
C)
Fig. 1. Flickr complementary cumulative distributions of (A) the number koutof neighbors of a
user, (B) the number ng of groups of which a user is a member, (C) the number nt of distinct
tags per user, and (D) the number a of tag assignments per user.
sider. When links are directed, the out-degree can be considered a more significant measure of activity, while the in-degree measures popularity.
In this section, we first analyze the activity patterns of individual users, and show their considerable heterogeneity. We also investigate the correlations between various activity indicators.
4.1 Heterogeneity and Correlations
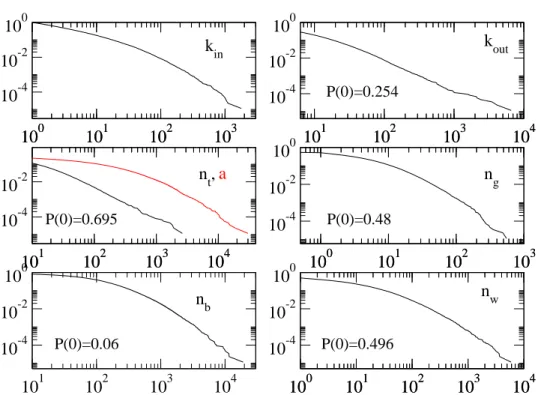
Let us first focus on the diversity between users. Figures 1 and 2 show the distri-butions of the number of neighbors in the social network and the probabilities of finding a user with a given number nt of distinct tags in her vocabulary, a total
tagging activity a, belonging to nggroups, and having (for aNobii) nband nwbooks
in her library and wishlist, respectively.
All these distributions are broad, spanning multiple orders of magnitude, showing that the activity patterns of users are highly heterogeneous. For each activity mea-sure, most users have little activity, but certain users are on the contrary extremely active, and all intermediate values are represented. No characteristic or “typical” value of the activity can be sensibly defined as evident from a standard deviation that is orders of magnitude larger than the average, for each activity measure.
Given this high level of disparity between users, a natural question arises about the correlations between the different types of activity: do users who have many
10
010
110
210
310
-410
-210
010
010
110
210
310
110
210
310
410
-410
-210
010
110
210
310
410
110
210
310
410
-410
-210
110
210
310
410
010
110
210
310
-410
-210
010
010
110
210
310
110
210
310
410
-410
-210
010
010
110
210
310
410
-410
-210
010
010
110
210
310
4k
ink
outn
t,
n
gn
bn
w P(0)=0.254 P(0)=0.48 P(0)=0.496 P(0)=0.06 P(0)=0.695a
Fig. 2. Complementary cumulative distributions of the measures of activity of aNobii users: in-degree kinand out-degree koutin the social network, number of distinct tags ntand total tagging
activity a (total number of tags in a user’s page), number of group memberships ng, number of
books in a user library nband in a user wishlist nw.
neighbors also use many tags, belong to many groups, and so on? The simplest way to examine this issue is to compute the average activity of a type for users having a certain value of another activity type. For instance, we can measure the average number of distinct tags for users having k neighbors in the social network:
hnt(k)i = 1 |u : ku= k| X u:ku=k nut, (1) where nu
t is the number of distinct tags of user u. As shown in Figure 3, all types of
activity have a clearly increasing trend for increasing values of the out-degree; users who have more contacts in the social network tend also to be more active in terms of tags and groups. Overall, the various activity metrics are all positively correlated with one another. For instance, in Flickr, the Pearson correlation coefficients are: 0.349 between k and nt, 0.482 between k and ng, 0.268 between k and a, 0.429
between ntand ng, 0.753 between ntand a, and 0.304 between ng and a.
Despite these correlations, large fluctuations are still present. First, the strong fluctuations at large degree values are due to the smaller number of highly-connected nodes over which the average is performed. Notably, users with a large number of social contacts but using very few tags and belonging to very few groups can be observed. We can investigate in more detail the degree of correlation between activity types through the conditional probabilities of the type P (nt|k), i.e., the
100 101 102 103 104 kout 100 102 104 〈a(kout)〉 〈nt(kout)〉 〈ng(kout)〉 100 101 102 103 k out 100 101 102 103 〈ng(kout)〉 〈nb(kout)〉 〈nw(kout)〉
Fig. 3. Left: Average number of distinct tags (hnti), of groups (hngi), and of tag assignments (hai)
of users having kout out-neighbors in the Flickr social network. Right: Correlations between the
activity of aNobii users and their number of declared friends and neighbors: group memberships hngi, library hnbi and wishlist sizes hnwi, averaged over users with kout out-links, vs kout. The
data has been log-binned: the symbols indicate the average, and the errorbars the 25 and 75 percentiles for each bin.
10
010
110
210
310
-510
-410
-310
-210
-110
0 P > kout=10 k out=20 kout=4010
010
110
210
310
-510
-410
-310
-210
-110
010
010
110
210
310
410
-510
-410
-310
-210
-110
010
010
110
210
310
410
-510
-410
-310
-210
-110
0n
tn
gn
bn
wFig. 4. Complementary cumulative conditional distributions P (n|kout) in aNobii, where n is the
number of tags nt, of groups ng, of books nb, and wishlist size nw, compared with the global
cumulative distributions P>(black lines). Even among the subset of users with a given kout, a
strong disparity is still observed in the amount of activity. ACM Journal Name, Vol. , No. , 20.
probability for a user to have nttags, knowing that she has k neighbors in the social
network, where the average hnt(k)i is simply the first moment of this conditional
distribution. As shown for some examples in Figure 4, these distributions, although narrower than the distributions shown in Figures 1 and 2, remain broad. This shows that, despite the strong correlations observed, users with a given activity level in the social network remain quite heterogeneous.
4.2 Mixing patterns
While the previous analysis concerns the correlations between the diverse activity levels of a single user, another important question concerns the correlations between the activity metrics of users who are linked in the social network. This is a long-standing problem in social sciences, ecology and epidemiology: a typical pattern, referred to as “assortative mixing,” describes the tendency of nodes of a network (here, the users), to be linked to other nodes with similar properties [Newman 2003]. This tendency appears intuitive in the context of a social network [Newman 2002; Newman and Park 2003], where one expects individuals to be preferentially connected with other individuals sharing the same interests, and the property is then also called “homophily” [McPherson et al. 2001]. Likewise, it is possible to define a “disassortative mixing” pattern whenever the elements of the network tend to link to nodes that have different properties. Mixing patterns can in fact be defined with respect to any property of the nodes. In the present case, we can characterize the mixing patterns concerning various activity types.
In the case of large scale networks, the most commonly investigated mixing pat-tern involves the degree (number of neighbors) of nodes. This type of mixing con-cerns the likelihood that users with a given number of neighbors connect with users with similar degree. This property is investigated by computing multi-point degree correlation functions. The correlation between the degrees of connected users are measured by the conditional probability P (k′|k) that a given user with degree k is
connected to a user of degree k′. Such a quantity is highly affected by statistical
fluctuations, so a more commonly used measure is given by the average nearest neighbors degree of a user u,
ku nn= 1 ku X v∈V(u) kv , (2)
where the sum runs over the set V(u) of neighbors of u. To characterize mixing patterns with respect to nodes’ degrees, a convenient measure can be built on top of ku
nn by averaging over all nodes u that have a given degree k [Pastor-Satorras
et al. 2001; V´azquez et al. 2002]: knn(k) = 1 |u : ku= k| X u:ku=k ku nn, (3)
which turns out to be the first moment of P (k′|k).
In the case of folksonomies, since each user is endowed with several properties characterizing his activity, it is interesting to characterize mixing patterns with respect to each of these properties. To this end, we generalize the average nearest neighbors degree presented above, and define for each user u the average number
100 101n 102 g 101 102 100 101 n102 103 t 101 102 100 101 102 103 104 nb 102 103 104 100 101 102 103 104 nw 102 nt,nn(nt) ng,nn(ng) nb,nn(nb) n w,nn(nw) aNobii 100 102 k 104 102 103 100 102 ng 102 100 101 102 103 104 nt 102 103 100 101 102 103 104 105 a 103 104 k nn(k) nt, nn(nt) ann(a) n g, nn(ng) Flickr
Fig. 5. Mixing patterns in the aNobii and Flickr dataset: average number nt,nn(nt) of distinct
tags of the nearest neighbors of users having ntdistinct tags; average number ng,nn(ng) of groups
of the nearest neighbors of users belonging to ng groups; average number nb,nn(nb) of books
of the nearest neighbors of users who have read nb books; average wishlist size nw,nn(nw) of
the nearest neighbors of users who have a wishlist of size nw; average out-degree knn(k) of the
nearest neighbors of users having out-degree k; and average number ann(a) of distinct triples of
the nearest neighbors of users having a distinct triples.
of tags of her nearest neighbors, nu t,nn= 1 ku X v∈V(u) nv t ,
and, similarly, the average total number of tags used by her nearest neighbors, au
nn= 1 ku
P
v∈V(u)av, the average number of groups to which her nearest neighbors
participate, nu
g,nn = k1u
P
v∈V(u)nvg, and, in the case of the aNobii dataset, the
average number of books read by her nearest neighbors, nu b,nn =
1 ku
P
v∈V(u)nvb
and the average wishlist size of her nearest neighbors, nu
w,nn=k1u
P
v∈V(u)nvw.
In analogy with the case of knn(k), we can compute the average number of distinct
tags of the nearest neighbors for the class of users having n distinct tags, nt,nn(n) = 1 |u : nt(u) = n| X u:nt(u)=n nu t,nn , (4)
and the average total number of tags used by the nearest neighbors for the class of users with a tag assignments,
ann(a) = 1 |u : a(u) = a| X u:a(u)=a au nn . (5)
Similar formulae can be used to define the average number of groups of the nearest neighbors for the class of users who are members of n groups, ng,nn(n), the average
number of books of the nearest neighbors for the class of users who have read n books, nb,nn(n) and the average wishlist size of the nearest neighbors for the class
of users who have a wishlist of size n, nw,nn(n). ACM Journal Name, Vol. , No. , 20.
Figure 5 shows clear assortative trends for several measures for both the aNobii and Flickr datasets, as in other social networks [Newman and Park 2003; McPherson et al. 2001]. Similar results (not shown) are obtained for Last.fm. The average activity of the neighbors of a user increases with the user’s own activity, for all the activity measures 1. As before, large fluctuations are observed for large activity
values, because of the small number of very active users. Overall, the amount of activity of socially connected users are correlated at all levels.
4.3 Topical similarity
The previous analysis has focused on the amount of user activity, as quantified by several metrics, and on the corresponding correlations and mixing patterns. To understand the interplay between the social network and user activities, it is however necessary to take into account not only the amount, but also the nature and content of the user activities. To compare users in detail, we therefore focus here on the topical similarity between user profiles as measured by the shared features — tags, groups, books, songs, and so on — in their profiles.
A first natural question regards the possible existence of some amount of global similarity between the users of a given folksonomy. For instance, in the context of tags, a simple test for the existence of a globally shared vocabulary can be performed by selecting pairs of users at random and measuring the number of tags they share, nst.
In the case of Flickr, this measure shows that there is actually no shared tag vocabulary; this is not very surprising, given that Flickr is a narrow folksonomy (see Section 5) and the broad range of interests of the users. The average number of shared tags is only about 1.6 in Flickr, and the most probable case is in fact the absence of any tags shared by the selected users. When choosing two users at random this occurs with probability close to 2/3. Nonetheless, as shown in Figure 6, it can happen that randomly chosen users share a large number of tags, as the distribution of this number is quite broad and extends to values of a few hundreds tags.
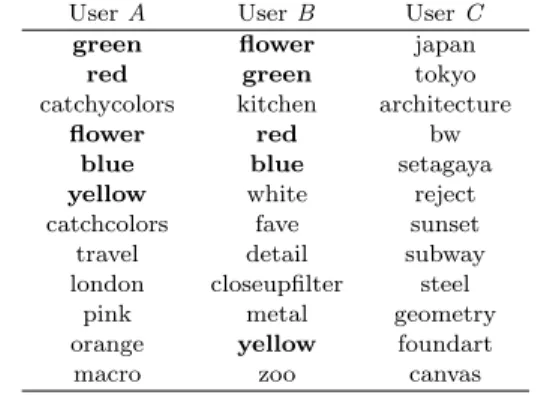
Despite the lack of a globally shared profile, a number of mechanisms may how-ever lead to local similarity of users’ profiles, in terms of shared tags, groups mem-bership, books, musical tastes, and so on, just as homophily effects are observed in many social networks with respect to age, ethnicity, religion, etc [McPherson et al. 2001]. The presence of a social link suggests some degree of shared context between the connected users, who are likely to have some interests in common, or to share some experiences, and who are moreover exposed to each other’s content and annotations. As an example, Table II shows the 12 most frequently used tags for three Flickr users with comparable tagging activity. User A and user B have marked each other as friends, while user C has no connections to either A or B on the Flickr social network. All of these users have globally popular tags in their tag vocabulary. In this example, the neighbors A and B share an interest (expressed by the tag flower ) and several of the most frequently used tags (marked in bold).
As often discussed in social sciences, the observed homophily can 1The quantitative differences between the different cases shown in Fig. 5 are not relevant to the
0
200
400
n
st10
-610
-410
-210
0P(n
st)
Fig. 6. Probability distribution of the number of shared tags for two randomly chosen Flickr users. The probability to have no tags in common is P (0) ≈ 0.67, but the overall distribution is broad.
emerge for different reasons, which are summarized in two scenarios: link selection and social influence [McPherson et al. 2001; Leenders 1997; Shalizi and Thomas 2010]. The former scenario considers that so-cial links are preferentially created between individuals who are already similar and choose each other for establishing the social link precisely because they share some degree of similarity. In the latter scenario, individuals become more similar over time because they influence each other. Disentangling these scenarios is a delicate matter that requires longitudinal data sets, as social influence implies a temporal evolution of a relationship [Crandall et al. 2008; Aral et al. 2009; Aiello et al. 2010; Shalizi and Thomas 2010]. Regardless of the distinction between these possi-ble mechanisms driving the potential local similarity, it is important to understand how to measure this effect, and how to relate it to the social network structure, in particular with the distance between users along the network. Similarity can concern any possible type of activity: content (e.g., books in aNobii), used tags, group membership, and so on.
From this perspective, it is necessary to define robust measures of profile simi-larity between two users u and v, regarding the various types of activity. The first and simplest measure is given by the number of shared items for each activity: the number of shared tags nst of the tag vocabularies of u and v, the number of
shared groups nsg to which both u and v belong, the number of common books in ACM Journal Name, Vol. , No. , 20.
Table II. Tags most frequently used by three Flickr users User A User B User C
green flower japan red green tokyo catchycolors kitchen architecture
flower red bw
blue blue setagaya yellow white reject catchcolors fave sunset travel detail subway london closeupfilter steel
pink metal geometry orange yellow foundart macro zoo canvas
their libraries or wishlists for aNobii, and the number of common songs for Last.fm. These measures may however be affected by the amounts of activity of the users; two users who apply many tags may have more tags in common than two less active users, just because it is more probable to find common items in two long lists than in two short ones. For instance, let us consider two users with 100 tags each, and having 10 of them in common. The number of shared tags is 10 in this case, but represents just 10% of their tagging activity. Two users with the same 5 tags, on the other hand, have nst= 5, i.e. less than in the previous case, but this represents
100% of their activity. In short, such simple measures are not normalized, and we therefore also need to consider measures that compensate for the heterogene-ity in the amounts of activheterogene-ity. To this end, we consider a distributional notion of similarity between the profiles of u and v.
Let us first consider the case of the tags. Following Cattuto et al. [2008] we regard the vocabulary of a user u as a feature vector W whose elements correspond to tags and whose entries are the tag frequencies for that specific user’s vocabulary, i.e., wutis the number of resources tagged with t by u. To compare the tag feature
vectors of two users, we use the standard cosine similarity [Salton 1989] defined as σtags(u, v) = P twutwvt pP tw2ut pP tw2vt . (6)
This quantity is 0 if u and v have no shared tags, and 1 if they have used exactly the same tags, in the same relative proportions. Because of the normalization factors in the denominator, σtags(u, v) is not directly influenced by the global activity of a
user.
Similarly, we can define the cosine similarities for groups memberships and for books. Since a user belongs at most once to a group, and adds a book only once to her library, the elements of the group and book vectors are binary, and the cosine similarity reduces to σgroups(u, v) = P gwugwvg png(u)ng(v) ; σbooks(u, v) = P bwubwvb pnb(u)nb(v) , (7)
where wug is 1 if u belongs to group g and 0 otherwise, and wub is 1 if u has book
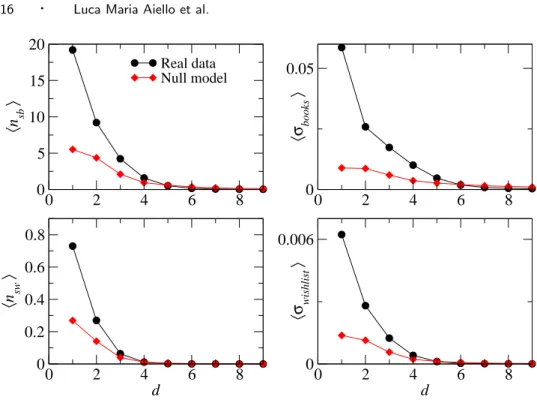
0 2 4 6 8 0 5 10 15 20 〈 n sb 〉 Real data Null model 0 2 4 6 8 0 0.05 〈σ books 〉 0 2 4 6 8 d 0 0.2 0.4 0.6 0.8 〈 n sw 〉 0 2 4 6 8 d 0 0.006 〈σ wishlist 〉
Fig. 7. Average library and wishlist similarity as a function of the distance on the aNobii social network. Top: average number of shared books in the libraries of users at distance d, and cor-responding cosine similarity. Bottom: average number of shared items in the wishlists of users at distance d, and corresponding cosine similarity. The diamonds correspond to the null model discussed at the end of Section 4.
Figures 7 and 8 give an indication of how the similarity between users depends on their shortest path distance d on the social network, by showing the average similarity of two users as a function of d. In aNobii, for instance, the average number of shared books is rather large for neighbors (close to 20), but it drops rapidly as d increases, and is close to 0 for d ≥ 4. Similar results are obtained for the number of common groups and tags, and hold for Last.fm and Flickr as well. The cosine similarities display the same decreasing trend as the distance along the social network increases.
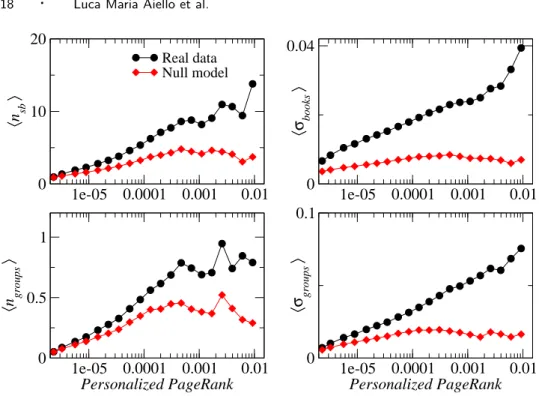
The shortest path distance between two users gives the minimum num-ber of steps to navigate on the online social network to go from one user to the other. This measure of topological proximity between users can however be sensitive to the addition or removal of one single link, and does not take into account the fact that more than one path can connect the users. To overcome this issue, the personalized PageRank [Haveliwala 2003] of one user v with respect to another user u can be considered. This personalized PageRank essentially gives the probabil-ity, for a random walker starting from the profile page of user u, to visit the profile page of v. As shown in Fig. 9, the topical similarity between users increases when their relative personalized PageRank increases. As the personalized PageRank decreases when the distance between users
0 2 4 6 0 0.02 0.04 0.06 〈σ tags 〉 Real data Null model 0 2 4 0 0.02 0.04 0.06 0.08 0 2 4 6 d 0 0.02 0.04 0.06 〈σ groups 〉 0 2 4 d 0 0.02 0.04 0.06
Flickr
Last.fm
Fig. 8. Average tag and group similarity as a function of the distance on the Flickr and Last.fm social networks. Top: average cosine similarity between the tag vocabularies. Bottom: average cosine similarity between the groups participation vectors. The diamonds correspond to the null model discussed at the end of Section 4.3.
increases, this increase is consistent with the decreasing trend of Fig. 7.
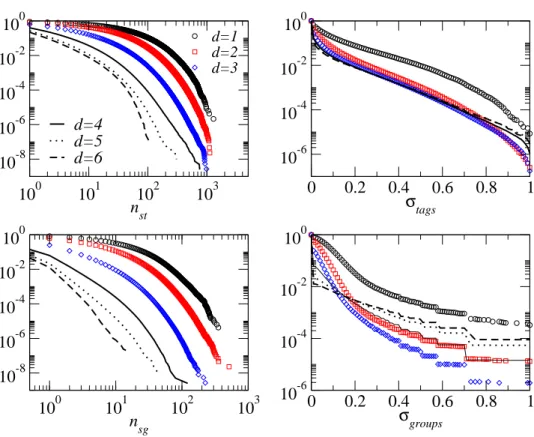
To gain more insight into the entanglement between similarities and distance on the social network, we present in Figures 10 and 11 the probability distributions of the selected similarity measures for pairs of users at social distance d. The figures clearly expose the dependence of all distributions upon the distance of the users along the social network: for users who lie at small distances on the social network, rather broad distributions spanning several orders of magnitude are observed for the number of shared tags, groups, or books. As the distance d along the network increases, the distributions become narrower. Two comments are in order: first, the distributions of nst at short distances reach much larger values of nst than in
Figure 6 (the same is observed for the number of shared groups or books). The reason is that, when choosing a random pair of nodes (as in Figure 6), it is very unlikely to select two neighboring nodes. Second, at any distance, the most probable value of nsg or nst is 0, even if the distributions are broad, and this probability
increases with d. For instance, for Flickr users, the probability P (nst = 0) that
two users do not share any tag is 0.1 if the users are neighbours (i.e., at d = 1), 0.17 if they are at distance d = 2, 0.37 at distance d = 3. For groups, we obtain P (nsg = 0) is 0.17 for d = 1, 0.4 at d = 2, 0.74 at d = 3.
1e-05 0.0001 0.001 0.01 0 10 20 〈 n sb 〉 Real data Null model 1e-05 0.0001 0.001 0.01 0 0.04 〈σ books 〉 1e-05 0.0001 0.001 0.01 Personalized PageRank 0 0.5 1 〈 n groups 〉 1e-05 0.0001 0.001 0.01 Personalized PageRank 0 0.1 〈σ groups 〉
Fig. 9. Average library (top) and group (bottom) similarity between two aNobii users as a function of the personalized PageRank of one user with respect to the other user. The diamonds correspond to the null model discussed at the end of Section 4.
features: they mostly span the whole interval of possible values, but the probability of reaching values close to 1 becomes smaller when d increases, while the probability of a zero similarity increases. The trends are similar for Last.fm.
The presence of assortative mixing patterns in the social network, with respect to the intensity of users activity, makes it necessary to investigate in more detail the observed local similarity of profiles. It could indeed be the case that such assorta-tivity, by a purely statistical effect, yields an apparent local similarity between the tag vocabularies of users. For example, even in a hypothetical case of purely ran-dom tag assignments, it would seem more probable to find tags in common between two large tag vocabularies than between a small one and a large one. Furthermore, as we have shown, users who are more active have more friends, and their friends are also more active, therefore similarity with their friends may depend on their greater activity alone.
To discriminate between effects simply due to the assortativity and those due to actual profile similarity, one has to construct a proper null model, i.e., an artificial system that retains the same social structure as the one under study, but lacks any feature similarity other than the one that may result from purely statistical effects. This is done by keeping fixed the social network and its assortativity pattern for the intensity of the activity, but destroying socially-related feature similarity by means of a random permutation of profile items. For instance, we proceed in the following fashion for the tags: (i) we keep the social network unchanged, preserving each user’s degree k; (ii) we shuffle the tags among users in such a way as to preserve
10
010
110
210
3n
st10
-810
-610
-410
-210
0 d=1 d=2 d=30
0.2
0.4
0.6
0.8
1
σ
tags10
-610
-410
-210
0d=4
d=5
d=6
10
010
110
210
3n
sg10
-810
-610
-410
-210
00
0.2
0.4
0.6
0.8
1
σ
groups10
-610
-410
-210
0Fig. 10. Left: Complementary cumulative probability distributions of the number of shared tags and groups for two Flickr users lying at distance d on the social network, for different values of d. Right: Complementary cumulative probability distributions of the cosine similarity between the tag vocabularies and group memberships of two Flickr users.
each user’s number of tag assignments a as well as number of distinct tags nt. This
guarantees that the distribution of frequencies of tags is left unchanged. For group membership and for books, we can proceed in a similar way except we preserve in the shuffle each user’s number of groups ng and number of books nb. This
procedure is in the spirit of the definition of null models for detecting the importance of patterns in networks [Maslov et al. 2004], or of the definition of random models of networks with given degree distributions or correlation patterns [Molloy and Reed 1995; Catanzaro et al. 2005; Serrano and Bogu˜n´a 2005].
This null model preserves the assortativity patterns with respect to the amount of user activity, as each user has exactly the same number of distinct tags, tag assignments, groups, and books as in the real data. However, correlations between the tag vocabularies and other features are lost, except for the ones purely ascribed to statistical effects.
Using the null model defined above, we measure the similarity between users at distance d on the social network in the same way as for the original data. As Figure 7 shows, the average number of books in libraries and wishlists, as a function of the
10
010
110
210
310
4n
sb10
-810
-610
-410
-210
0 d=1 d=2 d=30
0.2
0.4
0.6
0.8
1
σ
books10
-810
-610
-410
-210
010
010
110
210
3n
sw10
-810
-610
-410
-210
00
0.2
0.4
0.6
0.8
1
σ
wishlist10
-610
-410
-210
0Fig. 11. Complementary cumulative distributions of the number of shared books and (left), and of the similarities in the lists of books (right), in the libraries (top) and in the wishlists (bottom) of aNobii users lying at distance d on the social network, for various values of d.
distance d, shows a very similar trend to the original (non-shuffled) data. Similar curves are obtained for the number of shared tags or groups. For neighboring users, and also for next-to-nearest neighbors, the average numbers of shared tags or groups are generally significantly lower in the null model, but the distributions are very similar, as shown in Figure 12(top). The assortative mixing between the amount of activity of neighboring users is therefore enough to yield a strong topical similarity as simply measured by the number of shared tags, groups or books. The case of the cosine similarity is quite different: as shown in Figures 7 and 8, the average cosine similarity in the null model does not depend as strongly on distance in the social network. Figure 12(bottom) also shows that the distributions of σtags are
very different for the original and shuffled data, and do not depend on distance in the case of the shuffled data.
We conclude that the homophily measured by the cosine similarity is a genuine non-random effect in these social networks, not only due to the assortative mixing: the measured topical homophily is not only due to the homophily in terms of amounts of activity.
1
10
100
1000
n
st10
-810
-610
-410
-210
0P(n
st)
d=1
d=2
d=1, shuffled
d=2, shuffled
0
0.2
0.4
0.6
0.8
1
σ
tags10
-810
-610
-410
-210
0P(
σ
tags)
Fig. 12. Top: Probability distributions of the number of shared tags of two Last.fm users lying at distance d on the social network, for d = 1 and d = 2 (symbols), and for the same network with shuffled tags (lines). Bottom: same for the distributions of the cosine similarities of the tag vocabularies.
5. SOCIAL LINK PREDICTION
In the previous section, we have observed the presence of homophily in the social network: users connected by a social link show a significantly higher topical similar-ity compared to non-linked users. This correlation is observed for several activities, like tagging and group affiliation, and occurs in all the datasets considered. A con-sequent guess resulting from such finding is that the presence of a social tie could be predicted relying only on the topical similarity between users. Since we obtained information about user activity and social links for all the datasets discussed above, we are able to test this hypothesis in three different settings.
In this section, we focus on the Last.fm and aNobii datasets. We do so for several reasons. First, in these two cases, the data include information on the users’ libraries, in addition to groups and annotations. Second, a prediction based on the tagging information is more meaningful in a broad folksonomy, in which users can label the same (global) set of items and pick from this global set to form their libraries. This condition allows us to deal with similarity based on shared
content as well as shared vocabulary. Last.fm and aNobii are broad folksonomies as any user can tag any artist or book. This is not the case for Flickr, considered a narrow folksonomy. Users usually tag only the pictures they upload themselves.
Moreover, the Last.fm and aNobii datasets have peculiarities that allow to draw interesting conclusions regarding link prediction task. They both have a detailed specification about the users’ mother tongue. As we will see, language is a fea-ture that can considerably influence the prediction, and that should thus be taken into account when accuracy is measured. Additionally, Last.fm provides the tas-teometer score, a user-to-user similarity metric computed by the system. The tasteometer algorithm is not public. Since tasteometer is independent from any social information (as we have verified empirically, although we do not have a precise information of how the tasteometer values are effectively computed) and is based only on listening patterns, we can fairly compare the prediction accuracy achieved by user-to-user topical similarity measures and the one obtained by the system-provided similarity metric.
5.1 Methodology
Our link prediction problem can be defined as follows. Given a subset of users Ut⊆ U , we want to predict the presence or absence of a social link for every pair
(u, v) ∈ {Ut× Ut|u 6= v}. Of course, the information about the social network
topology is not known, but we are given the full information about the features that describe the user profiles. We deal in particular with four different features: groups, library, tags, and tagged items. Note the difference between items and library features. In aNobii, tagged items are a subset of the whole set of books in the user’s library, while in Last.fm tagged items can be tracks, albums or artists and the library is composed only by the top 50 artists in the user’s global playlist. Tags and items can be directly extracted from the three-dimensional triples space through aggregation (details are provided in Section 5.2).
We take into account each feature separately, so each user is described with a single feature vector. For each pair of users in Ut, we compute a similarity value
between their feature vectors using the metrics defined in Section 5.2. In the case of Last.fm we also have the system-provided tasteometer similarity. Next, we sort the node pairs in decreasing order of their similarity score. The pairs with the highest topical similarity are those that we suppose are the most likely to be connected with a social link. For this reason, we predict the presence of a tie for every user pair whose similarity value is greater than or equal to a threshold value σ. To evaluate the accuracy of our predictions, we check the presence of each predicted link in the real social network and we count the number of true positives and false positives. As the value of σ decreases, a higher number of links is predicted, leading to an increase in the number of both true positives and false positives. We test the accuracy of our predictor for all the significant values of σ. The similarity measure that performs best for the prediction task is the one that achieves the best ratio between true positives and false positives, across all the possible threshold values. To quantitatively measure the prediction performance for the whole set of threshold values we consider ROC curves [Fawcett 2006] and we compare the area under the curve (AUC) achieved by the different features and similarity metrics considered. ROC curves are commonly used in the machine learning community for
the link prediction task [Clauset et al. 2008].
Given this setting, it is important to select a significant sample of users Ut.
Intuitively, one could choose Ut≡ U . The problem is that, since the social graph’s
density is very low, the full social matrix U × U is very sparse, thus leading to a very low number of potential true positives.
The problem of studying greatly biased datasets is well-known by data miners and it is a common issue also in social link prediction due to the intrinsic sparsity of social graphs [Liben-Nowell and Kleinberg 2003; Getoor and Diehl 2005; ?; L¨u and Zhou 2010]. It has been shown that the AUC is a good measure for the performance evaluation when there is a strong class skew [St¨ager et al. 2006]. However, in the first part of our evaluation we want to minimize the sparsity problem in order to compare the predictive power of different features in a less biased setting.
We thus restrict our analysis to several smaller subsets each composed of 500 users only, sampled on the basis of one of two criteria. First, we extracted a Most Connected set for each feature, composed of the nodes with the highest out-degree and that have at least one element for the considered feature. Second, we sampled a distinct Most Active set for each feature, containing the 500 users with the largest number of elements for that feature. More in detail, we chose the sets of users with the highest number of groups, with the highest number of objects in their libraries, and, for both item and tag features we chose the set of the 500 taggers with the highest number of triples. In short, we have distinct Most Active and Most Connected samples for each feature, except for items and tags because they both derive from the same triple space.
The Most Active sampling provides the best scenario in which to explore the effectiveness of link prediction based on topical similarity Furthermore, given the correlation between user activity and social connectivity (see Figure 3), the Most Active nodes typically have a rather high degree, thus ensuring a relevant number of intra-sample social connections. As a result, the density of our social network samples ranges from 0.02 to 0.07, which is three–four orders of magnitude higher than the full networks.
In a second phase of the evaluation, we expand our observations with a sensitivity analysis to show how much the prediction accuracy is affected by the sub-graph density, the user activity, and the sample size, thus disentangling the evaluation from the possible skew due to the narrower selection of the most active and connected users.
5.2 Similarity metrics
To model the task of predicting social links we need to define measures of profile sim-ilarity between users. In particular, we have to select a robust simsim-ilarity metric for the features that characterize the activity of users. In relation to the groups mem-bership and library features we follow the approach in Section 4.3 that computes similarities by way of the standard cosine similarity as formalized in Equation 7.
For the remaining features we adopt the framework by Markines et al. [2009] that represents the system as a tripartite graph that involves users, tags, and resources (e.g., books, songs, photos, etc.). A ternary relation between a user u, a tag t, and
a resource r can be defined as a triple. We then can establish a set of triples as a folksonomy F and we can define similarity measures σ(x, y) where x and y can be two resources, tags, or users. In our analysis we focus on the definition of similarity functions σ(u, v) where u and v are two users.
Since measures for similarity and relatedness are not well developed for three-mode data such as folksonomies, we consider various ways to obtain two-three-mode views of the data. In particular, we consider two-mode views in which the two dimensions considered are dual — for example, users can be represented as sets of tags or resources. The process of obtaining a two-mode view from a folksonomy is called aggregation. In the remainder of this section, we will discuss different aggregation strategies and the set of similarity functions we adopted.
5.2.1 Aggregation Methods. In reducing the dimensionality of the triple space, we necessarily lose correlation information. Therefore, the aggregation method is critical for the design of effective similarity measures; poor aggregation choices may negatively affect the quality of the similarity by discarding informative correlations. As mentioned above, we can define similarity measures for each of the three dimen-sions (users, resources, tags) by first aggregating across one of the other dimendimen-sions to obtain a two-mode view of the annotation information. Since our analysis is in-tended to explore user similarity we can aggregate across one of the tag or resource dimensions, obtaining a description of a user as a vector of, respectively, resources or tags.
We will consider four approaches to aggregate user information: projection, dis-tributional, macro, and collaborative aggregation. To simplify our exposition, in the following definitions we will adopt an aggregation across resources, meaning that a user will be represented as a vector of tags; analogous mechanisms apply when tags are selected as the aggregation dimension. An extensive discussion on these aggregation approaches can be found in our prior work [Markines et al. 2009].
Projection. The simplest aggregation approach corresponds to the projection op-erator πu,t(F ) in relational algebra, assuming the triples are stored in a database
relation F . Another way to represent the result of aggregation by simple projection is a matrix with binary elements where rows correspond to users (as binary vectors, or sets of tags) and columns corresponds to tags (as binary vectors, or sets of users). Distributional. A more sophisticated form of aggregation stems from considering distributional information associated with the set membership relationships. One way to achieve distributional aggregation is to make set membership fuzzy, i.e., weighted by the Shannon information (log-odds) extracted from the annotations. Intuitively, a tag shared by two users may signal a weak association if it is very common. For example, let U be the set of users and Ut the users that annotate
with t. We will use the information of tag t defined as − log p(t) where p(t) = |Ut|
|U |. (8)
Another approach is to define a set of frequency-weighted pairs (u, t, wut) where the
weight wut is the number of resources tagged with t by u. Such a representation
corresponds to a matrix with integer elements wut, where rows are user vectors and ACM Journal Name, Vol. , No. , 20.
columns are tag vectors. We will use both of the above distributional aggregation approaches as appropriate for different similarity measures.
Macro. To compute an average function in class-partitioned datasets (e.g., documents partitioned in categories), micro- and macro-averaging approaches are possible. Micro-averaged scores are calculated consid-ering the contribution from each element in each class. In contrast, macro-averaged values are obtained by first calculating the function for each class and then taking the average of the results. Micro-averaging gives equal weight to every element while macro-averaging gives equal weight to every class. Both approaches are broadly used in text min-ing [Feldman and Sanger 2006]. By analogy, distributional aggregation can be viewed as micro-aggregation if we think of resources as classes. Each annotation is given the same weight, so that a more popular resource would have a larger impact on the weights and consequently on any derived similarity measure. In contrast, macro-aggregation treats each resource’s annotation set independently first, and then aggregates across resources. This will allow the similarity calculation to be incremental, breaking the dependency on global frequencies. In relational terms, we can select the triples involving each resource r, and then project, yielding a set of pairs for r: {(u, t)r} = πu,t(σr(F )). This results in per-user binary matrices of
the form wr,ut. The per-user binary matrix representations wr,ut∈ {0, 1} are used
to compute a local similarity σr(u, v) for each pair of users u and v. When defining
the Shannon information of a feature, the feature probability p(t) must be replaced by a conditional probability p(t|r). Finally, we macro-aggregate by voting, i.e., by summing across resources to obtain the global similarity. Macro-aggregation does not have a bias toward resources with many annotations. However, in giving the same importance to each resource, the derived similarity measures amplify the relative impact of annotations by less popular resources.
Collaborative. Macro-aggregation lends itself to the exploration of collaborative filtering in folksonomies while the computation remains incremental. Thus far, we have only considered feature-based representations when working with a tripartite representation. That is, a user is described in terms of its tag or resource features. If two users share no feature, all of the measures defined on the basis of the aggregation schemes will yield a zero similarity. In collaborative filtering, on the other hand, the fact that one or more users vote for (or in our case annotate) two objects is seen as implicit evidence of an association between the two objects, even if they share no features. The more users share a pair of items, the stronger is the association. We want to consider the same idea in the context of user similarity in folksonomies. If many resources have been annotated by the same pair of users, even with different tags, the two users might be related. Likewise, if two users apply the same tags, even to annotate different resources, the two users might be related. We can capture this by adding a feature-independent local similarity to every pair (u, v) of users in macro-aggregation. In practice we can achieve this by adding a special “resource tag” tr to all users that tagged r. This way all of r’s users have at least one
annotation in common. However, the information of such special tag would be − log(p(tr|r)) = − log(1) = 0. To ensure that the special tag makes a non-zero
resource r as
p(t|r) = |ut,r| |ur| + 1
(9) which is always less than 1 so that − log(p(tr|r)) > 0.
5.2.2 Similarity Measures. We wish to explore several information-theoretic, statistical, and practical similarity measures. Each of the aggregation methods re-quires revisions and extensions of the definitions for application to the folksonomy context. Having shown in our prior work [Markines et al. 2009] that distributional aggregation yields better accuracy than projection, and collaborative aggregation yields better accuracy than macro-aggregation, with the same computational com-plexity, we focus on distributional and collaborative aggregations. For brevity, we show definitions only for the similarity measures in the distributional case. These definitions are based on feature probabilities p(x) defined in Equation 8. The defi-nitions of the local similarities for collaborative aggregation are similar except that the feature probabilities are replaced by the conditional probabilities defined in Equation 9. We suppose that u, v ∈ U represent users and Xu, Xv are their vector
representations. Of course, the attributes of X depend on the aggregation dimen-sion. In the following formulas we consider the case of aggregation across resources, i.e. the users are denoted by vectors of tags with tag elements wut.
Matching. The distributional version of the matching similarity is
σ(u, v) = − X
t∈Xu∩Xv
log p(t). (10)
Overlap: Distributional overlap is given by σ(u, v) = P t∈Xu∩Xvlog p(t) max(P t∈Xulog p(t), P t∈Xvlog p(t)) . (11)
Jaccard: Distributional Jaccard similarity is defined as σ(u, v) = P t∈Xu∩Xvlog p(t) P t∈Xu∪Xvlog p(t) . (12)
Dice: Distributional version of Dice is defined as
σ(u, v) = 2 P t∈Xu∩Xvlog p(t) P t∈Xulog p(t) + P t∈Xvlog p(t) . (13)
Cosine: For the distributional version of the cosine, it is natural to use the frequency-weighted representation σ(u, v) = Xu ||Xu|| · Xv ||Xv|| = P twutwvt pP twut2 pP tw2vt . (14)
This formula is equivalent to Equation 6.
Maximum Information Path: The last measure we consider is Maximum Infor-mation Path (MIP) [Markines and Menczer 2009]. The MIP similarity is an ex-tension of traditional shortest-path based similarity measures and Lin’s similarity measure [Lin 1998]. MIP differs from traditional shortest-path similarity measures