HAL Id: hal-01988262
https://hal.inria.fr/hal-01988262
Submitted on 21 Jan 2019
HAL is a multi-disciplinary open access
archive for the deposit and dissemination of
sci-entific research documents, whether they are
pub-lished or not. The documents may come from
teaching and research institutions in France or
abroad, or from public or private research centers.
L’archive ouverte pluridisciplinaire HAL, est
destinée au dépôt et à la diffusion de documents
scientifiques de niveau recherche, publiés ou non,
émanant des établissements d’enseignement et de
recherche français ou étrangers, des laboratoires
publics ou privés.
Analytical Fiber ODF Reconstruction in 3D Polarized
Light Imaging: Performance Assessment
Abib Alimi, Samuel Deslauriers-Gauthier, Felix Matuschke, Daniel Schmitz,
Markus Axer, Rachid Deriche
To cite this version:
Abib Alimi, Samuel Deslauriers-Gauthier, Felix Matuschke, Daniel Schmitz, Markus Axer, et al..
Analytical Fiber ODF Reconstruction in 3D Polarized Light Imaging: Performance Assessment. ISBI
2019 - IEEE International Symposium on Biomedical Imaging, Apr 2019, Venice, Italy. �hal-01988262�
Analytical Fiber ODF Reconstruction in 3D Polarized Light Imaging: Performance Assessment
A. Alimi
†, S. Deslauriers-Gauthier
†, F. Matuschke
?, D. Schmitz
?, M. Axer
?and R. Deriche
†§†
Athena Project-Team, Inria Sophia Antipolis-M´editerran´ee, Universit´e Cˆote d’Azur, France
?Institute of Neuroscience and Medicine (INM-1), Research Center J¨ulich, J¨ulich, Germany
ABSTRACT
Three dimensional Polarized Light Imaging (3D-PLI) allows to map the spatial fiber structure of postmortem tissue at a sub-millimeter resolution, thanks to its birefringence prop-erty. Different methods have been recently proposed to recon-struct the fiber orientation distribution function (fODF) from high-resolution vector data provided by 3D-PLI. Here, we fo-cus on the analytical fODF computation approach, which uses the spherical harmonics to represent the fODF and analyti-cally computes the spherical harmonics coefficients via the spherical Fourier transform. This work deals with the assess-ment of the performance of this approach on rich synthetic data which simulates the geometry of the neuronal fibers and on human brain dataset. A computational complexity and ro-bustness to noise analysis demonstrate the interest and great potential of the approach.
Index Terms— fiber orientation distribution function ODF, 3D-PLI, polarized light imaging, analytical method, spherical harmonics, spherical Fourier transform
1. INTRODUCTION
Three dimensional Polarized Light Imaging (3D-PLI) is a op-tical imaging technique that utilizes the birefringence prop-erty of postmortem tissue to map its spatial organization at resolution lower than millimeters [2, 3, 4]. It provides high resolution 3D fiber orientation vector data, from which fiber orientation distribution functions can be reconstructed at dif-ferent spatial scales. This fODF, well known in the diffusion Magnetic Resonance Imaging (dMRI) community [5, 6, 7], is a useful tool for the comparison of 3D-PLI and dMRI fiber orientation estimates, for multi-modality imaging, and for the validation of dMRI results.
Different groups have proposed methods to reconstruct the fODF from 3D-PLI data. Axer et al. (2016) [8] are the
§This work was partly supported by ANR ”MOSIFAH” under
ANR-13-MONU-0009-01, the ERC under the European Union’s Horizon 2020 research and innovation program (ERC Advanced Grant agreement No 694665:CoBCoM).?This work has also received partially funding from the European Union’s Horizon 2020 Research and Innovation Program under Grant Agreement No. 7202070 (Human Brain Project SGA2). ?The
au-thors gratefully acknowledge the computing time granted by the JARA-HPC Vergabegremium and provided on the JARA-HPC Partition part of the super-computer JURECA at Forschungszentrum J¨ulich [1].
first to introduce the pliODF which uses the concept of super-voxel (SV) to downsample the high resolution data, and then estimate the fODF on the unit sphere by expanding a normal-ized directional histogram (a discretnormal-ized distribution of orien-tations) with a series of spherical harmonics.
Recently, Alimi et al. (2017), first proposed to regularize the pliODF using the Laplace-Beltrami operator [9], before introducing an analytical approach [10] to compute the fODF from 3D-PLI data. This latter method is based on elegantly defining each fiber orientation in a native voxel as a 2D Dirac delta function on the unit sphere and the fODF as a weighted sum of these Diracs within each super-voxel. As in [8], we refer to a tissue voxel containing a single high-resolution fiber orientation as ‘native voxel’. The super-voxel regroups K = rows × columns × slices native voxels.
The purpose of the paper is to study the performance of the analytical fiber ODF reconstruction method [10] through highly rich synthetic dataset which simulates the brain white matter fibers using a geometric model, and through human brain dataset. In the following, the analytical fiber ODF ap-proach implementation is briefly presented as well as the syn-thetic data generation method, then the different performed tests are described and finally the results are discussed in the last section.
2. METHODS
2.1. Fiber ODF reconstruction implementation
The analytical approach makes use of a truncated spherical harmonics series Ym
l to represent in a continuous domain the
fiber orientation distribution functions in a given super-voxel as f (θ, φ) ≈ Lmax X l=0 l X m=−l clmYlm(θ, φ) (1)
where Lmaxis the maximum order or bandlimit of the
trun-cation, clmare the SH coefficients which completely describe
the fODF [10] and (θ, φ) are the spherical coordinates of a fiber orientation vector in a given direction.
This fiber ODF f is modeled as a sum of 2D Dirac delta δ functions. Each δ function represents the spatial orienta-tion of a single fiber orientaorienta-tion vector on the unit sphere.
Super-voxel size Lmax 50 × 50 × 1 10 × 10 × 1 5 × 5 × 1 4 0:04.14 0:05.53 0:09.02 6 0:08.86 0:10.49 0:14.50 8 0:15.98 0:18.04 0:22.13 10 0:26.05 0:27.68 0:32.45 12 0:39.15 0:40.64 0:44.99
Table 1. Computational running times in minutes:seconds. The ROI consists of a human brain coronal slice of 1000 × 1700 × 1 native voxels.
Since 3D-PLI provides us with all the K fiber orientations (θk, φk) located in the super-voxel, the corresponding fODF
is modelled as f (θ, φ) =K1 PK
k=1δ(cos θ −cos θk)δ(φ−φk)
and the clmcoefficients are analytically computed through the
spherical Fourier transform, clm= 1 K K X k=1 Ym l (θk, φk). (2)
Although this approach uses the SH to represent the fODF, it is independent of the SH basis used and here the real and symmetric basis defined in [6] is considered. In this case, the number of terms of the SH basis of order l is N = (1/2)(l + 1)(l + 2), where only the even orders are chosen.
2.2. Synthetic data generation
For the simulation of the 3D-PLI datasets, two 3D fiber bun-dles intersecting at an angle α are generated. A 3D collision check is performed to ensure that the individual fibers do not overlap. For this purpose, the fibers are divided into short seg-ments so that two segseg-ments can be checked for a collision. In the event of a collision, the two segments are slowly pushed apart. This happens simultaneously for all colliding objects and is repeated until all segments have no more collisions. The 3D models generated in this way are then used for the simulation using SimPLI tool [11, 12] to produce synthetic 3D-PLI datasets. The noise of the CCD camera is modelled by a negative binomial distribution in which the variance σ depends on the expected light intensity µ by σ = 3µ as in [13]. From the generated 3D-PLI signal, high-resolution ori-entations are reconstructed based on the approaches in [3, 13]. 2.3. Human data description
The processed experimental data was taken from a human brain. It consists in one coronal section of the right hemi-sphere out of the dataset described in [13]. The section has a thickness of 70 µm which was measured with a pixel size of 64×64 µm2, analyzed pixel-wise for its fiber orientations and
registered onto an image of the brain block before sectioning.
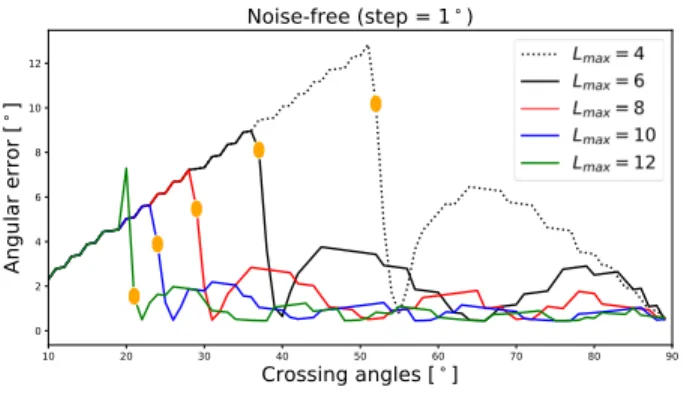
Lmax Angular Limit Angular Error
4 52◦ 10.18◦
6 37◦ 8.11◦
8 29◦ 5.47◦
10 25◦ 3.89◦
12 21◦ 1.55◦
Table 2. Angular resolution limit improves with Lmaxwhile
angular error is reduced.
2.4. Performance assessment
To assess the performance of our fiber ODF reconstruction approach, we carry out tests on synthetic data as well as on experimental human brain 3D-PLI datasets.
Computational complexity analysisLet us assume, in each super-voxel, there are K = XY Z native voxels. We re-call our method uses SH representation and N is the number of SH coefficients which describe the fiber ODF. Using the Diracs, the computation of each SH coefficient is the simple averaged sum from Equation 2, therefore its reconstruction is O(N ). This test is performed on the previously described coronal brain slice from the right hemisphere.
Peaks detection and Angular resolutionIn dMRI commu-nity it is generally assumed that the local maxima or peaks of the normalized fODF coincide with the fiber directions [5, 6]. The same assumption is considered here in order to estimate the fODF local orientations and compare with ground truth. To this end, we generate noise-free synthetic data, consisting of two fiber bundles crossing at different angles α ranging from 0◦to 90◦ in 1◦ increments. Therefore, we can quanti-tatively study the angular resolution limitations of the recon-structed fODF. Here, the angular resolution limit is the critical angle under which the peaks of the two fiber populations are confounded, that is, they can not be detected separately.
Noise robustness Noise robustness is actually assessed during fiber orientation estimation stage in 3D-PLI analysis work-flow [4, 14, 15, 13], prior to fODF reconstruction. That is, the fODF reconstruction method does not directly deal with the noise (removal). However, it is still crucial to test our algorithm’s robustness to noise. Therefore, we perform a synthetic experiment on noisy dataset (see 2.2 ) consisting of two fiber populations crossing at angles α varying from 10◦to 90◦in 10◦increments. Such noisy dataset is generated a 100 times and the algorithm is run each time to estimate the angular resolution limit.
Angular error In these previous tests, we also evaluate the fODF angular error as β = πM180PM
m=1arccos(v t
mwm)
which is the average distance between vmthe mth ground
truth orientation and wm the closest of the recovered peak
orientations of the fiber ODF and M is the number of fibers in the super-voxel.
10 20 30 40 50 60 70 80 90 Crossing angles [ ] 0 2 4 6 8 10 12 Angular error [ ] Noise-free (step = 1 )
Fig. 1. Angular error from noise-free data.
3. RESULTS AND DISCUSSION
Computational running timeWe study the fODF reconstruc-tion speed of our method on a 4 processors, 2.60 GHz (×4), 16 GB RAM machine, and Table 1 shows the results. As ex-pected, the analytical approach is very fast. This is due to the choice of defining each fiber orientation as a 2D Dirac function on the unit sphere, which simplifies and fastens the computation of the SH coefficients, analytically. Notice how fast and computationally efficient is our approach and that the computation time decreases when the super-voxel size in-creases as observed in [8].
Angular resolutionTable 2 shows the results of the de-termination of the critical angle of our analytical fODF re-construction method in a noise-free setting. The angular res-olution is generally high, going from 51◦down to 21◦ when Lmaxgoes from 4 to 12, while the angular error improves of
roughly 10◦. This is because the higher order frequencies are taken into account in the fODF estimation when SH ban-dlimit increases and thanks to the use of the Diracs. This result is backed up in Figure 1 where the angular error is plot-ted against the crossing angles. It shows the improvement of both the critical angle, spotted in orange dots, and the angular error, for every Lmax, in good agreement with results
previ-ously shown in [10].
Noise robustnessTable 3 gives the angular resolution limit α and the angular error of the reconstructed fODF from noisy data. Results are indicated in intervals since the considered crossing angles range from 10◦to 90◦in 10◦increments. We can see that, for Lmax ≤ 6, α is roughly between 40◦to 60◦
as in the noise-free case and between 30◦to 40◦when Lmax
is higher, indicating thus not a big influence of the noise on the method, which therefore recovers successfully the fODF peaks beyond these upper limits with respect to Lmax.
Inter-preting the angular error β, however, is more tricky. Indeed, unlike in the noiseless case where α is incremented of 1◦, in the noisy setting, the increment is 10◦ and β is less pre-cisely estimated and falls into intervals as displayed in Figure 2. Nevertheless, we can see that when the fODF peaks are
Lmax Angular Limit Angular Error
4 [50◦, 60◦] [3◦, 12◦] 6 [40◦, 50◦] [1◦, 10◦] 8 [30◦, 40◦] [3◦, 7◦] 10 [30◦, 40◦] [2◦, 7◦] 12 [30◦, 40◦] [3◦, 10◦] Table 3. Angular resolution limit in noisy setting.
10 20 30 40 50 60 70 80 90 Crossing angles [ ] 0 2 4 6 8 10 12 Angular error [ ] Noisy (step = 10 )
Fig. 2. Angular error from noisy data.
successfully detected, the angular error is yet less than 13◦ even at the lowest Lmax= 4.
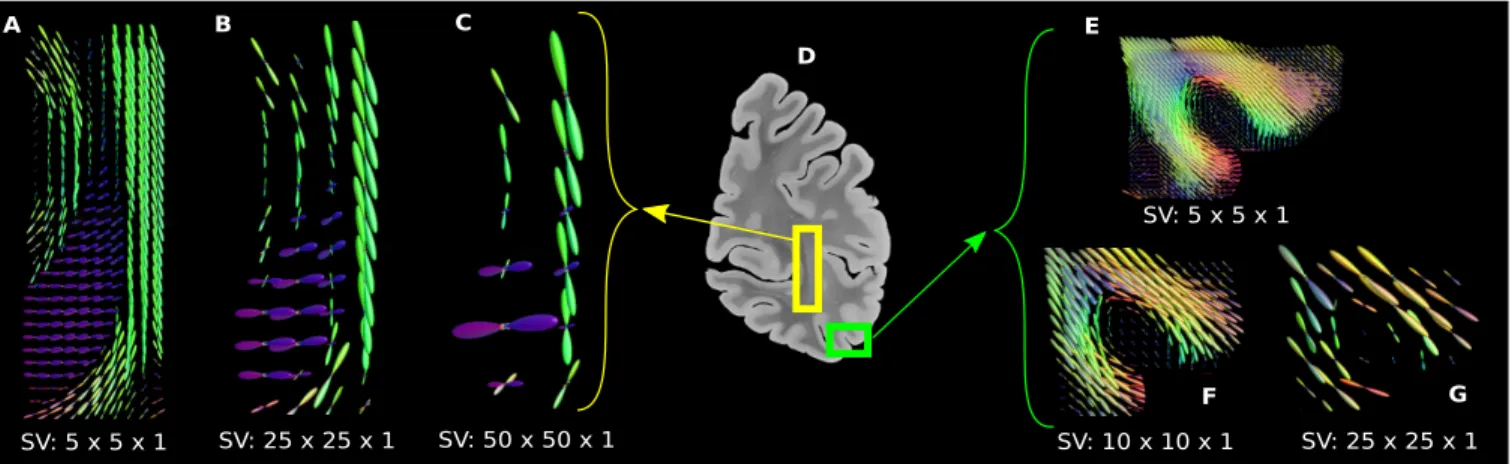
On human brain data The coronal brain slice, acquired and described in [13], was used to perform the computational running time test, and here, to illustrate reconstructed fODFs in Figure 3 at different spatial scales, by varying the SV size. This data consists of 1350 × 1950 × 1 native voxels. The region of interest (ROI) in yellow displays the stratum sagit-tale in deep white matter while the one in green shows fibers fanning into the cortex. In both ROIs, where the fiber struc-ture is well known, it can be observed that the anatomical organization is still conserved at different spatial resolutions. This demonstrates that the analytical approach preserves the integrity of the fiber architecture in the brain.
Note that in [10] we show the analytical approach outper-forms both pliODF and its regularized version however fur-ther comparisons could be carried out in future work.
4. CONCLUSION
In this paper, we assess the performance of the analytical fiber orientation distribution functions reconstruction method in 3D Polarized Light Imaging using both highly rich syn-thetic and human brain datasets, with considerable findings. First, the fODF is analytically described on a spherical har-monics basis and elegantly and efficiently computed via the spherical Fourier transform and by means of the Diracs. This makes the fODF computationally very efficient, very fast and less prone to angular error. Second, the recovered fODF
angu-SV: 25 x 25 x 1 SV: 50 x 50 x 1 SV: 5 x 5 x 1 SV: 5 x 5 x 1 SV: 10 x 10 x 1 SV: 25 x 25 x 1 D A B C E F G
Fig. 3. Fiber ODFs computed from a coronal slice of the brain’s right hemisphere.
lar resolution limit is high enough to allow resolving crossings even with very acute angles. Third, tests on noisy datasets show very little influence of the noise on both the angular limit and the angular error of the reconstructed fiber ODF, re-vealing thus that our method is robust to noise. Finally, our algorithm preserves, at different spatial scales, the integrity of the fiber architecture in the human brain.
5. REFERENCES
[1] Krause et al., “Jureca: Modular supercomputer at j¨ulich supercomputing centre,” Journal of large-scale research facilities JLSRF, vol. 4, pp. 132, 2018.
[2] Jouk et al., “Three-dimensional cartography of the pat-tern of the myofibres in the second trimester fetal human heart,” Anatomy and embryology, vol. 202, no. 2, pp. 103–118, 2000.
[3] Axer et al., “A novel approach to the human connec-tome: ultra-high resolution mapping of fiber tracts in the brain,” NI, vol. 54, no. 2, pp. 1091–1101, 2011. [4] Alimi et al., “Solving the inclination sign ambiguity in
three dimensional polarized light imaging with a pde-based method,” in Biomedical Imaging (ISBI 2017), 2017 IEEE 14th International Symposium on. IEEE, 2017, pp. 737–740.
[5] Tuch, “Q-ball imaging,” Magnetic resonance in medicine, vol. 52, no. 6, pp. 1358–1372, 2004.
[6] Descoteaux et al., “Regularized, fast, and robust analyt-ical Q-ball imaging,” Magnetic resonance in medicine, vol. 58, no. 3, pp. 497–510, 2007.
[7] Aganj et al., “Reconstruction of the orientation distribu-tion funcdistribu-tion in single-and multiple-shell q-ball imag-ing within constant solid angle,” Magnetic Resonance in Medicine, vol. 64, no. 2, pp. 554–566, 2010.
[8] Axer et al., “Estimating fiber orientation distribution functions in 3D-polarized light imaging,” Frontiers in neuroanatomy, vol. 10, 2016.
[9] Alimi et al., “Regularizing the ODF estimate with the Laplace-Beltrami operator in 3D Polarized Light Imag-ing,” CoBCoM 2017 - Computational Brain Connectiv-ity Mapping Winter School Workshop, Nov. 2017. [10] Alimi et al., “An analytical fiber odf reconstruction in
3d polarized light imaging,” in Biomedical Imaging (ISBI 2018), 2018 IEEE 15th International Symposium on. IEEE, 2018, pp. 1276–1279.
[11] Dohmen et al., “Understanding fiber mixture by simu-lation in 3d polarized light imaging,” NeuroImage, vol. 111, pp. 464–475, 2015.
[12] Menzel et al., “A jones matrix formalism for simulat-ing three-dimensional polarized light imagsimulat-ing of brain tissue,” Journal of The Royal Society Interface, vol. 12, no. 111, pp. 20150734, 2015.
[13] Schmitz et al., “Derivation of fiber orientations from oblique views through human brain sections in 3d-polarized light imaging,” Frontiers in Neuroanatomy, vol. 12, pp. 75, 2018.
[14] Kleiner et al., “Classification of ambiguous nerve fiber orientations in 3d polarized light imaging,” in In-ternational Conference on Medical Image Computing and Computer-Assisted Intervention. Springer, 2012, pp. 206–213.
[15] Wiese et al., “Polarized light imaging of the human brain: a new approach to the data analysis of tilted sec-tions,” in Polarization: Measurement, Analysis, and Re-mote Sensing XI. International Society for Optics and Photonics, 2014, vol. 9099, p. 90990U.