HAL Id: hal-02602514
https://hal.inrae.fr/hal-02602514
Submitted on 16 May 2020HAL is a multi-disciplinary open access archive for the deposit and dissemination of
sci-L’archive ouverte pluridisciplinaire HAL, est destinée au dépôt et à la diffusion de documents
To cite this version:
Sylvie Morardet, L. Kuhfuss, Robert Lifran. What do people want for the Vistre river? Using choice experiment to support an ordinary stream restoration project. 11th International conference of the European society for ecological economics:, Jun 2015, Leeds, United Kingdom. pp.36. �hal-02602514�
What do People Want for the Vistre River? Using Choice
Experiment to Support an Ordinary Stream Restoration
Project
S. Morardet1, L. Kuhfuss2 and R. Lifran3 1
UMR G-eau, Irstea, Montpellier, France 2
University of Saint Andrews, Department of Geography & Sustainable Development, UK
3
UMR Lameta, INRA, Montpellier, France
Abstract. This paper addresses the question of the relevance and usefulness of choice
experiment (CE) survey in accompanying a restoration project of an ordinary, coastal stream in the floodplain of the Vistre River, near Nimes (South of France). While flood control has been the main argument supporting early projects reshaping the Vistre river bed under the “Mastery over Nature” paradigm, this policy proved to be inefficient to avoid catastrophic flood events. Furthermore, considering the poor ecological status of the river, on-going restoration projects aim at integrating additional objectives like river ecosystem quality and access to that local environmental asset, in line with the “Room for river” ethics. In agreement with the local authorities, we performed a CE survey for assessing the public values attached to the restoration of the Vistre River basin, and understanding their preferences heterogeneity. A multinomial model with and without interaction between individual characteristics and restoration attributes, as well as a latent class model were estimated. Contrary to the expectations of main stakeholders, the results demonstrated that improvements in the quality of the river’s environment are more valued by local residents than flood control. Respondents’ ethics and confidence in the efficiency of the project management has a great influence on the heterogeneity of willingness to pay for restoration.
1 Introduction
After decades of rivers and streams management driven by the “Mastery over Nature” paradigm, there is now a growing trend towards restoration of natural functioning of aquatic ecosystems under the Dutch “Room for river” ethics (De Groot, 2012). This paradigm shift spreads through all European countries1. While it has been initiated few decades ago, it is currently
1
reinforced by two events occurring at the regulatory and at the scientific levels.
The Millennium Ecosystem Assessment put emphasis on the importance for the human well-being of the good functioning of ecosystems, because they provide a bulk of free services to the Society. As a consequence, restoration of degraded ecosystems could provide huge social benefits balancing the cost of restoration. Wetlands and aquatic ecosystems are among the most threatened ecosystems and as such, draw attention of authorities and various stakeholders.
The Water Framework Directive (WFD) enacted by the European Union states the objective of a “good ecological status” for all the rivers and water bodies by 2015, with some dispensation for the most altered water bodies. While objectives of the Directive are defined in ecological terms, the approach encompasses also socio-economic considerations (how the restoration does contribute to increase the social welfare). Meanwhile, the E.U observed the poor ecological status of many rivers in France, and enacted a list of sensitive areas, either for surface or groundwater bodies.
Our study addresses the question of the relevance and usefulness of choice experiment survey in accompanying a restoration project of an ordinary2, coastal stream in the floodplain of the Vistre River, near Nimes (South of France). While flood control has been the main argument supporting early projects reshaping the Vistre river bed under the “Mastery over Nature” paradigm, this policy proved to be inefficient to avoid catastrophic flood events. As a consequence, the design of new project should integrate additional objectives like water quality and access to that local environmental asset.
The relevance of our research for authorities in charge of implementing the restoration project does not lies mainly in its contribution to the global cost/benefit analysis of the project, because the restoration decision had been already taken at the time. The main interest arises from its contribution to the finer understanding of the public preferences heterogeneity and the identification of the interactions between attitudinal characteristics and the preferences in the restoration. As such, our study could support efficiently the project implementation (Buijs, 2009).
2
“Ordinary” means that they have no outstanding biodiversity character. Note that ordinary streams could be part of bigger catchment, in which case, their restoration could provide huge benefits downstream. Here, we are dealing with coastal streams and rivers flowing directly into the sea, not in another river’s reach, so as the benefits derived from the restoration have no spill-over effects on downstream users. The absence of spill-over facilitates the CBA because the target population is easier to identify, and the overall balance of the project is more precise.
Our research question is how and to what extent WTP are affected, beside projects characteristics, by respondents confidence in the efficiency of the project (I get what I paid for), and by respondents ethics (altruism versus egocentric values).
Two literature surveys on the rivers and aquatic ecosystems restoration plans have been published in 2012. The one of Schultz (Schultz et al., 2012) focuses specifically on the ecological indicators used to describe restoration project to respondents of stated preferences surveys. From 2006 onwards, they identified and reviewed 21 studies using 54 indicators overall. They found most indicators relevant for restoration, nevertheless, many of them do not meet minimal standard of measurability and interpretability. The largest group of indicators refers to biodiversity. In the same vein, Trabucchi et al. (Trabucchi et al., 2012) focus their review (1998-2010) on the integration of ecosystem services in restoration plans at the basin scale. They identified 45 studies on restoration at the basin scale, while only 13 made explicit reference to ecosystem services. Among them, the most popular are supporting and regulating services (respectively 8 and 3 references). Few papers are dealing with a bulk of several services.
More in-depth exploration of some papers illustrates those findings. For instance, while Perni et al. (Perni et al., 2012) focused on water quality improvements related to restoration measures, and the water bill as a payment vehicle, Zhai et al. (Zhai et al., 2007) focused on flood reduction, early warning systems, and environmental protection. Birol et al. (Birol et al., 2009) chose flood risk mitigation, biodiversity, riverbank access, and relative increase in the local tax as monetary attribute. Weber and Stewart, 2009) focused on fish and wildlife, vegetation density, tree type and natural river processes. In an attempt to prove the reliability of the benefit transfer method, Hanley et al. implemented several CE using the same restoration scenario. In one (Hanley, N. et al., 2006a) they proposed riverbanks status, aesthetic and appearance of the flow and biodiversity to describe the restoration. In another one, (Hanley, N.D. et al., 2006b), they included local farm jobs, biodiversity and river flow level. In both studies, they used water tax as a monetary instrument.
In France, Amigues et al., 2003) identified about forty studies on the economic valuation of benefits and damages related to water, including studies on groundwater resources. Over the last ten years, encouraged by the WFD, river basin managers and the ministry in charge of environmental issues have commissioned a number of new studies, especially regarding the services provided by wetlands3. However, valuation studies of French aquatic
3
Most of these studies are referenced in the EauFrance data base, managed by ONEMA (http://www.economie.eaufrance.fr/)
ecosystems in general, and river restoration in particular, reported in the academic literature remain very limited.
The most often valued services of water-related ecosystems in France include recreational (recreational fishing, walking, water sports) and support services (biodiversity, habitats), with a high number of contingent valuation studies, including those by Bonnieux et al., 1991; Amigues et al., 2002); Deronzier and Terra, 2006; Chegrani et al., 2007; Aulong et al., 2009), to cite a few. There is a general lack of studies on regulating services (flood attenuation, groundwater recharge, low flow replenishment, water purification). In relation with this, indirect market valuation techniques such as avoided damage costs and replacement costs remain underutilized (except for flood protection damages, see for example Erdlenbruch et al., 2008). Despite their potential for analysing multiple attributes of aquatic ecosystems and to explore preference heterogeneity, choice experiment (CE) studies of continental aquatic ecosystems are very rare in France (Westerberg et al., 2010; Katossky and Marical, 2011, Bouscasse et al., 2011a ; Bouscasse et al., 2011b). Except for the latter studies, most economic analysis of river ecosystems focused on few types of use or benefit. It is thus quite evident that we are still far to reach a stable state of the art and to have enough harmonized references to nurture reliable benefit transfer.
From that literature review, we conclude that literature still provides poor help to local decision makers because of i) the lack of accepted list of services provided by assets like ordinary creeks or rivers; ii) the heterogeneity of services and attributes considered in the surveys; iii) the heterogeneity of public preferences, often scattered among several users groups; iv) and the dominance of some users in the decision making process. Research still has to contribute to the creation of a standard and should investigate what factors are at stake in explaining the people preferences formation and impact on their stated WTP. The values attached to the restoration of ordinary, local streams, (without spill over on ecosystem services at larger scale) are still scarce. It is worth to enrich the databases for this type of environmental assets.
As a consequence, in agreement with the local authorities, we decided to perform one CE survey for assessing the public values attached to the restoration of the Vistre River basin.
The remainder of the paper is organised as follows: In Section 2 we present the study area. Section 3 presents the research design and the econometric model specification. Section 4 reports the results of the econometric analysis and discusses policy implications. Section 5 concludes the paper.
2 The case study: restoration of the Vistre River
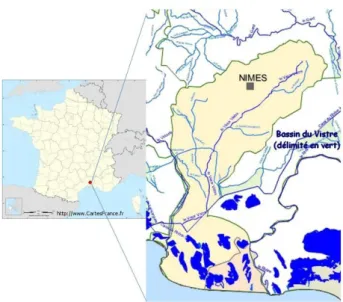
The Vistre River is a coastal Mediterranean stream, which basin spans over 580 km² in the Gard district, South-East of France. From its source north-east of Nîmes city to its outlet into the Rhône-to-Sète canal, its very flat course of 45km crosses three different landscapes: i) the Garrigues, a typical Mediterranean forested landscape, in the north, north-west, ii) the mixed urban-agricultural plain of Costières, in the mid part, and the Camargue Gardoise in the south, which includes wetlands hosting a rich biodiversity and grazing lands used for fighting bull breeding, an iconic activity of this region (Syndicat Mixte du S.C.O.T. du Sud du Gard, 2007) (Fig. 1).
Due to agricultural development and urban sprawl, the river basin has been highly developed over the second half of the twentieth century, which deeply modified its morphology. Former wetlands were drained by landowners associations through an important network of ditches to allow extension of agriculture. In parallel, rapid population growth (which increased by 70% between 1940 and 1990) led to urbanization of rural, often flood-prone, areas, with multiple consequences on the hydrological functioning of the basin: waterproofing of large areas in the midstream contributing to increased runoff, calibration of stream beds to drain water more quickly during flooding events, creation of dykes to protect downstream villages against floods, which also prevent draining of runoff water, abandonment of oxbow lakes, and destruction of riverine forests (only 19 % of the river bank is still forested) (SMBVV, 2008).
All these developments resulted in an increase in both frequency of flooding events and water speeds during flood periods, in a context characterized by flash floods. Flooding risk concerns 39% of the basin area and 55% of its population (SMBVV, 2007). Transformation of river streams has also degraded their ecological functions (water purification, habitats). This is compounded by multiple sources of pollutions (inefficient urban waste water treatment plants, industrial sites, wineries and agriculture). As a result, water quality is poor4 and the river is classified as a sensitive zone in relation to the Urban Waste Waters Directive and is identified as a priority area regarding eutrophication.
In this context, a joint association of local authorities (48 municipalities), the “Syndicat Mixte du Bassin-Versant du Vistre” (SMBVV) was created in 1998 with the objective to regulate floods and restore water and ecosystem quality. In order to achieve “good ecological status”, set in 2021 by the Water Framework Directive (SDAGE, 2009), the SMBVV has engaged three river
4
Information on the current river status is available on the Agence de l’Eau Rhône-Méditerranée website ( http://sierm.eaurmc.fr/geo-sdage/synthese-fiches.php?codeFiche=CO_17_21&typeFiche=SB#DocumentsAnnexes)
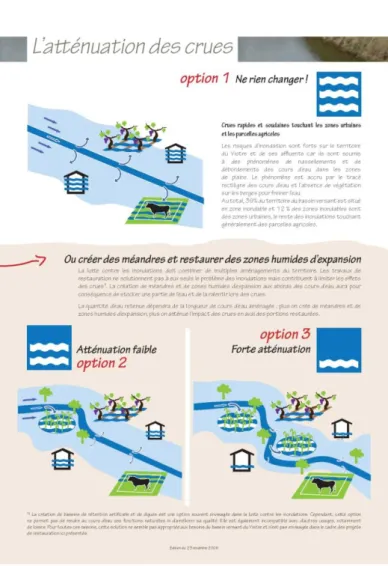
restoration pilot projects with the aim to decrease water flows during flooding events, reduce point and non-point pollution discharges and restore the river ecological functioning. More specifically, the projects consist in reshaping the river bed and re-creating oxbows to decrease water speed, re-building wetlands to store flood water and “treat” pollutions, softening river bank slopes and restoring the riparian vegetation to limit runoff, reduce proliferation of invasive aquatic plants and increase biodiversity (Fig. 2). A new and more important project is currently under study, with two different scopes.
The Vistre River is more infamously known for its floods and its bad quality than for its recreation amenities. Recreation uses are limited by the private property of river banks and poor quality of streams. A study on the perception of water and aquatic ecosystems by the local population5 showed that only 24% of inhabitants know the Vistre River, and only 12% visit it. 83% of respondents think that the river is of medium to poor quality. Nearly all surveyed persons find that improving river ecological status would be useful. Despite the poor knowledge of the rivers, the context seems favourable to river restoration project. However one can expect that the lack of patrimonial attachment of the population for these rivers will negatively affect the WTP for their restoration, all the more that only the older inhabitants have experienced their good ecological status.
5
The study was commissioned in 2009 to 3S Marketing to support the implementation of the SAGE Vistre, nappes Vistrenque et Costières. The survey was administrated to 400 inhabitants of the basin and concerned both surface and groundwater (3S marketing 2009).
Fig. 2. Aerial view of pilot restoration site of Bouillargues (Source: SMBVV)
3 Choice experiment design
In a CE survey, the environmental good to be evaluated is described using several characteristic attributes. One of these, the monetary attribute, represents what the respondent is ready to pay for the provision of the good. In our case, each attribute defining the river restoration project can take several levels, which randomly combined form the full choice set. During the CE survey, each respondent is requested to elicit his/her preferred scenario among two or more alternatives.
The experimental design chosen for this study was developed over several months and included interviews of key informants (19) from different segments of stakeholders to identify the relevant attributes, the elaboration of information sheets on the attributes, two series of focus group discussions to specify further the attributes and their levels, and to test a first version of the questionnaire, and a pilot survey administrated to 25 persons to finalize the choice of attributes and adjust attributes levels. Each step was discussed and validated by a steering committee comprising representatives of Agence de l’Eau Rhône Méditerranée Corse, SMBVV, SAGE Vistre nappes Vistrenque et Costières, Nîmes Métropole, Languedoc-Roussillon Regional Council, state technical administration in charge of agriculture and environment, and SCOT Sud Gard6. Their technical feedback was taken into account in the design of the questionnaire to address issues held by local stakeholders and support their decision process.
3.1 Attributes identification
Focus group discussions were organized both in the upstream and downstream parts of the basin to reflect a possible heterogeneity of population stakes towards river management (river quality upstream, recreation activities in the peri-urban area and flood protection downstream). Given the lack of notoriety of, and population attachment for the Vistre River, as demonstrated by former study, it was difficult to recruit simple citizens, and participants were mostly active members of civil society. However their diversity allowed for a rich discussion and brought responses to our design questions. The discussions concerned more specifically the most appropriate payment vehicle, the relevance of attributes and of their levels, the vocabulary and
6
A SCOT (Schéma de coherence territorial) is a document guiding spatial planning at meso level in France.
visual aids used to improve respondents’ understanding of the objectives of river restoration projects and of the meaning of attributes, and the quantity of information to be provided prior to the choice exercise. Focus group facilitation guidelines followed recommendations from Krueger and Casey, 2000, Morgan, 1997, and Loubier and Boutet, 2003.
The general conclusion of this consultation process was that most interviewed people welcomed the river restoration projects, but with different interests: water quality improvement was desired by all, but considered of secondary importance by residents in flood-prone areas whose main objective remains flood attenuation, and who in some cases expressed doubt about the cost-efficiency ratio of these projects. The benefit of the restoration in terms of recreational activities was mostly perceived from an urban dweller’s point of view. Three attributes were finally chosen: flood attenuation, quality of the river ecosystem and access and facilities for recreation activities. Table 1 summarizes the definition of the attributes and their levels.
Flood attenuation
The Vistre River basin has experienced two catastrophic and tragic flooding events in a recent past (1988, 2005), and many minor and more frequent ones. Therefore floods represent a sensitive issue for the basin population. Because present river restoration projects are intended to prevent only moderate floods and are not meant to protect against major events of the magnitude of those still present in the population memory, particular care was taken to describe this attribute. The formulation used in the information fact sheet referred to variables used by key informants to describe flood events: water heights, speed of water rise and drainage, importance of damages to buildings and transportation disturbances.
Focus group discussions highlighted the risk that some respondents determine their choice only on the basis of this attribute. To identify this potential bias we introduced a question in the third section of the questionnaire to detect lexicographic choices. An alternative would have been to replace this attribute with the length of restored river, but this attribute would have been highly correlated with the river ecosystem quality and less evocative for respondents.
River ecosystem quality
Water quality, biodiversity and landscape were identified as potential attributes of restoration plans. Based on key informant interviews, we finally defined the second attribute as the “river ecosystem quality”, which encompasses not only (chemical and biological) quality of water itself, but also the abundance and diversity of plant and animal species in the river bed and on the banks, and the associated landscape. This decision was motivated by several reasons: first, interviews revealed that water quality, biodiversity and landscape were closely inter-linked in the representation that key informants have of the rivers: presence of animal life in and around the
streams (fishes, frogs, birds and insects) was seen as an indicator of water quality. Water quality was also related to potential recreation uses such as bathing, fishing and consumption of captured fishes. Although drinking water quality appeared to be an important issue for the residents (3S-Marketing, 2009), there was a risk of misspecification of the valued good since river water is not used in the basin to supply drinking water to the population. Biodiversity was similarly discarded as an attribute mainly because the absence of emblematic animal species that could be an indicator of “good ecological status” complicated its description. Finally, because the Vistre basin landscape presents very different characteristics in its upstream and downstream parts, it appeared difficult to formulate an unambiguous definition of the landscape attribute.
Although some key informants proposed to describe levels of river quality with reference to the thresholds defined by the WFD, levels were specified to be of qualitative nature, on the ground that most people were not familiar with the WFD nomenclature. The focus group discussions and pilot survey later demonstrated that respondents found this formulation easy to understand.
Access and recreation facilities
For most key informants river restoration projects are considered as an improvement of the population living environment, especially for urban population. Type of development and facilities can vary with the targeted public: unsurfaced paths for familial walks or rides, picnic sites and benches, sporting courses, information boards for environmental awareness and education, nature trails, wildlife viewing areas, surfaced cycling lanes to encourage non-motorized daily mobility, or designated fishing and hunting areas. Focus groups participants underlined the trade-off between recreation activities and the potential degradation of the river ecosystem linked to its increased accessibility.
Focus group discussions revealed that there was dependence between access to the river banks and their possible use for recreation activities. It was therefore decided to bundle them as a single attribute, and to eliminate unrealistic combinations (e.g. no access and recreation facilities). The type of facilities (picnic sites or nature observation sites) was not included as a level since it would have unnecessarily complicated the formulation of this attribute. This is the object of a specific question in the third section of the questionnaire.
Payment vehicle
Current river restoration projects are expected to be financed mainly by local authorities of the basin, which are partly funded by local taxes (e.g., housing tax, property tax), and to a lesser extent by the Water Agency, which collects an abstraction fee included in the water utility bill. The chosen payment vehicle was an increase in the housing tax paid by the household over a certain (unspecified) period of time. Although not all households are
paying housing tax, this payment vehicle was preferred over an increase in water utility bill since focus group discussions showed that participants did not identify the Water Agency as a major player in river restoration and were more confident in the capacity and willingness of local authorities (compared to water utility companies) to contribute to the restoration projects. Similarly, voluntary donation was discarded since households may have the incentive to free ride with this form of payment (Whitehead 2006 cited by Birol et al., 2009). Answers to an open question on willingness to pay for the project included in the focus group discussions and pilot survey allowed specifying the range of payment levels. An exponential progression was chosen to include high WTP. Information on river restoration costs, average housing tax and water utility bill in the region was appreciated by focus group participants. However the study steering committee recommended mentioning only information about restoration costs in the final questionnaire arguing that housing tax and water utility bill are compulsory payments and are not of the same nature as WTP we sought to estimate.
3.2 Experimental design
A D-efficient fractional factorial design was selected among the full factorial design of 225 scenarios7 using a SAS procedure (Kuhfeld, 2000). 60 alternatives were paired into 30 choice sets distributed in three separate blocks of 10 choice sets. Based on focus group tests of the questionnaire and a pilot survey, a number of 10 successive choices appeared to be acceptable for respondents. The design procedure took into account the two-ways interaction effects between attributes. We drew several efficient designs of 30 choice sets and selected the set that displayed a minimal number of dominant choices and unrealistic scenarios. Swapping procedure suggested by Zwerina et al., 2010 was used to avoid implausible combinations in the final design. A status quo alternative, representing the current situation of the Vistre River (poor river quality, no flood attenuation, no access nor recreational facilities) and entailing no financial contribution, was added to each choice set. This inclusion is recommended so that welfare estimates are consistent with demand theory (Louviere et al., 2000). An example of a choice set is presented in Fig. 3.
7 Respectively 3 x 3 x 5 x 5 levels for the flood attenuation, river ecosystem quality, access and
facilities, and financial contribution attributes. The monetary attributes has only 5 levels here since the status quo level (0€) was not included in the design.
15. PRESENT STATE
CHOICE A CHOICE B
River stream quality
Low quality Low quality Medium quality
Flood attenuation
No change Low flood
attenuation
High flood attenuation
Accessibility No access Continuous
access No access Facilities No facilities Leisure and wildlife observation facilities No facilities Increase in housing tax 0 € 8 € 20 €
Y
OUR CHOICE□
□
□
Table 1: Attributes definition, levels and variable names
Attributes Description Levels Variable name
and coding Flood
attenuation
Fighting against floods entails the combination of several types of management solutions. River restoration alone cannot solve flood problems but contributes to limiting undesirable effects of flooding. Creating oxbows and wetlands around river streams will help storing part of runoff water and reducing its velocity during flooding events. The amount of water that can be stored will depend on the scope of the restoration: the higher the length of restored river the lower the impacts of floods downstream. No change Low flood attenuation CRUES1, coded 1 if flood attenuation is low and 0 otherwise High flood attenuation CRUES2, coded 1 if flood attenuation is high and 0 otherwise River stream quality
River quality depends on a number of factors: water quality, environmental quality of river banks and river beds (morphology, vegetation). In turn, river health has an impact on the number of animal species it can host.
River health depends on the scope of the restoration projects. The larger the restored area, the richer the plant diversity, the healthier the river, and the more numerous and diversified animal species are.
Poor quality
Medium quality QUAL1, coded 1 if river quality is medium and 0 otherwise High quality QUAL2, coded 1
if river quality is high and 0 otherwise Access and recreation facilities
Pathways will be created to give access to maintenance team along the restored river banks. These paths can be open or not to the public: forbidding access would help preserving river ecosystems and plant and animal species.
Facilities enabling recreation activities (picnic and nature observation sites) can be implemented in accessible sites.
No access, nor facilities Limited access, without facility ACCAM2, coded 1 if access is limited without facilities Limited access with facilities ACCAM3 Continuous access, without facility ACCAM4 Continuous access with facilities ACCAM5 Increase in housing tax
Each scenario, except for the current situation (status quo) is associated with a durable increase in the housing tax so that it can be implemented (amount in Euros per household and per year)
0€, 4€, 8€, 20€, 50€ and 100€
CONTRIB coded as a continuous variable
3.3 Survey design and administration
The target population was defined as all inhabitants over 18 years old of the 48 municipalities composing the area of SMBVV (around 208,400 persons, grouped in 110,700 households, based on the 2008 population census8). This choice was justified by the fact that the restoration projects are undertaken by SMBVV, which involves that all residents are expected to financially contribute to the projects.
The survey was administrated to 392 individuals by six professional interviewers who approached them randomly in the street or in their homes between April and August 2010, using face to face interviews. The survey area was divided in 6 zones corresponding to different types of settlement, landscapes and river related issues. Quotas of respondents with specific socio-demographic characteristics (age, gender, socio-professional categories) were defined in each zone on the basis of the 2008 population census (Institut National de la Statistique et des Etudes Economiques (INSEE), 2008).
The questionnaire comprised four sub-sections. The interview started with a short presentation of the context and objectives of the survey illustrated by a map of the river basin. Subsequently, respondents were asked about their knowledge and use of the Vistre River and other rivers in the region, their perception of their current state and their experience of flooding events. The second section dealt with the choice experiment itself. It was introduced by a description of the restoration project and their potential effects using pictures of restored and non-restored sections of the river. Information on implementation costs and financing scheme was also provided. Information sheets describing in detail the attributes and their levels, elaborated from the results of the key informant interviews, were provided to interviewees. As recommended by Adamowicz, Wiktor et al., 1998), the sheets used visual aids to increase respondents’ understanding of attributes and reduce bias related to heterogeneity of interpretation (see Fig. 4 for an example of such a sheet). Apart from the financial contribution, each attribute level was represented by an icon, which was then used in the choice card to ease quick comparison of the proposed alternatives. Respondent were then requested to choose their preferred alternative among three restoration plans (including the status quo) in ten choice sets. Only a limited number of respondents did not complete the ten choices. This section of the questionnaire ended with an open question on the individual ideal restoration plan.
The third section of the questionnaire aimed at checking the reliability of choice responses and analysing heterogeneity of preferences. In order to determine attitudes towards the protection of environment in general and river
8
restoration and use in particular, the respondents were asked a number of attitudinal questions, inspired by the New Ecological Paradigm Scale (Dunlap et al., 2000) and the Ecological Consciousness Index (Birol et al., 2006). For each question, the responses were collected on a five point Likert scale ranging from strongly agree (1) to strongly disagree (5). The questions concerned respondents’ perception of restoration projects (objectives, confidence in project effectiveness, proposed payment vehicle), and choice motivations (types of values placed on rivers, general attitude towards environment). Some of them allow identifying the existence of lexicographic choices, which is important in this case where the flood attenuation attribute could be the only choice criteria for some individuals. The questionnaire ended up with the collection of the usual socio-demographic characteristics of the respondents and their households. This included the annual value of local tax paid by the household9. Each interview lasted between 30 and 40 min.
9
(Design: Jean-Michel Fatou, Irstea)
Fig. 4. Example of an information sheet for the flood attenuation attribute
3.4 Multivariate data analysis
Responses to the survey statements regarding the restoration projects and general attitude about environmental issues were analysed using multivariate data analysis techniques. Two principal components analysis were undertaken: the first one on individual opinion regarding the river restoration projects and roles of rivers; the second on individual attitude regarding environmental issues. The survey statements and factor loadings for each statement are reported in Table 2 and Table 3 for the two PCA. Two
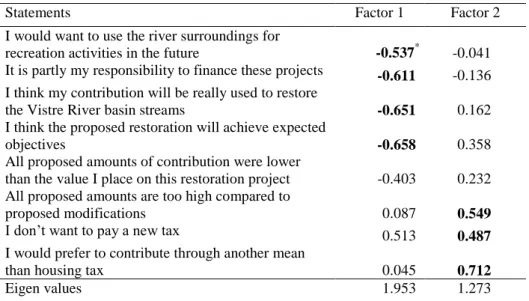
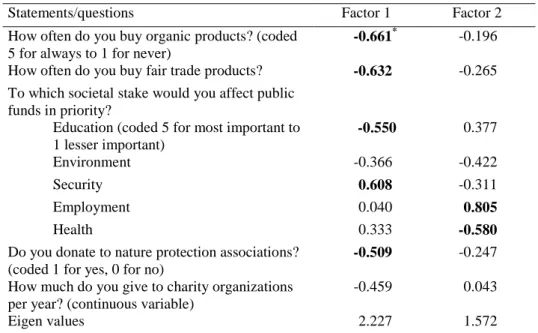
attitudinal factor components were identified based on the results of each PCA. The first factor of PCA on attitude about restoration projects (factor 1, Table 2) was labelled “confidence in the project” (CONFPROJ) and the second factor was labelled “opposition to payment” (OPPAY). Individual factorial coordinates on factors 1 and 2 were used as an index measures for CONFPROJ and OPPAY. A higher negative value for CONFPROJ indicates higher confidence in the project; a higher positive value for OPPAY indicates a stronger opposition to the proposed payment scheme. The first factor of PCA on attitude about environmental issues (factor 1, Table 3) was labelled “priority 1” (PRIO1), and the second factor was labelled “priority 2” (PRIO2). Individual factorial coordinates on factors 1 and 2 were used as index measures for PRIO1 and PRIO2. A higher negative value for PRIO1 indicates stronger pro-environmental attitude; a higher positive value for PRIO2 indicates a greater concern for employment issues and a higher negative value, a greater concern for health issues.
Table 2: Principal component analysis of attitude statements about river restoration projects
Statements Factor 1 Factor 2
I would want to use the river surroundings for
recreation activities in the future -0.537* -0.041 It is partly my responsibility to finance these projects -0.611 -0.136 I think my contribution will be really used to restore
the Vistre River basin streams -0.651 0.162
I think the proposed restoration will achieve expected
objectives -0.658 0.358
All proposed amounts of contribution were lower
than the value I place on this restoration project -0.403 0.232 All proposed amounts are too high compared to
proposed modifications 0.087 0.549
I don’t want to pay a new tax 0.513 0.487
I would prefer to contribute through another mean
than housing tax 0.045 0.712
Eigen values 1.953 1.273
*
Table 3: Principal component analysis of attitudes about environmental issues
Statements/questions Factor 1 Factor 2
How often do you buy organic products? (coded 5 for always to 1 for never)
-0.661* -0.196
How often do you buy fair trade products? -0.632 -0.265 To which societal stake would you affect public
funds in priority?
Education (coded 5 for most important to 1 lesser important) -0.550 0.377 Environment -0.366 -0.422 Security 0.608 -0.311 Employment 0.040 0.805 Health 0.333 -0.580
Do you donate to nature protection associations? (coded 1 for yes, 0 for no)
-0.509 -0.247
How much do you give to charity organizations per year? (continuous variable)
-0.459 0.043
Eigen values 2.227 1.572
*
Bold denotes the statements that were identified as a component of each factor
3.5. Econometric specification
The CE approach has its theoretical foundations in Lancaster’s consumer theory and in Random Utility Theory (RUT). Lancaster’s consumer theory stipulates that the utility provided by a good can be broken up into the sum of the utility provided by each of its attributes (Adamowicz, Wiktor et al., 1998). Utility may be influenced as well by consumer’s individual characteristics (both socioeconomic and attitudinal). Under RUT, the utility U that an individual n derived from alternative i comprises an observable component Vni and an unobservable stochastic component εni (Adamowicz, W. et al., 1998), and is expressed as follows:
ni ni ni
V
U
(1)Incorporating the Lancaster’s consumer theory, it follows that the individual n’s utility provided by alternative i can be expressed as:
,
,
ni ni i n i n
U
V
X Z
X Z
(2)Where Xi is a vector of alternative i’s attributes, and Zn a vector of individual n’s socio-economic characteristics (Hanley et al., 1998). The
probability that an individual n chooses the alternative i among a given set of proposed alternatives C is expressed as:
i
C
Pr
V
ni
ni
V
nj
nj,
j
C
Pr
(3) Where 1 1 K A in ik ik an an k a V
x
z
, βik being the vector of parameters to be estimated, Xn the vector of observable attributes k of the alternatives (k=1,…,K) and Zn the vector of A observable and individual respondent characteristics (a=1,…,A). The choice of econometric model depends on assumptions regarding the distribution of error terms (ε).In the basic multinomial logit (MNL, also named conditional logit) used in this study, the utility function is linear and the random components are assumed to be independently and identically distributed (IID), and following a Gumbel distribution (Louviere et al., 2000). The expression of this basic MNL model is: ' ' exp( ) ( ) i in j j C X P exp X
(4)The implication of IID is that the probability ratio of two alternatives depends only on the characteristics of these two alternatives (independence of irrelevant alternatives, IIA). Indeed, as respondent’s characteristics Zn are invariant through choices, they do not appear in the choice probability. To introduce respondent heterogeneity of preferences in the MNL formulation, socioeconomic variables enter the utility function as independent variables, interacting with alternative attributes, since they are constant across choice situations for any given respondent. When the IID assumption is violated, MNL estimates may be biased. Nested logit, random parameter logit and latent class models detailed in Louviere et al., 2000, Hensher et al., 2005 and Boxall and Adamowicz, 2002 respectively, have been proposed to relax the IID hypothesis.
The use of a latent class (LC) model, derivative of the MNL model, allows to partially relax the IID assumption on error terms and to take into account the existence of taste heterogeneity. In LC models, the population is segmented in S ‘classes’. Members of a segment s, s=1,…,S are assumed to have the same preference parameters vector 𝛽𝑠, and error terms are IID within each segment, but not identically distributed between segments. Then, for each segment s, the probability that individual n chooses alternative i, knowing that he belongs to s is:
𝑃𝑖𝑛|𝑠= exp(𝛽𝑠′ 𝑋𝑖)
∑𝑗∈𝐶exp(𝛽𝑠′ 𝑋𝑗)(5)
We consider an unobservable membership likelihood function M* that classifies individuals into one of the S segments. M* can be expressed as
𝑀∗= 𝜇
𝑠∙ 𝑍𝑛+ 𝜏𝑛𝑠,𝑠 = 1, … , 𝑆 (6)
Where Zn is a vector of both socio-economic characteristics and psychometrics constructs for the individual n, µs is a vector of parameters and τns a vector of error terms. As in the multinomial logit model of the utility function, the error terms are assumed to be independently distributed across individuals and segments with a Gumbel distribution. Assuming the scale factor equal to 1, it derives that the probability of membership of individual n in segment s is characterized by:
Π𝑛,𝑠 = 𝑒𝑥𝑝(𝜇𝑠∙𝑍𝑛)
∑𝑆𝑠=1𝑒𝑥𝑝(𝜇𝑠∙𝑍𝑛)) (7)
And for any individual n of the sample:
' , , ' 1 ,
exp(
)
exp(
)
S i s i in n s s j s j j CX
P
X
(8)Latent class models have been applied to estimate wetland values by Birol et al., 2006; Milon and Scrogin, 2006; Birol et al., 2009. In this study, three different models were estimated: i) a multinomial logit model (MNL base) using only attributes as dependent variables; ii) a multinomial logit model incorporating interactions between attributes and individual characteristics of respondents (MNL ind); and iii) a latent class model. MNL models were estimated using the mlogit package in R software (Croissant, 2011 10) and the latent class model was estimated using Stata (Pacifico, 2012). The list of individual characteristics considered in the second MNL model (MNL ind) and in the latent class model is given in Table 4.
10
Table 4: Definition of individual characteristics and expected effect on utility
Variable Description Expected
sign of coefficient Amont, Plaine, Nimes, Aval, Moyen, Vaunage
Dummy variables coded 1 if the individual resides in the corresponding zone, 0 otherwise
+/-
ZIYES Coded 1 if the individual resides in flood-prone area, 0 otherwise
+
ZINSP Coded 1 if the individual does not know whether his/her house is located in flood-prone area , 0 otherwise
+/-
Inon1, Inon2 Coded 1 if the individual has experienced one flooding event (respectively 2 or more), and 0 otherwise
+
CONN Coded 1 if the individual knows the Vistre River and its tributaries before the survey, 0 otherwise
+
FREQ Coded 1 if the individual visits the Vistre River or its tributaries, 0 otherwise
+
CONFPROJ Factorial coordinate on the first factor of the PCA on attitude towards restoration projects: high negative values indicate strong support and confidence in the projects
-
OPPAY Factorial coordinate on the second factor of the PCA on attitude towards restoration projects: high positive values indicate a strong opposition to payment
-
PRIO1 Factorial coordinate on the first factor of the PCA on attitude towards environment and policy priorities : high negative values indicate a favourable attitude towards environment, high positive values indicate priority given to security issues
-
PRIO2 Factorial coordinate on the second factor of the PCA on attitude towards environment and policy priorities : high positive values (respectively negative) indicate priority given to employment issues (resp. health issues)
?
4 Results
In total, 392 respondents were interviewed. Table 5 summarizes the descriptive statistics of the sample, a sub set of respondents who systematically chose the status quo across all choice sets (named “pro status quo”), and the Vistre basin population, for a set of characteristics. Based on
the available statistics from the national population census (INSEE 2008), the social and economic characteristics of the sample are similar to those of the total population of the Vistre River basin, in terms of gender, age distribution, location of residence and socio-professional categories.
36 respondents (9% of the sample) systematically chose the status quo alternative across all choice sets. The status quo supporters differ from other respondents by their lower level of income and education, but there is no significant difference in terms of family situation (gender, marital status, number of children). Although the proportion of people knowing and visiting the Vistre River is lower among the pro-status quo, the differences are not significant. On the other hand, there is a significantly larger proportion of status quo supporters who would not agree to allow a higher share of public expenditures to river restoration projects, even if their housing tax is not increased. This indicates a real opposition to the projects, at least for part of them. Their rejection of the projects can be explained by a lack of confidence in the restoration effectiveness and project cost-efficiency and in the lack of trust in the use of tax revenue.
4.1 Parametric analysis
4.1.1 Multinomial logit model with attributes only (MNL base)
Overall a total of 3894 choices were elicited from 390 individuals11. The overall fit of the MNL base model as measured by the adjusted McFadden’s ρ2 of 0.18 is satisfactory by conventional standards (Ben-Akiva and Lehrman, 1985). Results of the model estimation reported in the first column of Table 6 show that all coefficients, except for ACCAM2 and ACCAM4, are significant at less than 1% level and have the a priori expected sign. This means that all river restoration attributes (except improved access to river banks without recreational facilities) are significant factors in the choice of river restoration scenarios. The positive sign of the ASC coefficient (StatuQuo) seems to imply that a move away from status quo would decrease utility from restoration scenario. However this coefficient is significant only at 5% level. As expected, the sign of the financial contribution coefficient indicates that the utility of choosing a given scenario of river restoration decreases with higher levels of contribution.
11 One questionnaire was discarded because of a high number of missing responses, another one
because the respondent completed only one choice. 4 respondents completed only 9 choices, and one completed only 8 choices.
Table 5: Descriptive statistics of the respondents
Variable Sample Pro status
quo
Population (a)
Social and economic characteristics
Gender (% female) 53.6% 58.3% (ns) 53.0%
Age distribution
< 35 years 28.3% 22.2% (ns) 25.0%
> 65 years 12.5% 16.7% (ns) 22.5%
Household size 2.6 2.8 (ns) 2.3
Children (% with children) 63.0% 77.8% (.) Dependent children (% with dependent children) 35.7% 55.6% (**) Education (% with university degree) 26.5% 22.2% (ns) Income distribution <15000€/year >39000€/year 33.4% 16.1% 50.0% (*) 11.1% (*) Housing tax
% liable to housing tax
Average amount (€/year) for liable households 83.9% 930€ 88.9% (ns) 906€ (ns)
Social and attitudinal characteristics used in models
Lives in a flood-prone area % yes
% does not know
29% 11%
25% (ns) 13.9% (ns) Experience of inundations
% without experience of inundation
Average number of flooding events (including those without)
63% 1.1
66.7% (ns) 0.6 (ns) Prior knowledge of Vistre river (%) 87% 80.6% (ns)
Visit to Vistre river (%) 46% 33.3% (ns)
Sample size 392 36
(a) Source: INSEE 2008 National Population Census, http://www.recensement-2008.insee.fr/
(***) denotes significance at 0.1% level, (**) denotes significance at 1% level, (*) denotes significance at 5% level, (.) denotes significance at 10% level, (ns) non-significant
The relative values of coefficients reveals that the most important attribute is river ecosystem quality, followed by flood attenuation, with improved access and recreational facilities being far less important in the elicitation of restoration scenarios. The difference between the coefficients related to various levels of river ecosystem quality and flood attenuation suggests that, for both attributes, the effects of changes are not linear across levels and that respondents value more the move from the current situation to an intermediate level than a further improvement to a higher level. A Log-likelihood ratio test comparing this model with another model where river quality and flood attenuation are specified as continuous variables showed the superiority of the specification of these two attributes with dummy coding. Finally the comparison of the relative values of coefficients for the access and facilities attributes indicates that the presence of recreational facilities is more
important for respondents than the fact that access to the river is continuous or not. Overall, these results show that positive and significant economic values exist among the surveyed population for river restoration projects.
4.1.2 Multinomial logit model including individual characteristics (MNL ind)
The MNL base model only takes into account restoration scenario attributes as explanatory variables. The first approach to detect sources of observed preference heterogeneity is done in MNL ind by including variables constructed as interactions between respondent-specific characteristics and choice specific attributes. Several specifications of the model testing various interactions of the respondents’ demographic, socio-economic and attitudinal characteristics with the scenario attributes allowed the identification of the significant interaction effects.
Other tested individual characteristics, which demonstrated no significant interactions with the scenario attributes, include prior knowledge of the Vistre river basin, payment of housing tax and its current amount, and two synthetic indicators of demographic and socio-professional characteristics12. A model including the residence area interacting with the payment attribute indicated a significant effect on the choice probability, negative for residents of the central, more urbanized, part of the basin and positive for the downstream residents more likely to suffer from flooding. This variable was not retained ultimately in the MNL ind model as it was correlated with other individual characteristics used in this model (past visit to Vistre river, residence in flood-prone area and some of the attitudinal characteristics).
As not all households in the sampled population are liable to housing tax, there was a possibility of free riding behaviour during the choice experiment (i.e. respondents choosing an alternative associated with a strictly positive contribution while they are not paying the tax). To test for this potential effect, the payment of housing tax was included as an explanatory variable in two different ways: i) dummy variable indicating whether or not the respondent household is liable to the tax; ii) and ratio of financial contribution over current amount of housing tax. Both variables were introduced in the MNL model in interaction with the payment attribute. No significant effect was found in both cases, from which one can reasonably conclude that free riding behaviour has no impact on individual preferences.
Finally, the MNL ind model includes the individual specific variables found to have the most significant effect on choice probability: past visit to Vistre basin streams interacting with river ecosystem quality, the number of
12
These indicators were elaborated on the basis of two multiple factorial analysis (MFA) performed on two sets of demographic and socio-professional variables (respectively) followed by two cluster analysis. Each respondent was then assigned to one of 5 demographic groups and one of 7 socio-professional groups.
flooding events experienced and the residence in flood-prone area interacting with flood attenuation, confidence in the project outcomes and payment scheme, opposition to payment, and priorities in the use of public funds, all interacting with the financial contribution. Results of the estimation are displayed in the second column of Table 6.
The model fit improves compared with MNL base with an adjusted McFadden’s ρ2
of 0.28. This is confirmed by the Log-likelihood ratio-test and the Wald test, which show that accounting for interactions between individual characteristics and river restoration attributes improve the overall quality of the estimated model13.
As with the previous model, the river quality and flood attenuation attributes have highly significant effects; improved access to rivers without recreational facilities has no significant impact on choices. The status quo specific constant becomes non-significant. Most interactions with individual characteristics are significant and have the a priori expected sign. While present use of the river influences positively the choice of alternative with intermediate level of river quality, its interaction with higher level of river quality is insignificant. The experience of one or more than two flooding events has a highly significant impact on the selection of restoration scenarios leading to the highest level of flood attenuation whereas its interaction with the lowest level is insignificant. Three of the individual attitudinal characteristics (confidence in the project, opposition to payment and priority given to health and employment issues) are highly significant. Unexpectedly, the interaction between a pro-environment attitude and the payment attribute is not significant.
However, a Hausman test (Hausman and MacFadden, 1984) shows that the IIA assumption on which MNL models rely is not valid in our data.14 This is likely to be originated by the heterogeneity of individual preferences in the sample. As explained in the econometric specification section (section 3.5), we use a latent class model to take into account this issue.
13
As MNL base and MNL ind were not estimated on the same subset of choice experiences due to missing values for some individual specific variables, the tests compared MNL ind with a simple MNL estimated on the same dataset.
14
The Hausman tests we implemented compare the coefficients obtained through a MNL model on the full dataset (MNL base) and successively 2 different subsamples: first after the suppression of all alternatives A and choice cards where alternative A was selected (test of differences in coefficients shows a Prob>chi2 < 0.001) and then after the suppression of all alternatives B and choice cards where alternative B was selected (test of differences in coefficients shows a Prob>chi2 < 0.001). These tests both lead to the rejection of the null hypothesis of non-systematic differences in coefficients.
Table 6: Parameter estimates for multinomial logit models
Parameters MNL base MNL ind
Coef. St. dev. Coef. St. dev. Contrib -0.026 (0.001) *** -0.034 0.001 *** StatuQuo 0.273 (0.130) * 0.199 0.139 QUAL1 0.964 (0.082) *** 0.878 0.095 *** QUAL2 1.353 (0.082) *** 1.339 0.095 *** CRUES1 0.610 (0.055) *** 0.580 0.066 *** CRUES2 0.754 (0.092) *** 0.575 0.107 *** AccAm2 0.125 (0.086) 0.121 0.091 AccAm3 0.293 (0.101) ** 0.244 0.108 * AccAm4 0.150 (0.096) 0.139 0.103 AccAm5 0.280 (0.092) ** 0.242 0.098 * I(Freq * QUAL1) 0.204 0.104 * I(Freq * QUAL2) 0.127 0.101 I(ZIYES * Contrib) 0.006 0.002 *** I(ZINSP * Contrib) 0.011 0.003 *** I(Inon1 * CRUES1) 0.367 0.123 ** I(Inon1 * CRUES2) 0.469 0.166 ** I(Inon2 * CRUES1) 0.175 0.129 I(Inon2 * CRUES2) 0.671 0.171 *** I(CONFPROJ * Contrib) -0.010 0.001 *** I(OPPAY * Contrib) -0.005 0.001 *** I(PRIO1 * Contrib) -0.001 0.001 I(PRIO2 * Contrib) -0.004 0.001 *** Final Log-likelihood -3498.8 -3066.9 Pseudo R2 0.1821 0.2831 Number of observations 3894 3604 Number of individuals 390 361
*** denotes significance at 0.1% level, ** denotes significance at 1% level, * denotes significance at 5% level, . denotes significance at 10% level
4.1.3 Latent class model (LCM)
The analysis of LCM comprises three steps: i) the determination of the optimal number of segments; ii) the characterization of the segments and iii) the comparison of the models for all the segments.
To determine the optimal number of segments several LCM models with an increasing number of segments are estimated and compared on the basis of statistical criteria reported in
Table 7. The log-likelihood and ρ2 improves as more segments are added, supporting the idea of multiple heterogeneous segments in the sample. However, an increase in the number of segments is also associated with a loss
in the strength of individual probability of membership to a specific segment. The exception to this is the 5-segments model with which individuals have on average a higher probability of segment membership than the 4-segments models. However, its increased complexity in terms of interpretation of results supports the choice of a 4-segments model.
Table 7: Criteria for identifying the optimal number of segments
Number of segments Log-Likelihood (LL) ρ2 AIC BIC Average segment membership probability 1 -3498.76 0.1821 7017.538 7091.197 - 2 -2656.36 0.3791 5312.82 5312.82 98.2 % 3 -2389.01 0.4416 4778.02 4778.02 95.4 % 4 -2300.47 0.4623 4600.95 4600.95 91.3 % 5 -2201.31 0.4854 4402.61 4402.61 93.4 %
AIC (Akaike Information Criterion) is -2(LL-P); BIC (Bayesian Information Criterion) is – LL+(P/2)*ln(N)
The results of the 4-segments LCM are reported in Table 9. The first part of the table displays the parameters of the utility functions and the second part the parameters of the membership functions. The latter are normalized to zero for the first segment in order to identify the remaining coefficients of the model. The descriptive statistics of the membership variables for each segment are reported in Table 8.
In the utility functions, parameters of the tax attribute are negative for all segments as expected, with segment 2 and 3 displaying higher marginal utility of revenue.
Individuals with prior knowledge of the river have a higher probability of belonging to segment 2, 3 or for. The next paragraphs will describe how these 3 segments differ.
Segment membership coefficients reveal that respondents visiting the river, but with low confidence in the project efficiency, strong opposition to payment, low exposition to flooding events, and giving priority to security and employment issues are more likely to belong to segment 2. Accordingly, the utility coefficients reveal a strong bias towards status quo, with the highest coefficient across all segments. Members of this segment attach as much important to high levels of river quality and high levels of flood attenuation as the coefficients for these attributes are in the same positive range. However, low level of flood attenuation and all levels of access and recreational facilities, except for the highest one, are insignificant determinants of choice.
Table 8: Profiles of respondents belonging to the 4 segments in LCM
Segment 1 Segment 2 Segment 3 Segment 4
n=84 n=47 n=108 n=121
mean sd mean sd mean sd mean sd
Prior knowledge 0.833 0.373 0.851 0.356 0.880 0.326 0.909 0.288 Visit to Vistre River 0.429 0.495 0.340 0.474 0.333 0.471 0.461 0.499 Flood prone area: yes 0.262 0.440 0.213 0.409 0.305 0.460 0.380 0.485 Flood prone area:
unknown 0.060 0.237 0.128 0.334 0.046 0.210 0.182 0.386 Inundation number 0.893 3.444 0.617 1.043 0.518 0.887 1.862 6.446 Confidence in project -0.298 1.221 1.256 1.266 0.450 1.212 -0.735 1.207 Opposition to payment -0.310 1.024 0.405 1.097 0.397 1.071 -0.260 1.016 Security versus Environment -0.311 1.352 0.609 1.432 0.210 1.362 -0.254 1.603 Employment versus Health 0.210 1.319 0.103 1.121 0.141 1.240 -0.298 1.211 Plaine 0.107 0.309 0.106 0.308 0.111 0.314 0.058 0.234 Nîmes 0.631 0.483 0.617 0.486 0.537 0.499 0.505 0.500 Midstream 0.071 0.258 0.064 0.245 0.093 0.290 0.082 0.275 Downstream 0.060 0.237 0.064 0.245 0.074 0.262 0.148 0.355 Vaunage 0.000 0.000 0.043 0.202 0.065 0.246 0.058 0.234 All variables present significantly different means across the segments
For segment 3, contrary to segment 2, the utility coefficients reveal a bias for moving away from status quo (negative coefficient). As for segment 2, membership coefficients reveal that prior knowledge of the river, distrust in the project efficiency, opposition to payment, and giving priority to security and employment issues increase the probability of respondents to belong to this segment. Though, segment 3 members differ from segment 2 by the fact that they do not presently visit the river. Coefficients for river quality and flood attenuation are all positive and significant. Interestingly these respondents prefer intermediate levels for both attributes, rather than higher levels. The presence of recreational facilities does not influence significantly their choice, and improved access to river tends to decrease slightly their utility of restoration scenarios.
Contrary to segments 2 and 3, confidence in the project efficiency, acceptation of payment, and giving priority to environment and health issues increase the probability that respondents belong to segment 4. High exposition to flooding, and even more, the fear of being exposed, as well as living in the downstream part of the basin, highly increase the likelihood of belonging to this segment. As for segment 3, segment 4 utility coefficients reveal a strong bias against status quo (with the highest negative value of coefficient). However, contrary to the previous segment, any improvement in river quality or flood attenuation influence positively and significantly the choices. The hierarchy between attributes coefficients is similar as in the MNL base model
and reveals a preference for river quality, over flood attenuation, and over access and recreation facilities.
Table 9: Four segment LCM estimates
Segment 1 Moderate supporters Segment 2 : Strong opponents Segment 3 Moderate opponents Segment 4 Strong flood-prone supporters
Utility function Coef. sd Coef. sd Coef. sd Coef. sd statuquo 1.5729(***) 0.305 5.0474(**) 1.662 -1.9058(***) 0.425 -4.096(***) 0.750 qual1 1.8415(***) 0.192 1.5862(.) 0.934 1.2718(***) 0.210 1.147(***) 0.163 qual2 2.0669(***) 0.193 2.1843(*) 0.874 1.0494(***) 0.242 1.912(***) 0.168 crues1 1.0946(***) 0.130 0.4522 (ns) 0.580 1.2959(***) 0.160 0.723(***) 0.094 crues2 1.5928(***) 0.216 2.0942(*) 0.946 1.0808(***) 0.315 1.002(***) 0.177 accam2 0.8073(***) 0.195 0.4964 (ns) 1.068 -0.5402(*) 0.238 0.413(*) 0.154 accam3 1.0324(***) 0.233 1.2264 (ns) 1.084 -0.0289 (ns) 0.362 0.385(*) 0.177 accam4 1.1446(***) 0.224 1.1389 (ns) 1.042 -0.9689(**) 0.316 0.440(*) 0.183 accam5 0.6008(**) 0.217 1.7107(.) 0.961 -0.0718 (ns) 0.341 0.552(***) 0.167 contrib -0.0279(***) 0.002 -0.1037(***) 0.027 -0.1373(***) 0.008 -0.013(***) 0.001
Segment membership function
Prior knowledge 0 0.467(***) 4.04 0.630(***) 6.98 0.657(***) 7.51 Visit to Vistre River 0 0.595(***) 6.62 -0.134(*) -2 -0.327(***) -4.99 Flood prone area: yes 0 -0.407(***) -4.22 0.195(**) 2.77 0.943(***) 13.75 Flood prone area:
unknown 0 0.374(**) 2.75 -0.421(***) -3.29 2.091(***) 19.68 Inundation number 0 -0.111(***) -4.74 -0.161(***) -7.9 0.014(.) 1.82 Confidence in project 0 1.202(***) 32.55 0.567(***) 22.01 -0.510(***) -19.97 Opposition to payment 0 0.964(***) 24.74 0.775(***) 26.06 -0.101(***) -3.57 Security vs Environnement 0 0.417(***) 14.37 0.219(***) 10.09 0.014 (ns) 0.67 Employment vs Health 0 -0.124(***) -3.89 -0.024 (ns) -1 -0.304(***) -13.17 Plaine 0 0.820(***) 4.9 0.538(***) 4.34 -0.931(***) -7.23 Nîmes 0 0.778(***) 6.08 0.205(**) 2.16 -0.707(***) -7.7 Midstream 0 1.060(***) 5.59 1.085(***) 8.03 -0.610(***) -4.58 Downstream 0 0.024 (ns) 0.12 0.436(**) 2.83 0.630(***) 4.6 Vaunage 0 17.917 (ns) 0.04 17.811 (ns) 0.04 17.348 (ns) 0.04 Constant 0 -2.520(***) -14.94 -0.611(***) -4.97 -0.538(***) -4.45 Numb. obs. 2520 1410 3237 3615 Log-likelihood -680.78 -116.91 -492.68 -678.82 pseudo ρ2 0.2623 0.7736 0.5844 0.4872
*** denotes significance at 0.1% level, ** denotes significance at 1% level, * denotes significance at 5% level, . denotes significance at 10% level; (ns) denotes insignificant variables
As segment 1 was taken as reference, membership coefficients of this segment can be interpreted in relation to the signs of the estimated significant coefficients for the other segments. Absence of prior knowledge of Vistre River increases the probability of belonging to this segment. Mean characteristics displayed in Table 8 show that segment 1 members are characterized in average by an intermediate level of confidence in the project and an acceptation of payment. They give priority to environment and