Publisher’s version / Version de l'éditeur:
Technical Report, 2011-02-01
READ THESE TERMS AND CONDITIONS CAREFULLY BEFORE USING THIS WEBSITE.
https://nrc-publications.canada.ca/eng/copyright
Vous avez des questions? Nous pouvons vous aider. Pour communiquer directement avec un auteur, consultez la première page de la revue dans laquelle son article a été publié afin de trouver ses coordonnées. Si vous n’arrivez pas à les repérer, communiquez avec nous à PublicationsArchive-ArchivesPublications@nrc-cnrc.gc.ca.
Questions? Contact the NRC Publications Archive team at
PublicationsArchive-ArchivesPublications@nrc-cnrc.gc.ca. If you wish to email the authors directly, please see the first page of the publication for their contact information.
NRC Publications Archive
Archives des publications du CNRC
For the publisher’s version, please access the DOI link below./ Pour consulter la version de l’éditeur, utilisez le lien DOI ci-dessous.
https://doi.org/10.4224/17210690
Access and use of this website and the material on it are subject to the Terms and Conditions set forth at
Open Water Field Trials of an Instrumented Conventional Lifeboat
Ferrieri, Jenna
https://publications-cnrc.canada.ca/fra/droits
L’accès à ce site Web et l’utilisation de son contenu sont assujettis aux conditions présentées dans le site LISEZ CES CONDITIONS ATTENTIVEMENT AVANT D’UTILISER CE SITE WEB.
NRC Publications Record / Notice d'Archives des publications de CNRC:
https://nrc-publications.canada.ca/eng/view/object/?id=10900402-7f30-4160-bbbc-c4698763c636 https://publications-cnrc.canada.ca/fra/voir/objet/?id=10900402-7f30-4160-bbbc-c4698763c636
DOCUMENTATION PAGE
REPORT NUMBER
TR-2010-19
NRC REPORT NUMBER DATE
August 2010
REPORT SECURITY CLASSIFICATION
Unclassified
DISTRIBUTION
Unlimited
TITLE
OPEN WATER FIELD TRIALS OF AN INSTRUMENTED CONVENTIONAL LIFEBOAT AUTHOR (S)
Jenna Ferrieri
CORPORATE AUTHOR (S)/PERFORMING AGENCY (S)
Institute for Ocean Technology, National Research Council, St. John’s, NL
PUBLICATION
SPONSORING AGENCY(S)
IOT PROJECT NUMBER NRC FILE NUMBER
KEY WORDS
Performance, TEMPSC, field trials, lifeboat,open water
PAGES iii, 9 FIGS. 9 TABLES 1 SUMMARY
This report presents the results of field trials to assess the performance of a 20 person totally enclosed motor propelled survival craft (TEMPSC) in open water. The purpose of these tests was to determine the performance characteristics of the lifeboat, which has recently undergone modifications to the propeller and nozzle. The trials were conducted in the open water of Conception Bay beginning July 19, 2010 and ending July 20, 2010 out of Memorial University of Newfoundland Marine Institute’s Holyrood facility.
ADDRESS National Research Council
Institute for Ocean Technology Arctic Avenue, P. O. Box 12093 St. John's, NL A1B 3T5
National Research Council Conseil national de recherches Canada Canada
Institute for Ocean Institut des technologies
Technology océaniques
OPEN WATER FIELD TRIALS OF AN INSTRUMENTED
CONVENTIONAL LIFEBOAT
TR-2010-19
Jenna Ferrieri
iii
TABLE OF CONTENTS
LIST OF FIGURES ... iii
LIST OF TABLES... iii
1.0 INTRODUCTION ... 1 2.0 FIELD TRIALS ... 1 2.1 Lifeboat ... 1 2.2 Test Plan... 2 3.0 DATA ANALYSIS... 2 4.0 RESULTS ... 2
4.1 Bollard Pull, Inclining Test, and Roll Decay ... 2
4.2 Acceleration and Speed Runs and Crash Stops ... 3
4.3 Turning Circles ... 5
5.0 CONCLUSIONS ... 8
LIST OF FIGURES Figure 1. Lifeboat outfitted for open water trials... 1
Figure 2. Bollard pull force as a function of propeller shaft speed... 3
Figure 3. Acceleration and speed run with a crash stop. ... 4
Figure 4. Shaft rotation and speed over ground. ... 4
Figure 5. Turning Circle Test: Starboard turn in no wind conditions... 7
Figure 6. Turning Circle Test: Port turn in no wind conditions... 7
Figure 7. Turn diameter as a function of rudder angle. ... 8
Figure 8. Speed change through port turning circles. ... 9
Figure 9. Speed change through starboard turning circles... 9
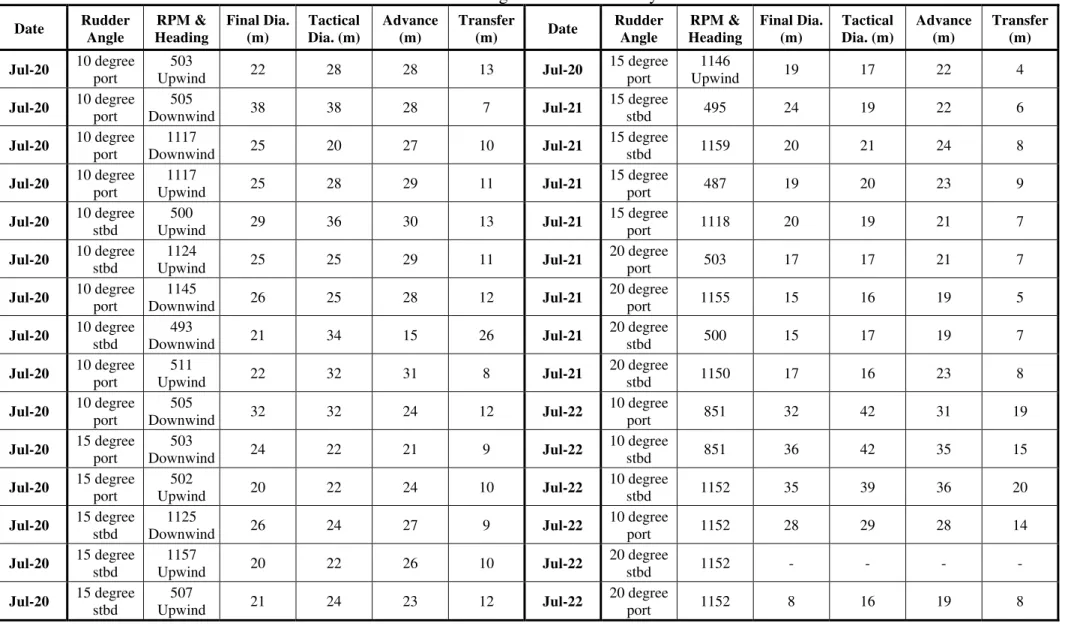
LIST OF TABLES Table 1. Turning circle data summary. ... 6
1 1.0 INTRODUCTION
This report presents the results of field trials to assess the performance of a 20 person totally enclosed motor propelled survival craft (TEMPSC) in open water. The purpose of these tests was to determine the performance characteristics of the lifeboat, which has recently
undergone modifications to the propeller and nozzle. The trials took place during July 2010 out of Memorial University of Newfoundland Marine Institute’s Holyrood facility on Conception Bay.
2.0 FIELD TRIALS 2.1 Lifeboat
The lifeboat, or TEMPSC, has an overall length of 5.28m, a breadth of 2.20m, and depth of 1.10m. The hull, inner hull, and canopy, were constructed individually from fiberglass with a layer of polyurethane foam for buoyancy purposes. During trials, the lifeboat had a displacement of 3750 kg and was equipped with a 50 HP engine and a four bladed propeller housed inside of a steerable nozzle.
The new propeller diameter is 45.7 cm with a pitch of 30.5 cm. The nozzle has inner and outer diameters of 46.4 cm and 55.6 cm, respectively. Previously, the lifeboat was fitted with a three bladed propeller housed in a steerable nozzle. The diameter and pitch of this
propeller are 45.7 cm and 27.9 cm, respectively, and the inner and outer diameters of the old nozzle are 19.7 cm and 20.5 cm, respectively. Figure 1 shows the lifeboat in operation during the July 2010 trials.
2 2.2 Test Plan
Trials were conducted in the open water of Conception Bay beginning July 19, 2010 and ending July 22, 2010. The tests were carried out to determine the speed and maneuverability of the TEMPSC in open water as well as the roll period, roll decay, and bollard pull
performance.
Bollard pull, roll decay, and inclining tests were performed on the first day of trials. Testing on Day 2 of trials consisted of acceleration and speed runs and turning circles. For each of the acceleration runs, the shaft speed was increased from the clutched position to a desired shaft rotation speed. Once this shaft speed was achieved, the lifeboat reached and maintained a constant cruising speed until the sampling period ended. Turning circles were completed at various shaft speeds and various rudder angles, and for each run, the lifeboat completed two revolutions (720 degrees) before exiting the turn. There were a series of zigzags, crash stops, and acceleration and speed runs completed on the third day of testing. The zigzags were not performed to standard, and will therefore not be discussed further in this report. For crash stops, the lifeboat speed is brought up to the desired speed. Once it has achieved steady state, the throttle is brought to full astern until the vessel comes to a complete stop. A continuation of the testing mentioned above was continued on the fourth day of trials.
3.0 DATA ANALYSIS
After the data is calibrated, a pre-developed IGOR procedure is used to load the data into the IGOR Pro software. This procedure converts the data files to a format readable by IGOR. Additionally, this procedure combines the latitude high and low and longitude high and low data into Northing and Easting coordinates. The Course Over Ground (COG) and Speed Over Ground (SOG) can also be calculated using this procedure, along with the GPS data. A separate Turning Circle IGOR procedure is used to analyze the turning circle data. This procedure calculates the advance, transfer, tactical diameter, and final diameter for each turning circle. Additionally, the procedure creates a graph of each turning circle annotated with the diameters listed above.
4.0 RESULTS
4.1 Bollard Pull, Inclining Test, and Roll Decay
Bollard pulls were performed using a load cell attached to a line connecting a bollard on the dock to an aft pull point on the stern of the lifeboat. The propeller shaft speed was adjusted from 0 to full throttle at average intervals of 145 RPM, beginning at clutched throttle and ending at full throttle. The force of the lifeboat pull was measured at these interval shaft speeds as the TEMPSC accelerated and the force was measured again as the TEMPSC decelerated. At a maximum shaft speed of 1165 RPM, the force of the lifeboat pull was just over 5100 N. Figure 2 shows the bollard pull forces against the shaft speeds.
3 5000 4000 3000 2000 1000 Bo lla rd Pu ll [ N ] 1000 800 600 400 Shaft Rotation [RPM] y = 5.328x + 289.6
Bollard Pull Tests
Figure 2. Bollard pull force as a function of propeller shaft speed.
Inclining tests were done to determine the stability of the lifeboat. Weights were moved transversely to induce a heel on the vessel and the angle change was used to determine the metacentric height (GM) of the lifeboat as shown in Equation 1, below.
[1]
In this equation, GM is the metacentric height, W is the weight used to induce heel, x is the distance the weight was displaced, is the TEMPSC weight, and is the average heel angle found during the analysis of the incline test data. The metacentric height was determined to be 1.99 m.
The roll decay tests performed during trials showed that the lifeboat has an average roll period of approximately 3.54 seconds and a roll decay of about 0.014.
4.2 Acceleration and Speed Runs and Crash Stops
The time for the lifeboat to accelerate was tested, as well as the acceleration rate, the speed the lifeboat attained, and the time and distance it took for the lifeboat to come to a complete stop during crash stops. An example of an acceleration and speed run with a crash stop is shown in Figure 3. As shown on the graph, the time to accelerate at 0.45 kts/s was 18.96 seconds and the lifeboat attained a speed of 6.58 knots. This test run was done in calm waters with minimal wind conditions. It took approximately 14 seconds for the TEMPSC to perform a crash stop from a cruising speed of 6.58 knots and the vessel traveled a distance of 16.19 meters during the time to stop.
4
The shaft speed and speed the lifeboat attained were measured and recorded for each of the acceleration and speed runs. Figure 4 shows a plot of the shaft rotation speed against the speed over ground of the lifeboat during these tests. The maximum speed that the lifeboat achieved was 6.64 knots with a shaft speed of 1152 RPM in no wind conditions.
8 6 4 2 0 S O G [k ts ] 60.4 60.2 60.0 59.8 Time [ks]
Acceleration to 1141 RPM and Crash Stop
Acceleration = 0.45 kts/s Time to Accelerate = 18.963s
Speed = 6.58 kts
Time to Stop = 14s Disctance to Stop = 16.19m
Figure 3. Acceleration and speed run with a crash stop.
1200 1000 800 600 400 S h a ft R o ta ti o n [R P M ] 7.0 6.5 6.0 5.5 5.0 4.5 4.0 3.5 SOG [kts] y = 228.82x + 467.65 Speed Runs
5 4.3 Turning Circles
Turning circles were performed to test maneuverability of the lifeboat. These runs included turns to port and starboard at rudder angles of 10, 15, and 20 degrees and shaft speeds of approximately 500 RPM and 1150 RPM. The set of data from the turning circles performed during trials are shown in the table below [Table 1].
The table contains the circle diameter—final and tactical—as well as the advance and transfer for each turning circle performed during trials. Since wind conditions can affect the lifeboat’s maneuverability, circles were done in both the upwind and downwind directions when wind was thought to have an effect.
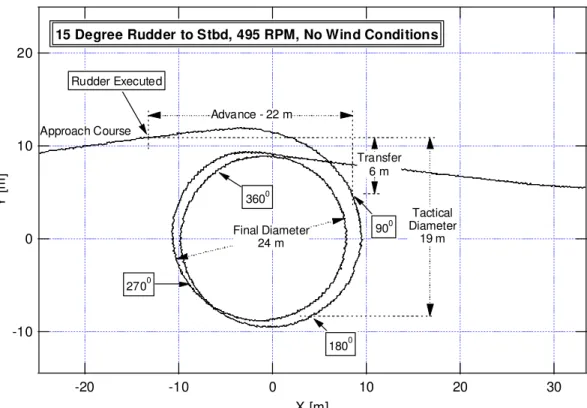
A starboard turn executed at 495 RPM with a rudder angle of 15 degrees is shown in Figure 5. The final diameter of this turn was 24 meters, the advance was 22 meters and the transfer was 6 meters. A port turn with the same rudder angle was executed with a propeller shaft speed of 487 RPM [Fig 6]. This turn had a final diameter of 19 meters, an advance of 23 meters, and a 9 meter transfer.
6
Table 1. Turning circle data summary. Date Rudder Angle RPM & Heading Final Dia. (m) Tactical Dia. (m) Advance (m) Transfer (m) Date Rudder Angle RPM & Heading Final Dia. (m) Tactical Dia. (m) Advance (m) Transfer (m) Jul-20 10 degree port 503 Upwind 22 28 28 13 Jul-20 15 degree port 1146 Upwind 19 17 22 4 Jul-20 10 degree port 505 Downwind 38 38 28 7 Jul-21 15 degree stbd 495 24 19 22 6 Jul-20 10 degree port 1117 Downwind 25 20 27 10 Jul-21 15 degree stbd 1159 20 21 24 8 Jul-20 10 degree port 1117 Upwind 25 28 29 11 Jul-21 15 degree port 487 19 20 23 9 Jul-20 10 degree stbd 500 Upwind 29 36 30 13 Jul-21 15 degree port 1118 20 19 21 7 Jul-20 10 degree stbd 1124 Upwind 25 25 29 11 Jul-21 20 degree port 503 17 17 21 7 Jul-20 10 degree port 1145 Downwind 26 25 28 12 Jul-21 20 degree port 1155 15 16 19 5 Jul-20 10 degree stbd 493 Downwind 21 34 15 26 Jul-21 20 degree stbd 500 15 17 19 7 Jul-20 10 degree port 511 Upwind 22 32 31 8 Jul-21 20 degree stbd 1150 17 16 23 8 Jul-20 10 degree port 505 Downwind 32 32 24 12 Jul-22 10 degree port 851 32 42 31 19 Jul-20 15 degree port 503 Downwind 24 22 21 9 Jul-22 10 degree stbd 851 36 42 35 15 Jul-20 15 degree port 502 Upwind 20 22 24 10 Jul-22 10 degree stbd 1152 35 39 36 20 Jul-20 15 degree stbd 1125 Downwind 26 24 27 9 Jul-22 10 degree port 1152 28 29 28 14 Jul-20 15 degree stbd 1157 Upwind 20 22 26 10 Jul-22 20 degree stbd 1152 - - - - Jul-20 15 degree stbd 507 Upwind 21 24 23 12 Jul-22 20 degree port 1152 8 16 19 8
7 20 10 0 -10 Y [ m ] 30 20 10 0 -10 -20 X [m] Rudder Executed 900 1800 2700 3600 Approach Course Final Diameter 24 m Advance - 22 m Transfer 6 m Tactical Diameter 19 m
15 Degree Rudder to Stbd, 495 RPM, No Wind Conditions
Figure 5. Turning Circle Test: Starboard turn in no wind conditions.
15 10 5 0 -5 -10 Y [ m ] -20 -10 0 10 20 X [m] Rudder Executed 900 1800 2700 3600 Approach Course Final Diameter 19 m Advance - 23 m Transfer 9 m Tactical Diameter 20 m
15 Degree Rudder to Port, 487 RPM, No Wind Conditions
8 5.0 CONCLUSIONS
The field trials of a conventional 20 person lifeboat were carried out to investigate the performance characteristics in open water. Over the course of four testing days, more than 60 runs were performed with measurements recorded.
From the acceleration and speed runs, it was found that the lifeboat can achieve and maintain speeds well over 6 knots when operating at high propeller shaft speeds. The maximum cruising speed experienced during trials was 6.64 knots in no wind conditions with a propeller shaft speed of 1152 RPM.
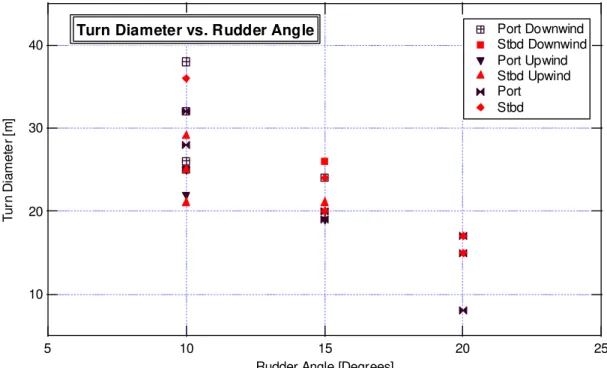
Since the new propeller is right-handed, it will spin in the clockwise direction when in forward gear and viewed from aft. The stern of the boat will “walk” in the direction of rotation and therefore the stern of the lifeboat to tend to starboard when the TEMPSC is moving forward. Because of this natural propeller walk effect, it would seem that port turning circles would have smaller diameters than the starboard turning circles. Due to the large amount of variation in the dataset for each specified rudder angle [Fig 7], one cannot say confidently that this assumption is true. However, the turning circle test results clearly show that as rudder angle increases, the turn diameters decrease. This is because the larger nozzle angle directs a larger portion of the thrust perpendicular to the centerline of the lifeboat, creating a greater turning moment.
40 30 20 10 Tu rn D ia m e te r [m ] 25 20 15 10 5
Rudder Angle [Degrees]
Port Downwind Stbd Downwind Port Upwind Stbd Upwind Port Stbd
Turn Diameter vs. Rudder Angle
Figure 7. Turn diameter as a function of rudder angle.
It is common for the lifeboat to lose speed during the turning circles, even though shaft speed is held constant. This is a result of increased resistance as the nozzle angle
9
increases, as well as the presence of drift resistance as the lifeboat begins the turn. The change in speeds varies for each run and depends on initial speed and rudder angle. Figures 8 and 9 illustrate this loss of speed through turning circles for port and starboard turns, respectively. These graphs show that the speed changes for the 10 degree rudder turns are less than the speed changes experienced during the 15 and 20 degree turns.
10 8 6 4 2 0 S O G [k ts ] 5 4 3 2 1 10 deg 500RPM 10 deg 1150RPM 15 deg 500RPM 15 deg 1150RPM 20 deg 500RPM 20 deg 1150RPM
Speed Change During Port Turns
Prior to Turn Start of Turn Mid-Turn End of Turn After Turn Figure 8. Speed change through port turning circles.
10 8 6 4 2 0 SO G [ kt s] 5 4 3 2 1 10 deg 500RPM 10 deg 1150RPM 15 deg 500RPM 15 deg 1150RPM 20 deg 500RPM 20 deg 1150RPM Prior to Turn Start of Turn Mid-Turn End
of Turn AfterTurn
Speed Change During Starboard Turns