Analysis and Modeling of Spain's Power Sector
in Order to Define the Best Incentive Policies for Achieving an
Optimum Energy Mix
By
A. Santiago Ibanez L6pez MASSACHUSETTS INS
OF TECHNOLOGY M.Sc. Industrial Engineering University of Vigo, 1998 MBA IE Business School, 2010
f
MAY- 3 0 2013
I
L._
LiBRARIES
SUBMITTED TO THE MIT SLOAN SCHOOL OF MANAGEMENT IN PARTIAL FULFILLMENT OF THE REQUIREMENTS FOR THE DEGREE OF
MASTER OF BUSINESS ADMINISTRATION AT THE
MASSACHUSETTS INSTITUTE OF TECHNOLOGY
JUNE 2013
© 2013 A. Santiago Ibanez L6pez. All rights reserved.
The author hereby grants to MIT permission to reproduce and to distribute publidy paper and electronic copies of this thesis document in whole or in part
in any medium now known or hereafter created.
#
s~n~ure~Aufuo~~~~.~<_~~~~~~~~<~~~~~~~~~~~~~~~~~
~ MIT Sloan School of Management
May 10, 2013 Certified by: ~~----I~"":"';"';~~~~~~~~~~~~~~~~~~~~_~_~
Henry Birdseye Weil Senior Lecturer Thesis Supervisor Accepted by:
~---'7/7~-:;"-:IIi'F---~1ftl---tL>"-"-~--~~~~-~~~~~--~~-L /
Stephen SaccaAnalysis and Modeling of Spain's Power Sector
in Order to Define the Best Incentive Policies for Achieving an
Optimum Energy Mix
ABSTRACT
By
A. Santiago Ibanez Lopez
Submitted to MIT Sloan School of Management on May 10, 2013 in Partial Fulfillment of the
Requirements for the Degree of Master of Business Administration
The goal of this thesis is the development of a model of the Spanish energy mix in order to be able to forecast its evolution in function of exogenous variables such as the public opinion about specific technologies, the price of oil, the price of natural gas, the interest rate, etc. at a given moment in time. The development of such a model is interesting in order to set the right pOlicies and incentives for achieving a required energy mix as well as to calculate the system costs at a specific moment in time. This way, under or overinvestment in specific technologies can be avoided.
This issue has been a cause of concern in Spain, where for example, because of erratic incentive policies a huge overinvestment in solar PV power happened between 2008 and 2009, which entailed higher than expected energy costs that will have to be paid by the final consumers for many years. So, a model of the power system has been developed using the System Dynamics methodology. The model has been subsequently validated using historical data in order to check that the results obtained by the model reflect the reality.
Once validated, different future scenarios have been considered and the model has been used in order to define the energy policies that entail the optimum results in terms of the resulting energy mix and wholesale power price. Learnings and conclusions about the Spanish power market have been summarized.
Thesis Supervisor: Henry Birdseye Weil
Acknowledgments
I feel privileged to have the unconditional support of many people and friends at MIT during the development of this work. I want here to send my deepest and sincere gratitude to all of them.
I want to thank specially my advisor, Professor Henry Birdseye Weil. I had the privilege to attend his classes, that allowed me to better understand the energy industry from a broader and more integrative perspective and I also had the privilege of having him as my advisor for this thesis. I am very grateful for his support, orientation and wise advice. I would have not been able to make it without him.
I want to also thank the MIT Sloan Fellows program director, Mr. Stephen Sacca for his dedication and hard work in order to help me to manage the whole program and finish it successfully. I am very grateful for his help and advice.
Table of contents
1 Introduction ... 14 2 Methodology ... 15 2.1 Main assumptions ... 15 2.2 Phases ... 16 2.3 Time frame ... 163 Description and evolution of the Spanish energy mix ... 17
4 Description of the Spanish power market ... 20
5 Preliminary statistical analysis ... 23
6 Modeling ... 25 6.1 Main assumptions ... 25 6.2 Variables ... , ... 25 6.2.1 Exogenous variables ... 25 6.2.2 Endogenous variables ... 26 6.3 Technologies involved ... , ... 26 6.3.1 Hydro ... 26 6.3.2 6.3.3 6.3.4 6.3.5 6.3.6 6.3.7 6.3.8 6.3.9 6.3.10 6.3.11 6.3.12 Nuclear ... 26 Coal ... 27 Gas Peak ... 27
Gas Combined Cycle ... 27
Small Hydro ... ~ ... 28 Wind ... 28 Other renewable ... 28 Biomass ... 28 Solar PV ... 29 Solar Thermoelectric ... 29 Cogeneration ... 29 6.4 Dynamics considered ... 30
6.4.1 Energy resources available ... 30
6.4.2 Negative public opinion ... 30
6.4.3 Cost of electricity ... : ... 31
6.4.4 Cost of fuel ... 31
6.4.5 State of the art ofthe technology. Performance and Specific investment ... 32
6.4.6 Capacity gap ... 32
6.4.7 Expected life of the power plants ... 33
6.4.8 Retail power price ... 34
6.4.9 Cost of capital ... 34 6.5 Main equations ... 34 6.5.1 Installation rate ... 35 6.5.2 Decommissioning rate ... 35 6.5.3 Performance ... 35 6.5.4 Specific investment ... 36
6.5.5 Negative public opinion ... 36
6.5.6 Wholesale power price ... 36
6.5.7 LCOE ... 37
6.5.8 IRR ... 37
7 Validation of the model ... 38
7.1 Assumptions ... 38
7.2 Results ... 38
7.3 Conclusions about the validation ... 41
8 Forecasting ... 42
8.1 Scenarios ... 42
8.2 Desired energy mix ... 42
8.3 Results ... 43
8.3.1 Scenario 0 ... 43
8.3.3 Scenario 2 ... 45
8.3.4 Scenario 3 ... 45
9 Conclusions ... 47
9.1 About the model ... 47
9.2 About the Spanish power market ... 47
10 Further development ... 50
Attachment 1. Correlation Results ... 51
Attachment 2. Technology data ... , ... 52
Attachment 3. LCOEs ... 53
Attachment 4. Vensym models ... 54
Attachment 5. Market Premiums ... 66
Attachment 7. Results Scenario 0 ... 68
Attachment 8. Results Scenario 1 ... 71
Attachment 9. Results Scenario 2 ... 74
Attachment 10. Results Scenario 3 ... 77
List of figures
Figure 1: Spain's GOP ...•... 17
Figure 2: Energy demand ... 17
Figure 3: Total installed capacity and peak power demand ... 18
Figure 4: Installed capacity. Conventional power ... 18
Figure 5: Installed capacity. Special power ... 19
Figure 6: Structure of the Spanish power pooL ... 20
Figure 7: Determination of the hourly marginal power price ... 21
Figure 8: Energy prices ... 22
Figure 9: Resources loop ... 30
Figure 10: Negative public opinion loop ...•... 30
Figure 11: Cost of elyctricity loop ... 31
Figure 12: Cost of fuel loop ... 31
Figure 13: Technology loop ... 32
Figure 14: Capacity gap loop ... 33
Figure 15: Expected life loop ... 33
Figure 16: Retail power price ... 34
Figure 17: Conventional installed capacities as per the model forecast.. ... 38
Figure 18: ConventionallRRs as per the model forecast ... 39
Figure 19: Alternative installed capacities as per the model forecast.. ... 39
Figure 20: Alternative IRRs as per the model forecast. ... 40
Figure 21: Wholesale power price as per the model forecast.. ... 40
Figure 22: Future scenarios ... 42
Figure 23: Wholesale power price for different PV shares in 2021. Scenario 2 ... 49
Figure 24: Hydro model ... 54
Figure 25: Nuclear model ... 55
Figure 27: Gas peak model ...•... 57
Figure 28: Gas combined cycle model. ... 58
Figure 29: Small hydro model ... 59
Figure 30: Wind model ... 60
Figure 31: Solar PV model ... 61
Figure 32: Solar thermoelectric model ... 62
Figure 33: Cogeneration model ... 63
Figure 34: Price model ... 64
Figure 35: Capacity gap model ... 64
Figure 36: Market share model ... 65
Figure 37: Conventional installed capacities. Scenario 0 ... 68
Figure 38: ConventionallRRs. Scenario 0 ... 68
Figure 39: Alternative Installed Capacities. Scenario 0 ... 69
Figure 40: Alternative IRRs. Scenario 0 ... 69
Figure 41: Wholesale price. Scenario 0 ... 70
Figure 42: Share renewables. Scenario 0 ... ~ ... 70
Figure 43: Conventional installed capacities. Scenario 1 ... 71
Figure 44: ConventionallRRs. Scenario 1 ... 71
Figure 45: Alternative Installed Capacities. Scenario 1 ... 72
Figure 46: Alternative IRRs. Scenario 1 ... 72
Figure 47: Wholesale price. Scenario 1 ... ; ... 73
Figure 48: Share renewables. Scenario 1 ... 73
Figure 49: Conventional installed capacities. Scenario 2 ... 74
Figure 50: ConventionallRRs. Scenario 2 ... 74
Figure 51: Alternative Installed Capacities. Scenario 2 ... 75
Figure 52: Alternative IRRs. Scenario 2 ... 75
Figure 53: Wholesale price. Scenario 2 ... 76
Figure 55: Conventional installed capacities. Scenario 3 .•... 77
Figure 56: ConventionallRRs. Scenario 3 ... 77
Figure 57: Alternative Installed Capacities. Scenario 3 ... 78
Figure 58: Alternative IRRs. Scenario 3 ... 78
Figure 59: Wholesale price. Scenario 3 ... 79
Figure 60: Share renewables. Scenario 3 ... 79
Figure 61: Total power demand ... 80
Figure 62: Total installed capacity ... 80
List of tables
Table 1: Impact of exogenous variables on installation and decommisioning rates ... 25
Table 2: Impact of endogenous variables on installation and decommissioning rates ... 26
Table 3: Premiums in Scenario 0 ... 43
Table 4: Share of renewable capacity Scenario 0 ... 43
Table 5: Premiums in Scenario 1 ... 44
Table 6: Share of renewable capacity Scenario 1 ... 44
Table 7: Premiums in Scenario 2 ... 45
Table 8: Share of renewable capacity Scenario 2 ... 45
Table 9: Premiums in Scenario 3 ... 46
Table 10: Share of renewable capacity Scenario 3 ... 46
Table 11: Correlation results ... 51
1 Introduction
The goal of this thesis is the development of a model of the Spanish energy mix in order to be able to forecast its evolution in function of exogenous variables such as the public opinion about specific technologies, the price of oil, the price of natural gas, the interest rate, etc. at a given moment in time. The development of a model like this is interesting in order to set the right policies and incentives for achieving a required energy mix as well as to calculate the system costs at a specific moment in time. This way, under or overinvestment in specific technologies can be avoided.
This issue has been a cause of concern in Spain, where for example, because of erratic incentive policies a huge overinvestment in solar PV power happened between 2008 and 2009. This fact has been the cause of higher than expected energy costs that will have to be paid for more than 20 years.
Energy projects are very capital intensive and long term. Permitting and construction times are large so that there is an important delay between the moment when an investment decision is made and the moment when the power plant actually starts operation. These facts introduce a large 'inertia' in the power system which has to be taken into consideration when designing the incentive policies in order to avoid under or over investment.
2 Methodology
2.1
Main assumptions
The energy mix at a specific moment in time will be given by the historical rates of installation and decommissioning for each technology.
The model is based on free market rules. It considers that one of the main drivers of the installation and decommissioning rates is the investor's expected I RR. This is the reason why the model has been validated using the 1998 - 2011 period. The Spanish power market was regulated and the construction of power plants was centrally planned until 1998. After this date, investment decisions were made available to private investors.
In addition to the IRR argument, the model is considering two more drivers for the installation and decommissioning rates:
• Even though the Spanish power industry is supposed to be completely liberalized, this is not exactly right. This fact is shown is some aspects such as the incentives that some technologies receive or in the constraints that some projects have due to political decisions. For example, in the case of nuclear power, there is a strong movement against it in. Because of this, no government seems to be willing to approve new nuclear projects. The same happens with wind power in some areas of the country where the visual impact is not acceptable for some groups of citizens. So, it is clear that not only the market power (summarized by the investor's IRR) is a driver for the installation of new power plants. Public opinion and policies matter.
• Even tough a specific technology may be very profitable in terms of IRR, it may happen that there are physical constraints which prevent the development of additional projects. For example this is the case of large hydro projects. Because most of the available river sites have been already used in Spain, there is no 'room' for new projects.
The presence of these two factors makes the simulation challenging as it is not easy to assign a numeric value variables such as the 'subjective negative public opinion'.
A second important assumption is the consideration of a lineal model. Because of the technical difficulty regarding the integration of Excel financial models into Vensym, it has been assumed that the IRR depends linearly on the variables affecting it. This is not exactly the case, but it can be a good approximation when changes in the values of variables are small.
The third important assumption regards the calculation of the wholesale power price. In reality, this price is set hourly by the most expensive generating unit producing energy (see point 4). This price is called 'system marginal price' and it will be received by all the units which produce power at this specific time. Due to the 'continuous' characteristics of this model, discrete power plants have not been modeled.
Instead, the wholesale market price has been calculated as a weighted average of the LCOE (Levelized Cost of Electricity) of the generation mix. This is a simplification of the reality but as shown in point 7.2, it yields very reasonable results in terms of wholesale power price.
2.2
Phases
The present work is divided in the following phases:
1. Description and analysis of the operation of the Spanish power sector. Gathering of historical data regarding the main variables related to the sector.
2. Modeling of the system.
3. Validation of the model based on historical data.
4. Development of potential scenarios for the future demand of power.
5. Simulation of the scenarios in order to define the optimum incentive policies in order to minimize the wholesale power price, obtain a specific energy mix and achieve a specific capacity gap.
2.3
Time frame
As it will be described later, the Spanish power market initiated its liberalization process in 1998, when the entire wholesale market and part of the retail market were liberalized. Before this date, the construction of power plants was centrally planned by the government. Different energy plans (PEN - Plan Energetico Nacional) were issued every 5 - 6 years.
So, before 1998, the system was not subject to market forces so that the models developed here don't apply. Because of this reason, the time frame of this work comprises the period 1998 - 2012.
3 Description and evolution of the Spanish energy mix
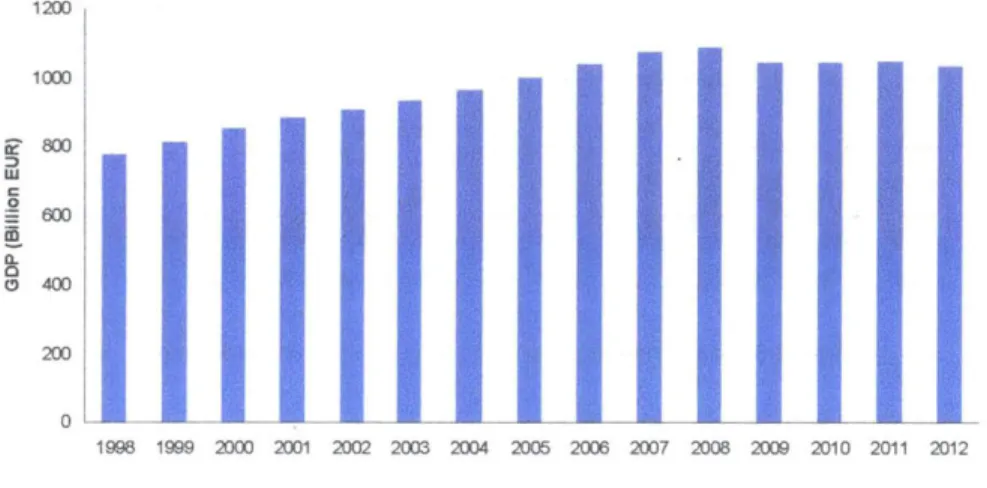
The Spanish GOP has experienced a significant growth since 1998 until 2008, when the global financial crisis hardly hit the Spanish economy. The evolution of the Spanish GOP is shown in Figure 11.
1200 100J ir 800 ;:) w c ~ 600 ~ Q.. 0 (!) 400 200 1998 1999 2000 2001 2002 2003 2004 2005 2C05 2007 2008 2009 2010 2011 2012
Figure 1: Spain's GOP
Energy demand and GOP are strongly correlated. So, there was a significant increase in the demand of power since 1998 until 2008, when the demand started to decline due to the economic downturn. The evolution of the demand of electric energy is shown in Figure 22.
300,000 250,000 ~ ~ 200,000 '0 ~ 150,000 Q) o >-01 ~ 100,000 w 50,000 1998 1999 2000 2001 2002 2003 2004 2005 2006 2007 2008 2009 2010 2011
Figure 2: Energy demand
1 International Monetary Fund. 2013. World Economic Outlook Database. Retrieved from
http://www.imf.org/external/pubs/ft/weo/2013/01/weodata/index.aspx
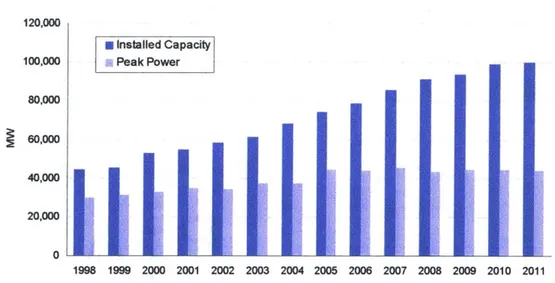
The evolution of the total installed capacity and peak power demand is shown in Figure 33. 120,000
100,000
I
•
Installed Capacity
I
iii Peak Power80,000 ~ 60,000 ~ 40,000 20,000 0 ~ 11<:
t
i
f-""
~~
1 '-~ ~ ~ ~ ti;, 'i!
;
;
~ ~~
~
lo~I
~
[~ t,1. I'~ l~~ ~; ~~I
t
.~ ~~ rp~
~
It I"'l I't1
1
,
t
~
I" ,~ t~ I'ic ~, !A !"'. r~\r
~
'-j !~ r- I;' !;~ i:t· I~,i i;l' I;~ 1':1,
:.j
<I ," '" 1998 1999 2000 2001 2002 2003 2004 2005 2006 2007 2008 2009 2010 2011Figure 3: Total installed capacity and peak power demand
It can be observed a large increase in the capacity gap mainly due to the massive installation of gas combined cycle and wind power.
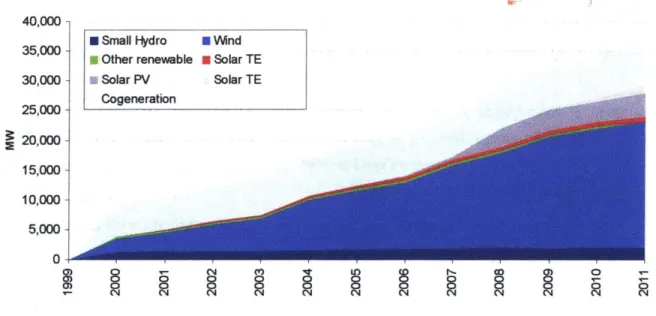
The graphs describing the evolution of the energy mix for both the conventional and the special power generation are shown in Figure 4 and Figure 54.
70,000 60,000 50,000 ~ 40,000 ~ 30,000 20,000 10,000 0 co 0) 0) T'"" • Hydro • Coal GasCC
8
o ~ • Nuclear Gas peako
o N ~ o Na
o N ~ o N8
o N8
o N,...
o o NFigure 4: Installed capacity. Conventional power
3 REE - Red Electrica de Espana. 1998 - 2011. EI Sistema Electrico Espanol
4 REE - Red Electrica de Espana. 1998 - 2011. EI Sistema Electrico Espanol
~ o N ~ o N o
o
N40,000 35,000 30,000 25,000 ~ 20,000 15,000 10,000 5,000 0 m m m
• Small Hydro • Wind Other renewable • Solar TE • Solar PV
Cogeneration
Solar TE
8
N
Figure 5: Installed capacity. Special power
The causes affecting the evolution of each technology are described in point 6.3.
o
4 Description of the Spanish power marketS
The Spanish power market was fully regulated until 1998, when a progressive liberalization process started.
The initial stage of liberalization involved the wholesale market. Generation was liberalized so that investors did not relay on central planning anymore. The retail side of the market was progressively liberalized. Initially, only the largest consumers were entitled to partiCipate in the liberalized market, while the smaller ones were still subject to the tariff system.
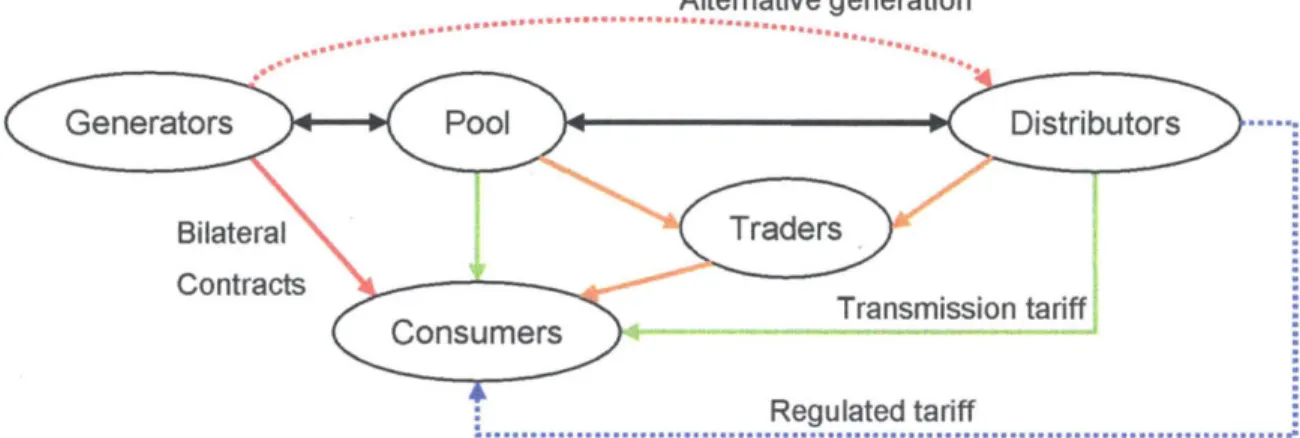
The retail market was progressively liberalized and, today, all consumers participate in the free market. The market structure is shown in Figure 8.
Alternative generation
...
...
.
... .
~ ~ Contracts Transmission tariff : Regulated tariff...
Figure 6: Structure of the Spanish power pool
Generators have two possibilities for selling their power:
• Bilateral contracts: Signed by generators and final consumers. In general, only very large final consumers use this option.
• Trading in the power pool: Most of the power produced in Spain is actually traded in the power pool. All generators scheduled for generation in a specific hour will receive the marginal power price independently of their bids.
In the case of the alternative energy sources, there is a third option (dotted line in Figure 6) which consists in directly selling the energy to the distribution companies. In this case, the generators will receive a regulated feed-in tariff.
In case the alternative sources of energy participate in the power pool, they will receive a regulated premium in addition to the marginal power price.
Final consumers can purchase power in four different ways:
• Through bilateral contracts directly signed with the generation units.
• By participating in the power pool exchange.
• By buying it from traders. This option is used by small consumers that don't have the resources to participate each day in the power bidding system.
• By buying power directly from distributors at a regulated tariff. This option is used by very small users and it will most probably disappear in the near future as the market is fully liberalized.
Prices are set daily in the so called 'daily market'. Participants have to submit their sell / buy energy bids one day in advance and for each hour of the following day. Once the deadline is over, the system operator calculates which units are going to operate and the value of the hourly marginal price. Figure 7 shows an example of the demand / supply curves and the marginal price.
The final dispatching schedule is set once the technical restrictions are solved (for example it can happen that a generating unit cannot produce power because of an overload in the transmission system even though the bidding price is low enough to be scheduled for generation).
Figure 7: Determination of the hourly marginal power price6
The evolution of the wholesale market price between the inception of the power pool in 1998 and 2011
along with the prices of different fuels are shown in Figure 87
, 8,9, 10, 11. 160 140 120 100 80 60 40 20
o
~ Pool power price EUR I MNh
- - -Oil price USD I bbl
-lir-Coal price USD I ton
Gas price USD I ~tu
- Nuclear fuel price USD lib U02
Figure 8: Energy prices
I"-8
N
7 MIBEL - Mercado Iberico de la Electricidad. 2013. Retrieved from www.mibel.com
8 US Energy Information Administration. 2013. Independent Statistics and Analysis. Retrieved from
http://www.eia.gov/dnav/petlhistlLeafHandler.ashx?n=PET&s=RBRTE&f=A
9 US Energy Information Administration. 2011. Annual Energy Review
10 US Energy Information Administration. 2013. Independent Statistics and Analysis. Retrieved from
http://www.eia.gov/dnav/ng/ng_prLsum_dcu_nus_m.htm
11 US Energy Information Administration. 2013. Independent Statistics and Analysis. Retrieved from
5 Preliminary statistical analysis
A preliminary statistical analysis has been performed in order to assess the impact of each one of the exogenous variables in the historical rate of installation I decommissioning for each power generation technology.
The correlation coefficients between the percentage change in installed capacity and the following exogenous variables have been calculated:
•
Capacity gap 12•
Wholesale power price 13•
Oil price14•
Coal price 15•
Gas price 16•
Nuclear fuel price 17•
Subsidies 18•
Interest rates (euribor) 19The results are shown in Attachment 1. The following conclusions can be extracted:
12 REE - Red Electrica de Espana. 1998 - 2011. EI Sistema Electrico Espanol 13 MIBEL - Mercado Iberico de la Electricidad. 2013. Retrieved from www.mibel.com
14 US Energy Information Administration. 2013. Independent Statistics and Analysis. Retrieved from
http://www.eia.gov/dnav/petlhistlLeafHandler.ashx?n=PET&s=RBRTE&f=A
15 US Energy Information Administration. 2011. Annual Energy Review
16 US Energy Information Administration. 2013. Independent Statistics and Analysis. Retrieved from
http://www.eia.gov/dnav/ng/ng_prLsum_dcu_nus_m.htm
17 US Energy Information Administration. 2013. Independent Statistics and Analysis. Retrieved from
http://www.eia.gov/uranium/marketing/html/summarytable1 b.cfm
18 Spain Economy Ministry 19 Thomson Reuters Markets
• In the case of Hydro (small and large), nuclear and coal, all correlations are very weak. This makes sense and is due to the following facts:
o Hydro power is limited by the available resource (i.e. available sites in rivers). There is almost no room for new additional hydro capacity in Spain. So, this is actually the major constraint for its development.
o In the case of nuclear power there is a strong political movement against it. There is no willingness to further develop it so that this is the major constraint actually.
o In the case of coal there is also a external limitation due to the fact that Spain has to limit its CO2 emissions according to the European Union regulation. So, even in the case where the projects are prOfitable, the government wi" not approve the construction of new coal power plants.
The three pOints above make these technologies to 'stay out of the market' so that their development does not depend on the standard exogenous variables (fuel prices, etc.) but on subjective political decisions.
• Gas peak and gas combined cycle power plants show a very similar behavior. They are strongly inversely correlated with the capacity gap and the fossil fuel prices. As it was expected, low fossil fuel prices entail higher profitability for the plants so that more of them are built. On the other hand, a large capacity gap entails a lower wholesale power price so that fewer projects are built.
It is surprising that the gas power plants show a negative (although very small) correlation with the wholesale power price. Maybe this can be explained because the effect of the fuel prices offsets the effect of the power pool price.
• All renewable energy sources (small hydro, wind, biomass, solar PV and solar TE show a strong correlation with fossil energy prices showing that, when fossil fuel prices go up, more alternative energy power plants are built. The same happens with the cogeneration plants, showing that, when fossil fuel prices go up, consumers look for energy efficiency by building this kind of plants.
• Solar PV, Solar TE and cogeneration show a strong positive correlation with the subsidies as it should be expected. Surprisingly, wind and small hydro power don't show this effect. This can be caused by the fact that, in some specific sites, wind power plants are fully competitive with conventional power generation.
• Surprisingly, there seems to be no negative strong correlation between the interest rate and the investment in power plants.
6 Modeling
As mentioned above, the models are intended to describe the evolution of the Spanish energy mix in function of some external variables.
6.1
Main assumptions
The main assumption for the model is that the variable driving the rate of development of a specific technology is the IRR expected by an investor in such technology.
The IRR of a power plant is affected by many external variables. For example, in the case of a gas fired power plant, its IRR will increase with variables such as the performance of the plant, the price of electricity, and with decrease with variables such as the price of natural gas, the unavailability of the power plant, etc.
6.2
Variables
Two different sets of variables have been considered. Some variables are exogenous and some variables are endogenous.
6.2.1 Exogenous variables
The list of exogenous variables considered and its impact on the installation and decommissioning rates is shown in Table 1 .
6.2.2 Endogenous variables
The list of exogenous variables considered and its impact on the installation and decommissioning rates is shown in Table 2.
Impact on Impact on
Variable
installation rate decommissioning rate
Wholesale power price +
-Retail power price +/-
+/-Plant performance +
-Plant availability +
-Capacity gap +
-IRR +
-Table 2: Impact of endogenous variables on installation and decommissioning rates
6.3
Technologies involved
6.3.1 Hydro20
Hydro power is a very mature technology. No future big improvements in technology and performance are expected. In addition, most of the available river sites have been already used in Spain. This is the reason for the slow growth of the' installed capacity which grew from 16.5 GW in 1998 to 17.5 GW in 2011.
Because of these reasons, no additional capacity is expected in the future.
The basic parameters considered for hydro power are included in Attachment 2. 6.3.2 Nuclear1
The construction of power plants which are currently in operation in Spain took place between 1970 and
1988. 7.8 GW were built during said period and no new nuclear power plants were built after. In fact, three new nuclear projects were stopped by the Spanish government in 1984 when the so-called 'Nuclear Moratorium' was enforced because the demand was not growing as fast as expected and because of the public opposition to nuclear power. Large investments were already done and the government guaranteed the investors (large power utilities) the recovery of these outlays. Spanish consumers are still paying for these investments in their energy bills.
20 IDAE. 2006. Minicentrales Hidroelectricas 21 Foro Nuclear. 2011. Spain Nuclear Industry
There is a strong public opposition to nuclear energy in Spain and none of the main political parties is willing to build new plants. In fact, the oldest nuclear power plant was decommissioned in 2006 and it is probable that other units will be decommissioned in the near future. This fact will have a strong impact in the model developed here.
The basic parameters considered for nuclear power are included in Attachment 2.
6.3.3 Coal
Coal power installed capacity has kept constant at a level of approx 11.5 GW since 1998. There are two main reasons for this. The first one is the emergence of the new and efficient combined cycle power plants which became more competitive than the older and more inefficient coal units. The second reason is related to CO2 emissions. Coal power plants are much more polluting in terms of CO2 . Spain did not
fulfill the CO2 emission limits imposed by the UN Directive so that CO2 certificates must be bought. This is
an additional cost for the heavily polluting coal power units so that their generation cost becomes higher. The basic parameters considered for coal power are included in Attachment 2.
6.3.4 Gas Peak
Gas peak power installed capacity has kept constant at a level of 8.2 GW since 1998 to 2002 and has steadiJy declined to 1.5 GW in 2011. This is due, again, to the emergence of the combined cycle power plants which are much more efficient and give the same degree of flexibility as the older, more inefficient and expensive gas peak power plants. So, many gas peak power units were converted to combined cycle units or were decommissioned.
The basic parameters considered for gas peak power are included in Attachment 2.
6.3.6 Gas Combined Cycle22
The gas combined cycle technology has been, along with wind power, one of the most successful technologies in Spain during last years. The first units were installed in 2002 and the installed capacity reached 25.3 GW in 2011.
Because of the economic downturn and the declining power demand, there is actually an overcapacity of this kind of plants so that a significant amount of power is on stand-by many hours during the year.
The basic parameters considered for small hydro power are included in Attachment 2.
22 Basaiiez Uantada Aitor, Monica Lorenzo Garcia. 2012. Proceedings from the XVI Organization
Engineering Congress. Vigo: The Challenge of Combined Cycle Thermal Plants to the Current Energy Situation.
6.3.6 Small Hydro23
This case is very similar to the large hydro technology. The technology is very mature and no significant improvements are expected. On the contrary to the case of the large hydro power plants there are still some river sites were plants can be installed. Nevertheless, getting the required environmental permits is very challenging.
The basic parameters considered for small hydro power are included in Attachment 2.
6.3.7 Wind24
Wind technology has experienced a large growth in Spain. During the early 2000s, Spain was in the top 3 countries regarding wind installed capacity. Now it has been surpassed by countries such as the US, India or China.
The growth curve followed an exponential pattern until 2009, when due to the financial crisis, the investment in wind power in Spain started to decline. Due to actual budget deficit, the government has cut dramatically the subsidies for wind power so that a further decline in the investment is expected.
6.3.8 Other renewable
'Other renewable' includes those technologies which are in an early stage of development such as wave or tidal power. Due do the very limited impact of these technologies so far and also because it is not expected that they will develop in the short term, they have not been included in the models.
6.3.9 Biomass
Biomass has had a very limited growth since the liberalization of the power sector in 1998, reaching a maximum of 858MW in 2011. This has been caused by an erratic subsidy policy which tried to encourage investment but did not take into account all the costs associated to biomass so that these projects were never very profitable in Spain.
Because of the limited impact of biomass in the energy mix and because of the fact that no incentive policy is expected in the short term regarding this technology, it has not been included in the model.
23 Minicentrales Hidroelectricas. IDAE. 2006
24 Asociacion Empresarial Eolica. 2013. Retrieved from
6.3.10 Solar PV25
Solar PV has also been a victim of an erratic incentive policy in Spain. This technology experienced a boom in 2008, when 2,500 MW were suddenly installed because of the very high premiums in force. 500 more MW were installed in 2009 so that the system costs increased dramatically creating an atmosphere of public opinion against renewable energy sources. Subsequently, the government reacted reducing drastically the premiums for PV. Because of this fact and because of the actual budget deficit and the intention of the government of cutting expenses in the power industry, it is expected that further development of PV projects will be very limited.
6.3.11 Solar Thermoelectric26
Solar thermoelectric power has emerged strongly in the last 2 - 3 years. Spain has become one of the leading countries in these technologies, having companies such as Abengoa Solar, Acciona, Sener, etc. which are the market leaders. Solar thermoelectric power is still an expensive technology compared to conventional sources or even to wind and it seems to have less room for cost reduction than solar PV. Nevertheless, it shows a great technical advantage because it is a dispatchable technology when combined with heat storage systems, usually based on molten salt technologies.
I n the case of Spain and because of the problems described above regarding the budget deficit, subsidies for this technology has also been cut so that not many new projects are expected in the short term.
6.3.12 Cogeneration27
Cogeneration technology experienced a significant growth in Spain after the RD907/82 law was passed in 1982, even before the liberalization of the power industry. A cumulative capacity of 2,728 MW existed at the beginning of 1998, when a new law (RD2818/98) was passed in order to regulate the alternative power generation.
After 2000 and mainly because of the increasing gas prices and the lack of increase in the subsidies, the rate of installation of CHP plants declined significantly.
Even though the Spanish government is cutting expenses in the energy industry, it wants to increase the energy efficiency in order to improve the trade balance of the country (by reducing fossil fuel imports). So, it is expected that new projects will be built in the short - medium term.
25 UNEF - Union Espanola Fotovoltaica. 2013 Retrieved from http://unef.es
26 Protermo Solar. 2013. Retrieved from http://www.protermosolar.com/
6.4
Dynamics considered
The following dynamics have been considered in the simulations 6.4.1 Energy resources available
This is a very important driver for the rate of installation of new capacity, in addition to the investor's IRR. For example, in the case of hydro power, there are almost no available sites left in rivers in Spain. Most of them have already been used so that no additional capacity is expected in the future. In the case of wind power, there are still many sites available, although the ones with highest wind resource have already been used. In the case of technologies such as gas, oil, nuclear, where the resource can be transported from other places, this restriction does not apply.
Available ~
-
Installed ~-
Decomi ss i onedResource ~
-capacity L:l. - capacity Installation rate Decomi ssi oni ng rate
Figure 9: Resources loop
6.4.2 Negative public opinion
Although the Spanish power market is today fully liberalized in theory, the fact is that the construction of new power plants is in some cases still regulated. This is because these projects require administrative permits (environmental, etc.) which are subject to political decisions.
The public opinion has a strong impact on these decisions. For example, in Spain there is a strong movement against nuclear energy so that it will be very difficult to see new nuclear projects in the near future. In the case of wind power, the public opinion was initially very much in favor but recently, a movement against it has arisen, protesting about the negative visual impact that windfarms may have. So, the public opinion and its associated political component have a quite important impact on the rate of installation of new power generating facilities.
Available Resource " - - - ' Installation rate Nega ti ve publ i c opinion Installed capacity t====~~==_~ Decomissioned
Decomissioning rate capacity
6.4.3 Cost of electricity
The cost of power will have a positive impact on the IRR for all technologies. Obviously, the higher the sale price, the higher the revenues and so, the higher the IRR. The selling price for each generation unit will be composed by the addition of the power pool price and the subsidies applicable to each technology. The power pool price depends on the energy mix and the power demand. It is set by the marginal selling price which is calculated hourly.
Nevertheless, because of the fact that 'discrete' power plants have not been considered in this model, the following simplifying assumption has been made:
The power pool price (wholesale power price) is calculated as the averaged LCOE which depends on the actual energy mix and the individual LCOE of each technology.
Available Resource
Power Pool price~
+
IRR
I nsta II ati on rate
Installed capacity
I======~¢======-~ Decomi ss i oned
Decomi s s i oni ng ra te capacity
Figure 11: Cost of electricity loop
6.4.4 Cost of fuel
The cost of fuel will have a negative impact on the IRR of power plants. The cost of nuclear fuel, oil, and gas has been considered for each type of power plant. In the case of fully renewable power plants such as PV, solar, hydro, etc. there is no cost of fuel.
Available Resource
FuelCost ~
IRR
+
Installed I======~~====_-i Decomi ss i oned
Installa~ion rate capacity· Decomissioning rate capacity
6.4.6 State of the art of the technology. Performance and Specific investment
The state of the art of technology will have a positive impact on variables such as specific investment, performance and reliability of the power plants. The more advanced the technology the lower the specific investment and the higher the performance and reliability. Low specific investments and high reliabilities I performances will result in higher IRRs.
It is necessary to consider the technology learning effect. This means that, as the technology is deployed, more experience and know how is developed, so that the state of the art advances, specific investment declines and performance increases:
Available Resource 6.4.6 Capacity gap Installation Rate Installed Capacity + Total Capacity + Built Decommissioning Rate (
~
cific
peno
\
In_
}
men!
IRR
Figure 13: Technology loop
Decommissioned Capacity
The wholesale market price depends on the energy mix, the LCOE of each technology and the capacity gap (installed capacity minus peak power demand).
So, the higher the share of more expensive technologies (higher LCOE), the higher the wholesale market price will be.
In the case of the capacity gap, when it is large, it means that there is a large offer of power compared to the demand, so that prices will drop and vice versa.
So, the wholesale market price has been modeled as an averaged price by technology which is linearly affected by the capacity gap.
«iasCC IINtali",d SMHydro leOE
·:SM!+;dfO !n~ta!led Cap;-lcity>
+
Wholesale .... ~t---
-Power Price <CdPdcitV Gap.>
Figure 14: Capacity gap loop
6.4.7 Expected life of the power plants
According to the model, the decommissioning rate depends on the profitability of the power plant and its expected life. So, the higher the expected life, the lower the decommissioning rate:
Available D Resource L...:> In tallation Rate s ~
...
Installed Capacity-~
L.:l. Decomissioning Rate1
Obsolescence TimeFigure 15: Expected life loop
..
Decomisioned6.4.8 Retail power price
The retail power price results from adding the system costs (transmission, distribution, administration, . etc.) to the wholesale power price.
Retail price is important because, in the case of renewable technologies such as wind or solar, it can have an impact on the negative public opinion about them. This is because many people now associate the installation of renewable energy power plants to high electricity costs. So, in the wind, solar PV and solar TE models, this loop has been added.
6.4.9 Cost of capital
Wholesale ... - - - -<C1;XlC:tV Gap>
Power Price
+)
Retail power ... + - - - -system Costs
Price
Figure 16: Retail power price
Due to the large capital intensity of energy projects, the cost of capital faced by the investors has a large impact on the profitability of the projects. Cost of capital is largely affected by the cost of debt so that when borrowing costs increase, the cost of capital increases too, making investments less attractive. So, the variable 'modified IRR' has been included in order to take into account this effect. In order to have an 'effective' IRR, interest rates are subtracted from the basic IRR.
6.5
Main equations
As described above, the model is assuming a 'lineal world' regarding the calculation of the IRR. This is due to the difficulty in implementing Excel based financial models in Vensym PLE. So, it has been assumed that all depending variables have a linear relation with the variables affecting them. This is not the case in reality but it can be a good approximation for small changes in the values.
6.6.1 Installation rate
For modeling the installation rate, the maximum value has been estimated according to historical data. This value depends on the resources in the country (engineering firms, tools, etc.) as well as on the technical complexity of the projects.
It has been assumed that this maximum is achieved when investors achieve an IRR equal to 12% (a quite common value in the Spanish energy industry). The installation rate is a lineal function of the IRR and the negative public opinion. It is assumed that no plant will be built if the IRR is below 5% and I or if the negative public opinion is equal to 100%.
These constraints are summarized in the following equation:
nsta atlon rate
=
max . - ,I II · (Available resource . Installation rate (IRR - 0.05 Neg. public opinion
J
oJ
Initial available resource 0.07 100
6.6.2 Decommissioning rate
The decommissioning rate has a linear relation with the obsolescence time, the profitability of the plant (a limit IRR has been set) and the negative public opinion. The last two variables are affected by different coefficients 'a' and 'b' which depend on the technology considered. The equation for the decommissioning rate is shown below:
Decomm rate
=
Installed capac.ity +a·MAX(Limit IRR -IRR,O)+bNegative Public OpinionObsolescence time
6.6.3 Performance
The standard performance of each technology is affected by its learning curve so that performance will increase with the total capacity built.
In this model, this is the case for conventional generation technologies. Nevertheless, In the case of renewable energy sources and according to the lEA standards28, their efficiency has been considered
constant and equal to 100%. The technological improvements in this case will be only considered in the specific investment.
So, the equation for the performance includes the standard performance at a given moment in time and ads a linear term which depends on the total capacity built:
Performancet
=
PerformancetO + a . (Total capacity builtt - Total capacity builttO)6.6.4 Specific investment
The specific investment for each technology is affected by its learning curve so that it will increase with the total capacity built.
So, the equation for specific investment includes the standard specific investment at a given moment in time and ads a linear term which depends on the total capacity built:
Spec. investmentt = Spec investmenttO + a . (Total capacity builtt - Total capacity builtto)
6.6.6 Negative public opinion
The public opinion has a significant impact on the deployment of specific technologies. For example, the development of new nuclear power plants has been banned in Spain because of this reason during the last 30 years. In the case of the renewable technologies there is an interesting effect, because the citizens tend to be against them when the retail power prices rise. There is a general belief that said rise is due to the clean technologies.
So, the negative public opinion will depend on both the subjective negative public opinion and the power retail prices (this last component only in the case of renewable technologies).
Negative public opinion = Subjective Negative public opinion
+
a' (Final power price - Power price lim it)6.6.6 Wholesale power price
The wholesale power price depends on the LCOE for each technology, the energy mix and the capacity gap as explained in point 6.4.6. The equation is shown below:
· "" LCOE· ·Installed Capacity· .
Wholesale power price = L..J I I
+
a·Capaclty gapi Installed Capacity i
6.6.7 LCOE29
The LCOEs for each technology have been taken from the bibliography and are included in Attachment 3. In the case of conventional technologies, the LCOE is a function of the cost of fuel according to the following equation:
LCOEt
=
LCOEtQ + a·(Cost of fuelt - Cost of fueltO)The fact that the LCOE depends only on the cost of fuels is an approximation that can be refined in the future development of this work.
6.6.8 IRR
For modeling the IRR, it has been taken a moment in time (to) when the installation rate was close to the maximum. It has been assumed that at this time the IRR observed by the investor is equal to 12% and the value of all the remaining variables has been taken at this same time.
So, the IRR is a linear function of the specific investment, the performance, the wholesale power price, the fuel price, the taxes and the subsidies:
IRR
=
0.12 - a·(Specific investmentt - Specific investmenttO) + b·(Performancet - PerformancetO) + c·(Wholesale power pricet - Wholesale power pricetQ) - d·(Fuel pricet - Fuel pricetQ) - e·( Taxest - TaxestQ) + f-(SubsidYt - SubsidYtQ)7 Validation of the model
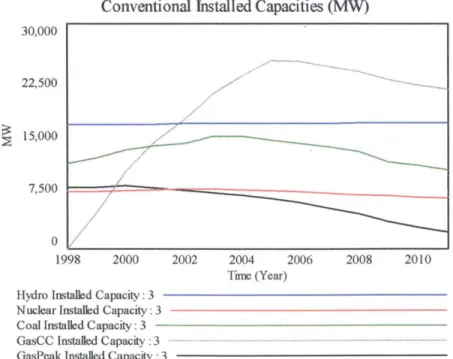
The model has been validated by using the historical data of the exogenous variables for the period 1998 - 2011 and by comparing the forecasted installed capacity for each technology with the actual data. The Vensys diagrams of the models that have been used are included in Attachment 4.
7.1
Assumptions
The following assumptions have been made:
• The starting value of the installed capacities is the value at the end of 1997.
• Subjective negative public opinion has only been considered for wind and nuclear. Wind and solar
have a component of negative public opinion due to high retail prices.
• Corporate income taxes have been kept constant and equal to 35%
• The summary of the historical premiums for each technology is included in Attachment 5.
• The table describing the remaining assumptions is included in Attachment 6.
7.2
Results
The preliminary results for each technology and the actual values are shown in the figures below Conventional Installed Capacities (MW)
30,000 22,500
~
15,000 7,500I=
===:r===---===::::::
=-
- - - -
.J
o
~---~ 1998 2000 2002 2004 2006 2008 2010 Time (Year)Hydro Installed Capacity: 3
Nuclear Installed Capacity: 3
-Coal Installed Capacity: 3
-GasCC Installed Capacity: 3
GasPeak Installed Capacity : 3
VJ VJ ~ ""2 0 .~ c ~ E
5
0.4 02 0 -0.2 -0.4 1998 Hydro IRR: 3 Nuclear IRR: 3 CoaIIRR: 3 2000Conventi onal IRRs
2002 2004 2006
Time (Year)
GasCC IRR:3 GasPeak IRR : 3
2008 2010
Figure 18: Conventional IRRs as per the model forecast
40,000 30,000
~
20,000 10,000 o 1998Alternative Installed Capacities (MW)
2000 2002 2004 2006 2008 2010
Time (Year)
SMHydro Installed Capacity: 3
-WiOO Insta1Ied Capacity: 3 SolarPV Insta1Ied Capacity: 3 SoiarTE Installed Capacity: 3 Cogen Insta1Ied Capacity: 3
80 60 40 20
o
0.4 02 o -02 -0.4Alternative
IRRs
/ / I , /,---~---~ 1998 2000 SMHydro IRR : 3 WmIRR:3 SolarPV IRR : 3 2002 2004 2006 2008 2010 Time (Year) SolarTE IRR : 3 . <-- --- -.----Cogen IRR: 3-Figure 20: Alternative IRRs as per the model forecast
Wholesale Price
1998 1999 2000 2001 2002 2003 2004 2005 2006 2007 2008 2009 2010 2011
Titre (Year) Wholesale Power Price : 3
7.3
Conclusions about the validation
The following conclusions can be extracted by comparing the results in the previous figures with the real data included in Figure 4, Figure 5 and Figure 8:
• The wholesale price shows a similar pattern although not all peaks and valleys (for example the peak in 2005) are exactly reproduced.
• I n the case of conventional technologies, the forecasted installed capacities follow a very similar pattern. In general, the final forecasted values are smaller than the real ones because the model is considering a 'continuous' decommissioning rate while in reality there is a 'discrete' decommissioning rate (for example when a large coal power plant is decommissioned, the coal installed capacity will decrease by 1.000 MW in one year instead of a continuous declining curve). If we take this effect into consideration, the model reproduces accurately the reality.
In the case of the alternative technologies, the model reproduces accurately the installed capacities.
• So, we can conclude that the model is quite accurate for describing the historical trends for installed capacity and wholesale power price.
8 Forecasting
Once the model has been validated, it can be used to forecast future energy in mixes and wholesale market prices in function of the future values for the exogenous variables. As an example, three different scenarios have been considered and a specific goal energy mix has been set. The model will be used in order to set the required subsidy policies than lead to the desired results in 2025.
8.1
Scenarios
The following three scenarios have been considered: • Scenario 0: All variables constant
• Scenario 1: Optimistic. Constant power demand increase. 3% annually • Scenario 2: Average. Constant power demand
• Scenario 3: Pessimistic: Constant power demand decrease. 3% annually Figure 22 shows the scenarios described above .
160,000 • Scenario 1 • Scenario 2 140,000 Scenario 3 120,000 100,000
~
80,000 60,000 40,000 20,000 0 2012 2013 2014 2015 2016 2017 2018 2019 2020 2021 2022 2023 2024 2025Figure 22: Future scenarios
8.2
Desired energy mix
The desired energy mix will have the following characteristics:
• Minimum share of renewable capacity (including large hydro): 50% • The capacity gap target is equal to 40.000 MW
• Minimized wholesale price. The expensive technologies will be kept at the actual level of capacity in order not to increase the costs of the system further.
• No new nuclear plants will be built in agreement to the actual policy and public opinion.
• No new coal power plants will be built because of the issues with the CO2 emissions limit.
8.3
Results
8.3.1 Scenario 0
Scenario 0 considers that subsides (premiums) are constant and equal to ones in force in 2011 :
Techonolgy Premium ,. - . . (~[~Wh) Small Hydro 27.05 Wind 20.14 Solar PV 290.37 Solar TE 290.92 Cogeneration 33.54
Table 3: Premiums in Scenario 0
The results corresponding to scenario 0 are included in Attachment 7. The following conclusions can be extracted:
• The total installed capacity reaches 115.852 MW in 2025, which means a capacity gap equal to 71.956 MW. Excessive incentives entail this overinvestment. The decrease in power price due to the capacity gap is offset by the increase in power price due to the overinvestment in expensive technologies such as solar TE or solar PV so that the installed capacity increases.
• The wholesale price increases dramatically and reaches a maximum of 87.09 €lMWh in 2025. • The shares of the renewable energy sources, in terms of installed capacity are:
• Because of the facts above, it seems necessary to find a different energy mix, which entails both a lower capacity gap and a lower wholesale price, while still having a significant renewable energy share. This will be done in the following three scenarios.
8.3.2 Scenario 1
The results corresponding to scenario 1 are included in Attachment 8. The following conclusions can be extracted:
• The subsidy policy that entails the required energy mix and a minimum wholesale power price has been calculated by the models and is shown in Table 5.
Techonolgy Premium (€/MWh) Small Hydro 0.00 Wind 2.9 Solar PV 181.19 Solar TE 223.43 Cogeneration 30.59
Table 5: Premiums in Scenario 1
• With the new set of poliCies, the total installed capacity reaches 84.114 MW in 2025, which means a capacity gap equal to 40.218 MW, very close to the goal set.
• Due to the limitations set for the growth of expensive technologies, the increase of the wholesale power price is much more limited, reaching 66.84 €!MWh in 2025.
• The shares of the renewable energy sources, in terms of installed capacity are:
8.3.3 Scenario 2
The results corresponding to scenario 2 are included in Attachment 9. The following conclusions can be extracted:
• The subsidy policy that entails the required energy mix and a minimum wholesale power price has been calculated by the models and is shown in Table 7.
Techo~olgy Premium (€/MWh) _ Small Hydro 0.00 Wind 73.47 Solar PV 181.19 Solar TE 223.43 Cogeneration 33.81
Table 7: Premiums in Scenario 2
• Scenario 2 implies a growth in peak power demand up to 64,463 MW in 2025 and an annual 3% increase in fuel prices.
• With the new set of policies, the total installed capacity reaches 104,409 MW in 2025, which means a capacity gap equal to 39,946 MW, very close to the goal set.
• Even though the fuels are more expensive in this case, this effect is offset by the larger share of 'cheap' alternative sources of energy (wind) and smaller share of the most expensive (solar PV and solar TE). This results in a lower wholesale power price which is equal to 63.94 €lMWh
• The shares of the renewable energy sources, in terms of installed capacity are:
Table 8: Share of renewable capacity Scenario 2
8.3.4 Scenario 3
The results corresponding to scenario 3 are included in Attachment 10. The following conclusions can be extracted:
• The subsidy policy that entails the required energy mix and a minimum wholesale power price has been calculated by the models and is shown in Table 9.
Techonolgy Premium (€/MWh) Small Hydro 0.00 Wind 0.00 Solar PV 181.19 Solar TE 223.43 Cogeneration 27.00
Table 9: Premiums in Scenario 3
• Scenario 3 implies a decrease in peak power demand down to 29,543 MW in 2025 and an annual 3%
decrease in fuel prices.
• With the policies adopted, the total installed capacity reaches 89,978 MW in 2025, which means a
capacity gap equal to 58,435 MW, quite far from the goal set. This is due to the fact that even with no incentives, the decommissioning rate can't be large enough to reach the required capacity gap.
• In this case the share of 'cheap' alternative energy sources is smaller than in Scenario 2.
Nevertheless, in this case the capacity gap is very large so that this effect offsets the previous one and a lower wholesale power price is obtained: 62.43 €/MWh.
• The shares of the renewable energy sources, in terms of installed capacity are:
Table 10: Share of renewable capacity Scenario 3
Attachment 10 shows a comparison between the four scenarios. It can be observed, that the application of right incentive pOlicies can keep the installed capacity within the required limits and it can also control the wholesale power price.
9 Conclusions
9.1
About the model
• A model which is able to replicate the historical evolution of the energy mix in Spain has been developed and validated.
• Different potential scenarios have been simulated with the goal of minimizing the system costs,
minimizing the capacity gap and achie~ing a required minimum renewable energy share.
• The model could be used in order to decide about the right incentives for achieving a desired energy
mix in function of exogenous variables.
9.2
About the Spanish power market
Having a liberalized power generation market means that investments in specific technologies will be made when the returns of these projects are higher than the return required by the investors. Nevertheless, the Spanish power market is not fully liberalized as long as the feed-in tariffs / premiums received by the renewable energy power plants are regulated by the government and set on an annual basis.
This kind of policies can distort the market and be the cause of under or overinvestment if the feed-in tariffs are not calculated very carefully. As discussed in pOint 6.3.10, this happened already in Spain in the case of PV power in 2008 - 2009 when the combination of a too high feed-in tariff and the declining costs of the technology entailed a huge overinvestment in PV power which was the cause of increasing system costs.
In principle, it may seem that the market should be 'self-regulated' so that overinvestment entails overcapacity and so, a large capacity gap. As discussed before, the capacity gap is inversely proportional to the wholesale power price so that the returns of the projects should decrease and overinvestment 'self-controlled'. Nevertheless, as shown by the models, this effect does not offset the increased profitability due to the high (and constant) premiums received.
Because of these reasons, policies based on competitive approaches should be maybe used instead:
• Policies based on Green Certificates: Used for example in Poland
Nevertheless, the policies mentioned above do not seem to have had a big impact on the development of renewable energy projects. The green certificate system seems not to give enough comfort to investors, who feel uncertainty regarding how the green certificate markets will evolve in the long term. In the case of energy auctions, this methodology seems to have reduced the profitability of the projects up to a level where investors are hesitant to go ahead with them. This has happened in countries such as the UK or Brazil.
It is a fact that the countries where there has been a larger and faster development of alternative energies, had regulated feed-in tariff I premium subsidy schemes. This is the case in countries such as Spain, Germany or the US (in this case, using regulated Production Tax Credits).
So, it seems that a very carefully calculated and often updated regulated feed-in tariff / premium system could be the right way to ensure the development of alternative energies in order to obtain a desired energy mix. It is necessary to highlight the necessity of calculating very carefully and updating very often said tariffs as, otherwise under or overinvestment can easily happen.
According to the models developed for this thesis, the actual levels of the feed-in tariffs will lead to overinvestment in alternative energies (wind, solar PV and solar TE) and to very high wholesale power prices. So, feed-in tariffs / premiums should be reduced to a level with which the desired energy mix is obtained in 2021.
The models also show that solar TE and solar PV will still have a huge impact on wholesale power price due to the fact that will still be expensive technologies in the upcoming years. A small share of solar power entails a large increase in the wholesale power price. Figure 23 shows the evolution of the wholesale power for different shares of solar PV installed capacity in 2021 (scenario 2).
So, it seems clear that, if the government wants to reach a specific share of renewable energies in the generation mix, it should set a set of policies aimed at keeping the solar installed capacities constant and at increasing the wind power capacity to the desired level.
I n general, the learning obtained above could be applied to any other power market. Different policies apart from the feed-in tariff / premium systems described here could also be successful if the are properly and carefully designed.
Wholesale Power Price
100 90 80 70 60 2012 2014 2016Wholesale Power Price : 20% Wholesale Power Price : 150/0
Wholesale Power Price : 100/0
Wholesale Power Price : 50/0
2018 2020
Time (Year)
2022 2024
10 Further development
In order to make the models used in this document more accurate, it would be interesting to develop further the following topics:
• As it has been described in this document, the IRR models have been assumed linear. This is not the
reality. More accurate results could be obtained by using non linear models.
• The calculation of the wholesale power price has been computed weighting the LeOE of each
technology with its share in the energy mix. Although this method seems to yield very reasonable results, this is not exactly the case in Spain as the wholesale power price is equal to the marginal cost of the system. A further refinement of the models could include the exact simulation of the power pool mechanisms.
• LeOEs have been taken from the references (See attachment 3). The models are considering
constant LeOEs except in the case of technologies that use fuels. In this cases, LeOEs have been considered a function of fuel prices. In reality, LeOEs are more complex and depend on additional variables such as specific investment, performance, etc.
Attachment 1. Correlation Results
Capacity Gap 0.39 -0.23 0.18 -0.67 -0.64 0.69 0.96 0.89 0.91 0.65 0.77
Pool power price -0.13 -0.13 0.09 -0.16 -0.37 0.36 0.14 0.21 0.14 0.14 0.29
Oil price 0.26 -0.36 0.25 -0.62 -0.69 0.79 0.91 0.87 0.77 0.66 0.86
Coal price 0.20 -0.23 0.18 -0.48 -0.47 0.70 0.81 0.78 0.74 0.53 0.78
Gas price 0.18 -0.47 0.11 -0.59 -0.81 0.82 0.90 0.89 0.76 0.49 0.88
Nuclear fuel price 0.39 -0.07 0.30 -0.74 -0.80 0.57 0.91 0.77 0.96 0.71 0.63
Subsidies n/a nfa nfa nfa nfa -0.17 -0.09 nfa 0.98 0.50 0.63
Euribor -0.43 0.01 0.10 0.23 -0.04 -0.16 -0.42 -0.43 -0.40 -0.48 -0.27