HAL Id: hal-00297600
https://hal.archives-ouvertes.fr/hal-00297600
Submitted on 26 Jan 2007
HAL is a multi-disciplinary open access
archive for the deposit and dissemination of
sci-entific research documents, whether they are
pub-lished or not. The documents may come from
teaching and research institutions in France or
abroad, or from public or private research centers.
L’archive ouverte pluridisciplinaire HAL, est
destinée au dépôt et à la diffusion de documents
scientifiques de niveau recherche, publiés ou non,
émanant des établissements d’enseignement et de
recherche français ou étrangers, des laboratoires
publics ou privés.
determination of production in pelagic systems
O. Pringault, V. Tassas, E. Rochelle-Newall
To cite this version:
O. Pringault, V. Tassas, E. Rochelle-Newall. Consequences of respiration in the light on the
deter-mination of production in pelagic systems. Biogeosciences, European Geosciences Union, 2007, 4 (1),
pp.105-114. �hal-00297600�
Biogeosciences, 4, 105–114, 2007 www.biogeosciences.net/4/105/2007/ © Author(s) 2007. This work is licensed under a Creative Commons License.
Biogeosciences
Consequences of respiration in the light on the determination of
production in pelagic systems
O. Pringault, V. Tassas, and E. Rochelle-Newall
UR 103 Cam´elia, Institut de Recherche pour le D´eveloppement, Noum´ea, New Caledonia Received: 31 August 2006 – Published in Biogeosciences Discuss.: 14 September 2006 Revised: 11 December 2006 – Accepted: 24 January 2007 – Published: 26 January 2007
Abstract. Oxygen microprobes were used to estimate
Com-munity Respiration (R), Net ComCom-munity Production (NCP) and Gross Primary Production (GPP) in coastal seawater samples. Using this highly stable and reproducible technique to measure oxygen change during alternating dark and light periods, we show that respiration in the light could account for up to 640% of respiration in the dark. The light enhanced dark respiration can remain elevated for several hours fol-lowing a 12 h period of illumination. Not including Rlight
into calculations of production leads to an underestimation of GPP, which can reach up to 650% in net heterotrophic systems. The production: respiration (P:R) ratio is in turn affected by the higher respiration rates and by the under-estimation of GPP. While the integration of Rlight into the
calculation of P:R ratio does not change the metabolic bal-ance of the system, it decreases the observed tendency, thus net autotrophic systems become less autotrophic and net het-erotrophic systems become less hethet-erotrophic. As a conse-quence, we propose that efforts have to be focused on the estimation and the integration of Rlight into the
determina-tion of GPP and R for a better understanding of the aquatic carbon cycle.
1 Introduction
Fundamental to an understanding of the global carbon cycle is the determination of whether the oceans are net autotrophic or net heterotrophic (del Giorgio et al., 1997; Williams, 1998; del Giorgio and Duarte, 2002). In order to do this, the ratio between photosynthesis (P) and biological respiration (R) is calculated, with P:R>1 indicating net autotrophy and P:R<1 net heterotrophy. Gross Primary Production (GPP) of or-ganic carbon in aquatic systems is generally measured by the Correspondence to: O. Pringault
(olivier.pringault@noumea.ird.nc)
fixation of H14CO3whereas R is determined from the change
in oxygen concentration during incubations. However, this approach requires the application of conversion coefficients that vary as a function of several factors including, commu-nity composition, nutrient status and the chemical nature of the organic carbon molecules (del Giorgio and Cole, 1998). These problems can be circumvented by measuring GPP and R using the same technique, for example the Winkler tech-nique, which measures changes in oxygen concentration dur-ing incubation in the light and dark. Thus, GPP is determined from the sum of net community production (NCP, measured in the light bottle) and R (measured in the dark bottle). This assumes that R in the light is equivalent to that in the dark, an assumption which has already being shown to be prob-lematic (Grande et al., 1989b; Luz et al., 2002). Indeed, it is well known that production and respiration are tightly coupled in aquatic systems (Paerl and Pinckney, 1996) lead-ing to a stimulation of respiration by photosynthesis (Epplead-ing and Jørgensen, 1996). The coupling between autotrophs and heterotrophs is generally a function of grazing and the uti-lization of the DOM excreted by the autotrophs which fuels the respiration activity of the heterotrophs. The composition of exudates and grazing rates can vary as a function of the phytoplankton composition, which is dependent on nutrient supply and other environmental factors. As a consequence, even though this coupling may vary, it should be considered. The assumption Rlight=Rdark is necessary, because the
most commonly used technique (dark/light bottle technique combined with oxygen measurements by Winkler titration) does not allow the determination of respiration occurring in the light. Nevertheless, anecdotal evidence suggests that respiration in the light can be higher than that in the dark (Williams and del Giorgio, 2005), which would result in an underestimation of GPP and R. Light enhanced dark res-piration (LEDR) occurs separately from the Mehler reac-tion, which is not involved in the organic carbon metabolism (Raven and Beardall, 2005). LEDR has been documented in
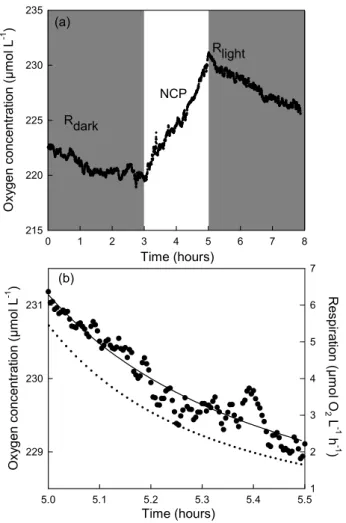
Time (hours) 0 1 2 3 4 5 6 7 8 O xy g e n co n c e n tra ti o n ( µ m o l L -1 ) 215 220 225 230 235 Rlight NCP (a) (b) Time (hours) 229 230 231 R e s p ira tio n ( µ m o l O 2 L -1 h -1 ) 2 4 5 6 7 3 Rdark O x yg e n c o n c e n tr a ti o n ( µ m o l L -1 ) 5.0 5.1 5.2 5.3 5.4 5.5 1
Fig. 1. (a) Oxygen time course during incubation of water from
the Southwest lagoon of New Caledonia. Sample was collected in Anse Vata on 30 June 2005. The concentration of chlorophyll a was 9 µg L−1. Shaded boxes represent the dark periods and the unshaded box represents the illumination period. (b) Oxygen time course for the second period of darkness consecutive to light ex-posure and exponential decrease (solid line) fitted to the raw data. Respiration (dotted line) was calculated from the first derivative of the fitted exponential decrease curve.
phytoplankton cultures (Grande et al., 1989a; Ekelund 2000, Heraud and Beardall 2002), in lakes (Luz et al., 2002), and in seawater can be 300 to 800% of dark respiration (Grande et al., 1989b). The close coupling between GPP and R has also been extensively studied in phototrophic benthic envi-ronments. The use of oxygen microsensors for the determi-nation of both processes permits a precise estimation of light respiration (Epping and Jørgensen, 1996; Epping and K¨uhl, 2000; Wieland and K¨uhl, 2000). In this type of environment, light respiration can represent up to 700% of dark respira-tion (Wieland and K¨uhl, 2000). Yet, despite the increasing evidence demonstrating the importance of quantifying light respiration, this phenomenon has been rarely examined in oceanic environments (Grande et al., 1989b) and as a
conse-quence its ecological significance has largely been ignored. Therefore, the aims of this work were 1) to estimate light respiration in coastal waters, and 2) to determine the conse-quences of Rlight=Rdark on the determination of P and P:R
ratios.
2 Material and methods
In this study, we collected water in the South West lagoon of New Caledonia in the vicinity of the city of Noum´ea. Map of the study area and sampling location can be found in Briand et al. (2004). Oxygen concentration was measured using oxygen microsensors. We used the same protocol as described by Briand et al. (2004). For the estimation of NP, the incubators were exposed to a photon flux density (PFD) of 1000 µmol photons m−2s−1, which represents the average
PFD observed in the first few meters of the water column in the study area. The microprobes (Unisense, Denmark) are designed with an exterior guard cathode (Revsbech, 1989), which results in extremely low oxygen consumption by the electrodes themselves (4.7–47×10−7µmol O2h−1). Probes
have a response time shorter than 1 second and a precision of 0.05%. The precision of the oxygen microprobe (0.05%) is equivalent to highly precise Winkler techniques described by Sherr and Sherr (2003). However, as described in Briand et al. (2004), this high precision is counterbalanced by the back-ground noise, therefore we considered a difference of 0.5µM as significant to measure NCP or R rates. This highly precise and reproducible technique permits the continuous measure-ment of oxygen concentration during incubations (Briand et al., 2004). By exposing the sample to dark and light cycles (Fig. 1), it is possible to estimate within the same sample, dark respiration (Rdark), NP and the effect of light on R
de-termined just after light exposure (Rlight). After switching
off the light, oxygen concentration showed an exponential decrease with time (Fig. 1). Therefore for the determination of Rlight, we fitted an exponential decay to the raw data, and
respiration was then calculated from the first derivative of the fitted equation. The value within the first few minutes con-secutive to darkness was assumed to represent the best esti-mate of the respiration that occurs in the light as previously described by Falkowski et al. (1985).
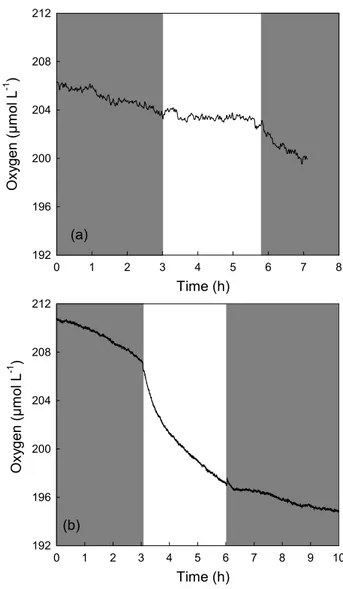
Oxygen consumption estimates using the Winkler method are usually performed in replicates. In our study, the avail-ability of the equipment to measure oxygen concentration prevented us from estimating O2consumption systematically
in replicates. However, on several occasions, we checked re-producibility in duplicate water samples. We observed that the time course of oxygen concentration is very similar in two samples of the same station (Fig. 2) as described by Briand et al. (2004).
O. Pringault et al.: Consequences of respiration in the light 107 Time (h) 0 4 6 O x yg e n ( µ M) 218 220 222 224 226 228 230 232 234 2 8
Fig. 2. Oxygen concentration during dark and light incubation in
duplicate. Sample was collected in Anse Vata on 29 June 2005. Shaded boxes represent the dark periods and the unshaded box rep-resents the illumination period.
Usually oxygen production (GPP) determined with the light and dark bottle technique is calculated from the follow-ing equation:
GPP=NCP + |Rdark| (1)
with |Rdark|representing the absolute value of R, also known
as community respiration, measured in the dark and NCP, the net community production. With this approach it is assumed that R measured in the dark is equivalent to that in the light.
In this study, GPP was computed from NCP and Rlight
us-ing the followus-ing equation: GPP=NCP + Rlight
(2)
with NCP and Rlight
being measured as described above
(Fig. 1). Hereafter, GPPdarkrepresents the production when
Rdark is used in the calculation, as in the light and dark
bottle method, and GPPlightwhen Rlightis used. Therefore
for the same water sample, we distinguish between GPP estimates of the traditional method (GPPdark)that assumes
that Rlight=Rdark, from GPP estimates that take into account
light respiration (GPPlight). Consequently, we estimated the
effects of Rlight on the determination of P by comparing
GPPdarkand GPPlightusing the following equation:
Underestimation of GPP (%)=(GPPlight−GPPdark) GPPdark
×100 (3) The P:R ratio which describes the trophic status of the sys-tem is calculated from daily rates of GPP and R. Daily rates taking into account Rlightwere calculated from hourly rates
using the sum of Rdark+Rlightconsidering 12 h darkness and
Time (h) 0 1 2 3 4 5 6 7 8 O x yg e n ( µ m o l L -1 ) 192 196 200 204 208 212 (a) 0 1 2 3 4 5 6 7 8 9 10 192 196 200 204 208 212 (b) O x yg e n ( µ m o l L -1 ) Time (h)
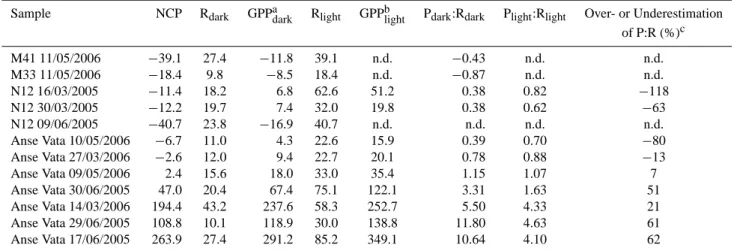
Fig. 3. Oxygen time course during incubation of water from
South-west lagoon of New Caledonia. Shaded boxes represent the dark periods and unshaded box represents the illumination period. Sam-ples were collected in N12 on 16 March 2005 (a) and in M41 on 11 May 2006 (b), concentration of chlorophyll a was 0.75 µg L−1(a) and 0.27 µg L−1(b). See Table 1 for rate values.
12 h light, and GPPlightby considering 12 h light. In order to
estimate the effects of the assumption Rlight=Rdarkon the
es-timation of P:R ratios, we also calculated daily rates from the hourly rates of GPPdark and Rdark considering 12 h of light
and 24 h of darkness, respectively. This latter calculation is commonly used for the light and dark bottle method. For the same water sample, we therefore distinguished between P:R ratios calculated from Eq. (1), that do not take into account Rlightand those calculated from Eq. (2) that do take into
ac-count Rlight. For all the experiments, the determination of
Rdark, NCP and Rlightwas achieved within a maximum
incu-bation time of 8 h in order to decrease bottle effects, which can result in changes in biomass and community structure as described by Gattuso et al. (2002).
Table 1. Respiration and production for different natural water samples. The light regime was as follows for all experiments: 2–3 h dark/2–
3 h light/2–4 h dark. Processes are expressed in µmol O2L−1h−1, Chlorophyll a in µg L−1. To avoid a negative GPPdark(see Eq. 1), we
assume that Rlighthas to be at least equal to NCP. In this case, a precise estimation of Rlightis not possible, therefore GPPlightwas not
calculated.
Sample Chl a T◦C NCP Rdark GPPdarka Rlight GPPblight Rlight Underestimationc (% of Rdark) of GPP (%) M41 11/05/2006 0.27 24◦C −2.12 1.14 −0.98 2.12 n.d. 186 n.d. M33 11/05/2006 0.67 24◦C −1.12 0.41 −0.71 1.12 n.d. 273 n.d. N12 16/03/2005 0.75 26◦C −0.19 0.76 0.57 4.46 4.27 587 649 N12 30/03/2005 0.98 26◦C −0.20 0.82 0.62 1.85 1.65 225 165 N12 09/06/2005 2 22◦C −2.40 0.99 −1.41 2.40 n.d. 242 n.d. Anse Vata 10/05/2006 1.8 24◦C −0.10 0.46 0.36 1.43 1.33 310 268 Anse Vata 27/03/2006 3 26◦C 0.28 0.50 0.78 1.39 1.67 279 114 Anse Vata 09/05/2006 3.3 24◦C 0.85 0.65 1.50 2.10 2.95 323 97 Anse Vata 30/06/2005 9 22◦C 4.77 0.85 5.62 5.41 10.18 636 81 Anse Vata 14/03/2006 10 26◦C 18 1.80 19.80 3.06 21.06 170 6 Anse Vata 29/06/2005 13 22◦C 9.49 0.42 9.91 2.08 11.57 495 17 Anse Vata 17/06/2005 45 22◦C 23.13 1.14 24.27 5.96 29.09 523 20 aGPP
darkrepresents the Production when Rdarkis used in the calculation (see Eq. 1). bGPP
lightrepresents the Production when Rlightis used in the calculation (see Eq. 2). cUnderestimation of P when R
darkis used to determine P instead of Rlight(see Eq. 3).
n.d.: Not determined.
Chlorophyll a was measured on samples collected on GF/F filters using the method of Jeffrey and Humphrey (1975). The filters were frozen (−20◦C) until measurement which
was always within 72 h and generally within 24 h.
3 Results
3.1 Determination of Rlight
It is important to note that the continuous measurement of oxygen concentration does not allow a direct determination of respiration in the light itself. However, the fast response of the oxygen microelectrode (less than 1 s) means that we can precisely measure the respiration rate immediately con-secutive to the onset of darkness as previously described by Falkowski et al. (1985). We applied this procedure in dif-ferent water samples covering a range of chlorophyll a (Chl
a) concentrations from 0.27 µg L−1 to 45 µg L−1 (Fig. 3). Metabolic processes (hourly rates) determined for the dif-ferent water samples are listed in Table 1. On some occa-sions, we observed that the value of NCP was more neg-ative than Rdark, as it is illustrated in Fig. 3b. According
to Eq. (1), the derived GPP value is negative, which is the-oretically impossible (Table 1). For example, for the wa-ter sample M41 (11/05/2006), NCP and Rdark values were
−2.12 and 1.14 µmol O2L−1h−1, respectively. According
to Eq. (1), GGPdark would equal −0.98 µmol O2L−1h−1.
For these particular cases, Rlightwas not estimated from the
O2changes consecutive to darkness. We consider that Rlight
needs to be greater than NCP in order to get a positive value for GPP. Therefore, for this water sample, Rlightwas assumed
to be at least equal to 2.12 µmol O2L−1h−1. In all samples,
respiration was stimulated by light and Rlightrepresented up
to 636% of Rdark. Taking into account the in situ hourly rates
(Table 1), we calculated that on average Rlight represented
354% of Rdark. It is also interesting to note that the
percent-age of stimulation was not dependent upon Chl a concentra-tion. The underestimation of GPP when Rlightwas not taken
into account reached up to 649% in net heterotrophic con-ditions (i.e., NCP<0), whereas in net autotrophic concon-ditions (NCP>0) underestimation was less important despite Rlight
values of 636% relative to Rdark(Table 1).
3.2 Respiration in the light and P:R ratios
From the hourly rates we calculated daily rates (assuming 12 h dark and 12 h light) of GPP and R in order to deter-mine the P:R ratio. Results are presented in Table 2. The daily rates of R when Rlightis taken into account are on
aver-age more than twice the daily rates of R when it is assumed that Rlight=Rdark. All the experiments were performed under
saturating light conditions and previous measurements con-ducted at the sampling sites have shown that phytoplankton photosynthesis is subject to saturating irradiances during 80– 90% of the day. As a consequence we assume that the hourly rates are representative of the prevailing conditions occurring in the 12 h of light. From measurements of Rlightin a
phy-toplankton culture under different light conditions (data not shown), we have estimated the error introduced by using a
O. Pringault et al.: Consequences of respiration in the light 109
Table 2. Respiration and production ratios for different natural water samples. Processes are expressed in µmol O2L−1d−1. Hourly rates
are from Table 1. When NCP (hourly rates, Table 1) was more negative than Rdarkresulting to a negative value for GPPdark(see Eq. 1), we
assumed that Rlighthas to be at least equal to NCP in order to get a positive value for GPP. In this case a precise estimation of Rlightis not
possible, therefore GPPlightwas not calculated.
Sample NCP Rdark GPPadark Rlight GPPblight Pdark:Rdark Plight:Rlight Over- or Underestimation
of P:R (%)c M41 11/05/2006 −39.1 27.4 −11.8 39.1 n.d. −0.43 n.d. n.d. M33 11/05/2006 −18.4 9.8 −8.5 18.4 n.d. −0.87 n.d. n.d. N12 16/03/2005 −11.4 18.2 6.8 62.6 51.2 0.38 0.82 −118 N12 30/03/2005 −12.2 19.7 7.4 32.0 19.8 0.38 0.62 −63 N12 09/06/2005 −40.7 23.8 −16.9 40.7 n.d. n.d. n.d. n.d. Anse Vata 10/05/2006 −6.7 11.0 4.3 22.6 15.9 0.39 0.70 −80 Anse Vata 27/03/2006 −2.6 12.0 9.4 22.7 20.1 0.78 0.88 −13 Anse Vata 09/05/2006 2.4 15.6 18.0 33.0 35.4 1.15 1.07 7 Anse Vata 30/06/2005 47.0 20.4 67.4 75.1 122.1 3.31 1.63 51 Anse Vata 14/03/2006 194.4 43.2 237.6 58.3 252.7 5.50 4.33 21 Anse Vata 29/06/2005 108.8 10.1 118.9 30.0 138.8 11.80 4.63 61 Anse Vata 17/06/2005 263.9 27.4 291.2 85.2 349.1 10.64 4.10 62 aGPP
darkrepresents the Production when Rdarkis used in the calculation (see Eq. 1). bGPP
lightrepresents the Production when Rlightis used in the calculation (see Eq. 2). cOver or underestimation of P:R ratio when R
lightis not taken into account.
Negative values indicate an underestimation whereas positive values indicate an overestimation. n.d.: Not determined
fixed PFD instead of a variable PFD for the calculation of daily rates of Rlightand GPP. The resultant error is of the
or-der of 10%. Since our method takes into account Rlight, we
can calculate the error introduced in the P:R ratio estimation when Rlightis not taken into account in the estimation of GPP
and in the determination of the daily rates of R. Under net heterotrophic conditions (i.e. NCP<0), P:R ratios were un-derestimated. For example for the station N12 (16/03/2005), we calculated a P:R ratio of 0.82, indicating that the system is net heterotrophic. With the assumption that R in the light is equivalent to that in the dark, the P:R ratio would be equal to 0.38, which represents an underestimation of 116% relative to the value estimated when it is assumed that Rlight=Rdark
((0.38–0.82)/0.38×100). On the other hand, under net au-totrophic conditions (NCP>0), P:R ratios are overestimated when we assume that Rlight=Rdark. For example, for the
sta-tion Anse Vata (30/06/2005), we calculated a P:R ratio of 1.63 (Table 2), however, if we assume that Rlight=Rdark, P:R
ratio would be equal to 3.31, which represents an overesti-mation of 51% ((3.31–1.63)/3.31×100).
3.3 Time of light exposure and Rlight
Depending on the time exposed to light, Rlight can remain
higher than Rdark for up to several hours after the onset of
darkness. Figure 4a shows the variations of Rdarkas a
func-tion of time after two hours of light exposure. In this sam-ple, Rlightmeasured immediately (within 5 minutes) after the
onset of darkness was three fold greater than Rdark. After
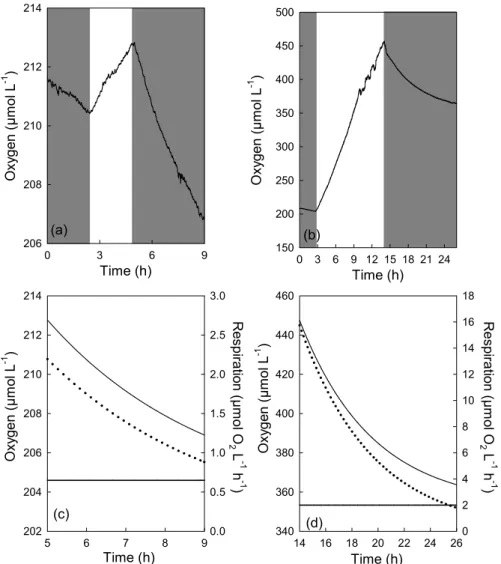
four hours of darkness, respiration decreased exponentially to reach Rdark (Fig. 4c). Figure 4b shows the variations of
oxygen concentration as a function of time for a seawater sample exposed for 12 h in the light and 12 h in the dark. In order to estimate dark respiration, the sample was initially exposed to darkness for two hours. After 12 h of light, oxy-gen decreased exponentially in the dark. Respiration calcu-lated from the first derivative of the exponential decay fit-ted to the oxygen concentration also decreased exponentially (Fig. 4d). Just after darkness, Rlight represented 800% of
Rdark, and the initial Rdark value was reached after 10 h of
darkness. Thus, while the stimulation of R by light can be observable for several hours after the onset of darkness, we propose that the determination of Rlightshould be done
im-mediately after the onset of darkness in order to have a sig-nificant change in oxygen concentration (i.e. 0.5 µM).
Obviously, the incubation procedure does not accurately mimic in situ conditions as changes in biomass and com-munity structure are likely to occur during this 26 h incu-bation (Gattuso et al., 2002; Briand et al., 2004). How-ever, we can calculate daily rates of R by integrating the exponential decrease of R during the dark period consec-utive to light exposure, and adding this value to Rlight,
as-suming that Rlightis constant during the illumination period.
This leads to an Rdarkvalue of 77 µmol O2L−1for 12 h and
an Rlightvalue of 180 µmol O2L−1for 12 h. Consequently,
daily respiration is equal to 257 µmol O2l−1d−1. This value
Time (h) 0 3 6 9 12 15 18 21 24 150 200 250 300 350 400 450 500 (b) 360 380 400 420 440 460 R e s p ira tio n ( µ m o l O 2 L -1 h -1 ) 2 4 6 8 10 12 14 16 18 (c) Time (h) 0 3 6 9 O x yg e n ( µ m o l L -1 ) 206 208 210 212 214 (a) 204 206 208 210 212 214 R e s p ira tio n ( µ m o l O 2 L -1 h -1 ) 0.5 1.0 1.5 2.0 2.5 3.0 O xy g e n (µ m o l L -1 ) O xy g e n (µ m o l L -1 ) O x yg e n ( µ m o l L -1 ) Time (h) 14 16 18 20 22 24 26 340 (d) 0 Time (h) 5 6 7 8 9 202 0.0
Fig. 4. (a) and (b) Oxygen time course during incubation of water from Southwest lagoon of New Caledonia. Shaded boxes represent the
dark periods and unshaded box represents the illumination period. (c) and (d) Exponential decrease (solid lines) fitted to the raw data of oxygen concentration in the dark period consecutive to light exposure. Respiration (dotted lines) was calculated from the first derivative of the fitted exponential decrease curve. The horizontal line represents the initial Rdark. For (a) and (c), sample was collected in Anse Vata on 9
May 2006. The concentration of chlorophyll a was 3.3 µg L−1. For (b) and (d) sample was collected in Anse Vata on 30 March 2006. The concentration of chlorophyll a was 20 µg L−1.
is much greater than the daily R of 53 µmol O2L−1d−1
cal-culated from the initial dark value assuming that Rlight=Rdark.
Similarly, we can calculate GPP and then determine the P:R ratio, taking into account Rlight and the daily rates
of GPP and R. When Rlight was taken into account, GPP
was equal to 453 µmol O2L−1d−1, leading to a P:R
ra-tio of 1.76. This has to be compared with a GPP value of 290 µmol O2L−1d−1 and a P:R ratio of 5.47, when
Rlight=Rdarkis assumed. This represents an underestimation
for GPP of 56% and an overestimation for P:R ratio of 68%. The long tailing off of Rlightcannot be ignored in
respira-tion measurements. It is obvious that initial sampling time is extremely important as respiration measurements conducted on samples previously exposed to sunlight would have a higher R than those collected at sunrise.
4 Discussion
From oxygen monitoring in phytoplankton cultures with an oxygen macroprobe, Falkowski et al. (1985) have shown that light respiration can be still measured a few minutes after the onset of darkness, and this was confirmed by Weger et al. (1989), using the technique of18O isotopic fractionation. In our study we used the same approach as described by Falkowski et al. (1985) to estimate Rlightin natural field
wa-ter samples. The range of hourly rates of Rlightis of the same
order of magnitude as those measured in natural field water samples using the stable18O technique (Grande et al., 1989a; Luz et al., 2002). With this latter technique, respiration in the light can be directly measured, and it has been shown that in natural lake communities, Rlight can be up to 5 fold Rdark
O. Pringault et al.: Consequences of respiration in the light 111 (Luz et al., 2002). These results are similar to those of our
study where on average Rlight represented more than 350%
of Rdark. Using the same isotopic fractionation technique,
Grande et al. (1989b) have shown that in the North Pacific Gyre, Rlight can be up to 8 times greater than Rdark. This
strong stimulation of respiration in the light leads to an un-derestimation of GPP of more than 135% when it is assumed that Rlight=Rdark (Grande et al., 1989b). A similar range for
the underestimation of GPP was obtained in our study (see Table 1). Respiration in the light has also been estimated in phytoplankton cultures using both techniques (Grande et al., 1989a; Ekelund, 2000; Heraud and Beardall, 2002). Study-ing several naturally abundant marine phytoplankton species, Grande et al. (1989a) have shown that Rlightwas often greater
than Rdarkwith values up to 10 fold more than Rdarkin some
cases.
Consequently, despite increasing evidence that Rdarkis not
equal to Rlight, the ecological consequences of the
assump-tion Rlight=Rdark continue to be ignored, probably because
light respiration in natural field samples has been observed only using isotopic fractionation (e.g. Luz et al., 2002). The main drawback of this method is that it is technically de-manding and requires measuring oxygen isotopes and esti-mating fractionation factors for a number of processes re-lated to biological oxygen consumption and production as well as abiotic exchanges of oxygen (Luz et al., 2002). In this study, we showed that respiration in the light can be quantified in natural field seawater samples using a simple, reproducible and accurate methodology that allows the pre-cise estimation of respiration in coastal waters under a wide range of Chl a concentrations from oligotrophic to eutrophic conditions (Briand et al., 2004). The continuous measure-ment of oxygen during incubations shows that changes in oxygen concentration are not always linear with time (Briand et al., 2004), especially during the change of light conditions (Figs. 1 and 3). In order to precisely estimate activities dur-ing this transient state characterizdur-ing the change from light to dark, we used a modeling approach, by fitting an exponential decay to the raw data. In benthic phototrophic environments, continuous measurements of oxygen from light to dark or dark to light allow the precise determination of production or respiration (Revsbech and Jørgensen, 1983, 1986). The modeling of these transient states has been developed to bet-ter estimate the dynamics of respiration or production rates (Lassen et al., 1998; Epping et al., 1999).
The degree of underestimation of GPP is highest under net heterotrophic conditions, with values reaching up to 650% (Table 1). The underestimation is less pronounced under net autotrophic conditions with values of 6 to 20%. This is in-tuitive as under net heterotrophy, R is the dominant process, whereas during periods of net autotrophy, GPP is the dom-inant process. Thus, the error introduced in the calculation of GPP when Rlight is not taken into account has a greater
impact during periods of net heterotrophy than it has during periods of net autotrophy. In our field study, on some
occa-sions we observed NCP rates more negative than Rdarkrates
during net heterotrophic conditions (Table 1, Fig. 3b). Ac-cording to Eq. (1), this results in negative values for GPP, which is theoretically impossible. Similar phenomena have been observed in the ALOHA station in the Central Pacific by Williams et al. (2004), where negative values of GPP were reported in deep waters under net heterotrophic con-ditions. In our study (Table 1), we consider that Rlightneeds
to be at least equal to NCP in order to get a positive value for GPP. For example, for the sample collected in M41 on 11 May 2006 (Fig. 3b) this results in Rlight that is 186%
higher than Rdark. This value should be considered as
con-servative as the percentage of stimulation is probably higher (GPP>0). Even if a precise estimation of Rlight cannot be
achieved in this case, the strong decrease observed just af-ter light exposure (Fig. 3b) clearly indicates that respiration was strongly stimulated by the onset of illumination thus sug-gesting a tight coupling between respiration and production. The oxygen changes presented in Fig. 3b result in a physi-ologically impossible negative value for GPP when assum-ing Rlight=Rdark. This has been observed under several
occa-sions for net heterotrophic waters (see Table 1). Obviously, respiration measured in this study represents the community respiration, i.e. sum of phytoplankton respiration and het-erotrophic respiration. Therefore, both components of this community respiration might be stimulated by light, includ-ing the Mehler reaction for photosynthetic phytoplankton as well as the stimulation of bacterial respiration by freshly pro-duced photosynthetic products. Tight coupling between both microbial compartments has been largely documented (Ep-ping and Jørgensen, 1996; Paerl and Pinckney, 1996) and the stimulation of bacterial production under light conditions has been observed in pelagic systems (Church et al., 2004). In benthic environments the addition of limiting compounds for photosynthetic production resulted in a concomitant stimula-tion of respirastimula-tion, indicating that heterotrophs are strongly dependent upon phototrophs for carbon supply (Ludwig et al., 2006).
The stimulation of R in the light affects the determination of the P:R ratio. As we have shown, an error in the determi-nation of R leads to an error in the calculation of GPP. During net heterotrophy, we find P:R ratios that are higher than those estimated when Rlight is not taken into account (Table 2).
In contrast, under net autotrophic conditions, P:R ratios are lower than those estimated using only Rdark. Moreover, as the
system becomes increasingly autotrophic or heterotrophic, the difference between both P:R estimations becomes more marked. Of course, the integration of Rlight into the
calcu-lation of P:R ratio would not change the metabolic balance of the system (as indicated by NP), however it will decrease the observed tendency, in other words, net autotrophic sys-tems become less autotrophic and net heterotrophic syssys-tems become less heterotophic.
Clearly, our average hourly value of Rlightcannot be
con-sidered representative of all pelagic systems, however it is
0 2 6 8 10 12 14 P: R 0.0 0.2 0.4 0.6 0.8 1.0 1.2 1.4 4 GPP (mmol O2 m-3 d-1)
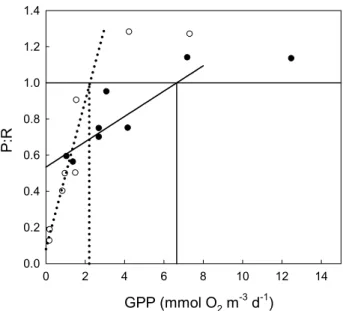
Fig. 5. Relationship between P:R ratio and Production for the
de-termination of the threshold value of P separating net heterotophic from net autotrophic communities. Open symbols and dotted line data from Duarte and Agusti (2005). Closed symbols data from Duarte and Agusti corrected with Rlight=3.54×Rdark. The lines rep-resent the fitted initial linear slope of the relationship. Dotted line: Duarte and Agusti (2005): P:R=0.41×P+0.08, R2=0.75, p<0.05. Solid line: Duarte and Agusti (2005) corrected: P:R=0.09×P+0.53,
R2=0.77, p<0.05. The vertical lines represent the threshold value of P for a P:R=1.
an interesting exercise to use it to estimate the potential er-ror in the calculations of GPP (Eqs. 1 and 2), the calcula-tions of daily R, and hence the P:R ratio, when Rlight=Rdark
is assumed. We performed this exercise with literature data collected in coastal waters exhibiting similar levels of Chl a concentration as those measured in this study. From our field experiments we calculated that hourly rates of Rlight
repre-sent on average 354% of Rdark. We used this average value
to test the underestimation of GPP of coastal ecosystems in the literature according to Eq. (3).
For example, Smith and Kemp (2001) have estimated that Chesapeake Bay is net autotrophic in spring, summer and fall with median P:R ratios of 3.33, 1.94, and 2.82, respectively. If we use our average Rlightof 354% Rdark, we estimate for
the same periods P:R ratios of 2.05 (spring), 1.42 (summer), and 1.82 (fall), which represents an overestimation of P:R ratios in the literature of 38%, 27%, and 35%, respectively. Furthermore, Caffrey (2004) has reported that most US estu-aries are net heterotrophic, for example in Rookery Bay, the annual average P:R ratio is equal to 0.34. However, when we take into account Rlight, calculated as 354% Rdark, we find a
P:R ratio of 0.70, pointing to an underestimation of 106 %. The use of P:R ratios to estimate whether a system is net autotrophic or net heterotrophic is problematic since the es-timation of GPP and R is uncertain. NCP represents a more
realistic balance between GPP and R and its estimation is less inexact due to the fact that it takes into account Rlight.
However, although NCP is a good estimate of whether or not a system is in metabolic balance, it provides no infor-mation about the degree of trophy of the system. Therefore, despite the uncertainties regarding GPP and R estimations, numerous studies on the carbon cycle have compared GPP and R rates on a global scale to define the trophic status of pelagic systems (see the review of Duarte and Agusti, 1998). Here, P:R ratios are calculated to estimate the percentage of net heterotrophy or net autotrophy (sensu chapter of the mass balance calculation in Robinson and Williams, 2005). For example, using the light and dark bottle technique ap-plied in experimental mesocosms containing Chl a concen-trations that are close to those we observed in our field exper-iments, Duarte and Agusti (2005) have estimated the thresh-old value for GPP, which separates net heterotrophic from net autotrophic communities in Southern Ocean. Assum-ing Rlight=Rdark, they calculated a threshold value for P of
2.2 mmol O2m−3d−1(Fig. 5). If Rlightis integrated into the
calculation (Rlight=3.54×Rdark), we estimate that the
thresh-old for GPP is 6.5 mmol O2m−3d−1. Community
respira-tion and producrespira-tion can also be compared to other estimates of carbon production or utilization such as bacterial produc-tion or14C primary production to determine the interrela-tions between the different metabolic pathways involved in the carbon cycle on a global scale (e.g. Del Giorgio et al., 1997). In such cases, the uncertainties regarding the estima-tion of P and R will also affect the comparison of producestima-tion and/or respiration with other estimates of carbon production and utilization.
5 Conclusions
Respiration represents a major area of ignorance in our un-derstanding of the global carbon cycle (see the preface of Del Giorgio and Williams, 2005). The majority of studies of res-piration in aquatic ecosystems have employed the Winkler technique (Williams and del Giorgio, 2005) despite the fact that this method cannot measure respiration in the light. As a consequence, this methodological problem has been circum-vented by assuming Rlight=Rdark. Since its first application in
seawater by Gran in 1917 to measure oxygen flux, the Win-kler technique has become the reference technique for oxy-gen measurements even though alternative methods are now available that allow for the determination of Rlight. In our
study, we show that Rlight should not be ignored for the
de-termination of GPP nor for the estimation of the daily rate of R, at least in coastal environments. In order to better estimate the contribution of pelagic systems to the global carbon cycle efforts have to be made to take into account the tight coupling between production and respiration and its consequences in the estimation of both processes.
O. Pringault et al.: Consequences of respiration in the light 113 Acknowledgements. We thank E. Smith, D. Ponton, and C.
Payri for their invaluable comments on an earlier version of the manuscript. This study was supported by grants from the French “Programme National Environnement Cˆotier (PNEC)” and the French “Institut de Recherche pour le D´eveloppement (IRD)”.
Edited by: A. Boetius
References
Bender, M. L., Grande, K. D., Johnson, K., Marra, K., Williams, P. J. le B., Sieburth, J., Pilson, M., Langdon, C., Hitchcock, G., Or-chardo, J., Hunt, C., Donaghay, P., and Heinemann, K.: A com-parison of four methods for determining planktonic community production, Limnol. Oceanogr., 32, 1085–1098, 1987.
Briand, E., Pringault, O., Jacquet, S., and Torr´eton, J. P.: The use of oxygen microprobes to measure bacterial respiration for deter-mining bacterioplankton growth efficiency, Limnol. Oceanogr.: Methods, 2, 406–416, 2004.
Caffrey, J. M.: Factors controlling net ecosystem metabolism in U.S. estuaries, Estuaries, 27, 90–101, 2004.
Church, M. J., Ducklow, H. W., and Karl, D. M.: Light depen-dence of [3H]leucine incorporation in the oligotrophic North Pa-cific Ocean, Appl. Environ. Microbiol., 70, 4079–4087, 2004. del Giorgio, P. A., Cole, J. J., and Cimbleris, A.: Respiration
rates in bacteria exceed phytoplankton production in unproduc-tive aquatic systems, Nature, 385, 148–151, 1997.
del Giorgio, P. A. and Cole, J. J.: Bacterial growth efficiency in natural aquatic systems, Annu. Rev. Ecol. Syst., 29, 503–541, 1998.
del Giorgio, P. A. and Duarte, C. M.: Respiration in the open ocean, Nature, 420, 379–384, 2002.
del Giorgio, P. A. and Williams, P. J. le B.: Respiration in aquatic ecosystems, Oxford University Press, New York, 2005. Duarte, C. M. and Agusti, S.: The CO2 balance of unproductive
aquatic ecosystems, Science, 281, 234–236, 1998.
Duarte, C. M. and Agusti, S.: Threshold of gross primary produc-tion for planktonic metabolic balance in the Southern Ocean: an experimental test, Limnol. Oceanogr., 50, 1334–1339, 2005. Ekelund, N. G. A.: Interactions between photosynthesis and
‘light-enhanced dark respiration’(LEDR) in the flagellate Euglena
gra-cilis after irradiation with ultraviolet radiation, J. Photochem.
Photobiol. B: Biol., 55, 63–69, 2000.
Epping, E. H. G. and Jørgensen, B. B.: Light-enhanced oxygen res-piration in benthic phototrophic communities, Mar. Ecol. Prog. Ser., 139, 193–203, 1996.
Epping, E. H. G., Khalili, A., and Thar, R.: Dynamics of photosyn-thesis and respiration in an intertidal biofilm, Limnol. Oceanogr., 44, 1936–1948, 1999.
Epping, E. H. G. and K¨uhl, M.: The responses of photosynthesis and oxygen consumption to short-term changes in temperature and irradiance in a cyanobacterial mat (Ebro Delta, Spain), Env-iron. Microbiol., 2, 465–474, 2000.
Falkowski, P. G., Dubinsky, Z., and Santostefano, G.: Light-enhanced dark respiration in phytoplankton, Verh. Internat. Verein. Limnol., 22, 2830–2833, 1985.
Gattuso, J. P., Peduzzi, S., Pizay, M. D., and Tonolla, M.: Changes in freshwater bacterial community composition during
measure-ments of microbial and community respiration, J. Plankton Res., 24, 1197–1206, 2002.
Grande, K. D., Marra, J., Langdon, C., Heinemann, K., and Ben-der, M. L.: Rates of respiration in the light measured in marine phytoplankton using an18O isotope-labelling technique, J. Exp. Mar. Biol. Ecol., 129, 95–120, 1989a.
Grande, K. D., Williams, P. J. Le B., Marra, J., Purdie, D. A., Heine-mann, K., Eppley, R. W., and Bender, M. L.: Primary production in the North Pacific gyre: a comparison of rates determined by the14C, O2concentration and18O methods, Deep Sea Res., 36, 1621–1634, 1989b.
Heraud, P. and Beardall, J.: Ultraviolet radiation has no effect on respiratory oxygen consumption or enhanced post-illumination respiration in three species of microalgae, J. Photochem. Photo-biol. B: Biol., 68, 109–116, 2002.
Jeffrey, S. W. and Humphrey, G. F.: New spectrophotometric equa-tions for determining chlorophylls a, b, c1, c2 in algae, phyto-plankton and higher plants, Biochem. Physiol., 167, 191–194, 1975.
Lassen, C., Glud, R. N., Ramsing, N. B., and Revsbech, N. P.: A method to improve the spatial resolution of photosynthetic rates obtained by oxygen microsensors, J. Phycol., 34, 89–93, 1998. Ludwig, R., Pringault, O., De Wit, R., De Beer, D., and Jonkers,
H. M.: Limitation of oxygenic photosynthesis and oxygen con-sumption by phosphate and organic nitrogen in a hypersaline mi-crobialmat: a microsensor study, FEMS Microbiol. Ecol., 57, 9–17, 2006.
Luz, B., Barkan, E., Sagi, Y., and Yacobi, Y. Z.: Evaluation of com-munity respiratory mechanisms with oxygen isotopes: A case study in Lake Kinneret, Limnol. Oceanogr., 47, 33–42, 2002. Paerl, H. W. and Pinckney, J. L.: A mini-review of microbial
con-sortia: Their roles in aquatic production and biogeochemical cy-cling, Microb. Ecol., 31, 225–247, 1996.
Raven, J. A. and Beardall, J.: Respiration in aquatic pho-tolithotrophs, in: Respiration in aquatic ecosystems, edited by: del Giorgio, P. A. and Williams, P. J. le B., Oxford University Press, New York, 36–46, 2005.
Revsbech, N. P. and Jørgensen, B. B.: Photosynthesis of benthic microflora measured with high spatial resolution by the oxygen microprofile method: capabilities and limitations of the method, Limnol. Oceanogr., 28, 749–756, 1983.
Revsbech, N. P. and Jørgensen, B. B.: Micro-electrodes: their use in microbial ecology, Adv. Microb. Ecol., 9, 293–352, 1986. Revsbech, N. P.: An oxygen microsensor with a guard cathode,
Limnol. Oceanogr., 34, 474–476, 1989.
Robinson, C. and Williams, P. J. le B.: Respiration and its mea-surement in surface marine waters, in: Respiration in aquatic ecosystems, edited by: del Giorgio, P. A. and Williams, P. J. le B., Oxford University Press, New York, 147–180, 2005. Sherr, B. F. and Sherr, E. B.: Community respiration/production and
bacterial activity in the upper water column of the central Arctic Ocean, Deep-Sea Res. I, 50, 529–542, 2003.
Smith, E. M. and Kemp, W. M.: Size structure and the produc-tion/respiration balance in a coastal plankton community, Lim-nol. Oceanogr., 46, 473–485, 2001.
Weger, H. G., Herzig, R., Falkowski, P. G., and Turpin, D. H.: Res-piratory losses in the light in a marine diatom: measurements by short-term mass spectrometry, Limnol. Oceanogr., 34, 1153– 1161, 1989.
Wieland, A. and K¨uhl, M.: Irradiance and temperature regulation of oxygenic photosynthesis and O2consumption in a hypersaline
cyanobacterial mat (Solar Lake, Egypt), Mar. Biol., 137, 71–85, 2000.
Williams, P. J. le B.: The balance of plankton respiration and pho-tosynthesis in the open oceans, Nature, 394, 55–57, 1998.
Williams, P. J. le B., Morris, P. J., and Karl, D. M.: Net community production and metabolic balance at the oligotrophic ocean site, station ALOHA, Deep-Sea Res. I, 51, 1563–1578, 2004. Williams, P. J. le B. and del Giorgio, P. A.: Respiration in aquatic
ecosystems: history and background, in: Respiration in aquatic ecosystems, edited by: del Giorgio, P. A. and Williams, P. J. le B., Oxford University Press, New York, 1–17, 2005.