HAL Id: hal-00841751
https://hal-agrocampus-ouest.archives-ouvertes.fr/hal-00841751
Submitted on 2 Sep 2019
HAL is a multi-disciplinary open access
archive for the deposit and dissemination of
sci-entific research documents, whether they are
pub-lished or not. The documents may come from
teaching and research institutions in France or
abroad, or from public or private research centers.
L’archive ouverte pluridisciplinaire HAL, est
destinée au dépôt et à la diffusion de documents
scientifiques de niveau recherche, publiés ou non,
émanant des établissements d’enseignement et de
recherche français ou étrangers, des laboratoires
publics ou privés.
Leptosphaeria maculans genome affected by
Repeat-Induced Point mutations
T. Rouxel, J. Grandaubert, Jk. Hane, C. Hoede, Angela P. van de Wouw, A.
Couloux, V. Dominguez, Véronique Anthouard, P. Bally, S. Bourras, et al.
To cite this version:
T. Rouxel, J. Grandaubert, Jk. Hane, C. Hoede, Angela P. van de Wouw, et al.. Effector diversification
within compartments of the Leptosphaeria maculans genome affected by Repeat-Induced Point
mu-tations. Nature Communications, Nature Publishing Group, 2011, 2, pp.202. �10.1038/ncomms1189�.
�hal-00841751�
ARTICLE
Received 20 Apr 2010 | Accepted 11 Jan 2011 | Published 15 Feb 2011 DOI: 10.1038/ncomms1189
Fungi are of primary ecological, biotechnological and economic importance. many fundamental biological processes that are shared by animals and fungi are studied in fungi due to their experimental tractability. many fungi are pathogens or mutualists and are model systems to analyse effector genes and their mechanisms of diversification. In this study, we report the genome sequence of the phytopathogenic ascomycete Leptosphaeria maculans and characterize its repertoire of protein effectors. The L. maculans genome has an unusual bipartite structure with alternating distinct guanine and cytosine-equilibrated and adenine and thymine (AT)-rich blocks of homogenous nucleotide composition. The AT-rich blocks comprise one-third of the genome and contain effector genes and families of transposable elements, both of which are affected by repeat-induced point mutation, a fungal-specific genome defence mechanism. This genomic environment for effectors promotes rapid sequence diversification and underpins the evolutionary potential of the fungus to adapt rapidly to novel host-derived constraints.
1 INRA-Bioger, UR1290, Avenue Lucien Brétignières, BP 01, Thiverval-Grignon F-78850, France. 2 Murdoch University, South Street, Murdoch, Western Australia 6150, Australia. 3 INRA-URGI, Route de Saint Cyr, Versailles Cedex F-78026, France. 4 School of Botany, University of Melbourne, Victoria 3010, Australia. 5 GENOSCOPE, Centre National de Séquençage, Institut de Génomique CEA/DSV, 2, rue Gaston Crémieux, CP 5706, Evry Cedex F-91057, France. 6 Department of Botany and Plant Pathology, Cordley Hall 2082, Oregon State University, Corvallis, Oregon 97331-2902, USA. 7 Laboratoire Biométrie et Biologie Evolutive, UMR CNRS 5558, Université Lyon 1, 43 Bld du 11 Novembre 1918, Villeurbanne cedex F-69622, France. 8 USDA-ARS, Crop Production and Pest Control Research Unit, Purdue University, 915 West State Street, West Lafayette, Indiana 47907-2054, USA. 9 Wageningen UR, Plant Research International, Department of Biointeractions and Plant Health, P.O. Box 69, Wageningen 6700 AB, The Netherlands. 10 Virginia Bioinformatics Institute, Virginia Polytechnic Institute and State University, Blacksburg, Virginia 24061-0477, USA. 11 NIH/NLM/NCBI, 45 Center Drive, MSC 6510, Bethesda, Maryland 20892-6510, USA. 12 Institute of Plant Genetics, Polish Academy of Sciences, Strzeszynska 34, Poznan PL-60479, Poland. 13 Deparment of Plant Pathology & Plant-Microbe Biology, Cornell University, Ithaca, New York 14853, USA. 14 INRA, UMR1202 BIOGECO, 69 Route d’Arcachon, Cestas F-33612, France. 15 Australian Centre for Necrotrophic Fungal Pathogens, Curtin University, Perth, Western Australia 6845, Australia. *These authors contributed equally to this work. Correspondence and requests for materials should be addressed to T.R. (email: [email protected]).
Effector diversification within compartments
of the Leptosphaeria maculans genome affected
by Repeat-Induced Point mutations
Thierry Rouxel
1,*, Jonathan Grandaubert
1,*, James K. Hane
2, Claire Hoede
3, Angela P. van de Wouw
4,
Arnaud Couloux
5, Victoria Dominguez
3, Véronique Anthouard
5, Pascal Bally
1, salim Bourras
1, Anton J. Cozijnsen
4,
Lynda m. Ciuffetti
6, Alexandre Degrave
1, Azita Dilmaghani
1, Laurent Duret
7, Isabelle Fudal
1, stephen B. Goodwin
8,
Lilian Gout
1, nicolas Glaser
1, Juliette Linglin
1, Gert H. J. Kema
9, nicolas Lapalu
3, Christopher B. Lawrence
10,
Kim may
4, michel meyer
1, Bénédicte ollivier
1, Julie Poulain
5, Conrad L. schoch
11, Adeline simon
1,
Joseph W. spatafora
6, Anna stachowiak
12, B. Gillian Turgeon
13, Brett m. Tyler
10, Delphine Vincent
14,
Jean Weissenbach
5, Joëlle Amselem
3, Hadi Quesneville
3, Richard P. oliver
15, Patrick Wincker
5,
marie-Hélène Balesdent
1& Barbara J. Howlett
4ARTICLE
ARTICLE
F
ungi are the most important pathogens of cultivated plants, causing about 20% yield losses worldwide. Such diseases are a major cause of malnutrition worldwide1. Their phenotypicdiversity and genotypic plasticity enable fungi to adapt to new host species and farming systems and to overcome new resistance genes or chemical treatments deployed in attempts to limit losses to crop yields2. Along with such genotypic plasticity, natural or
anthropo-genic long-distance dispersal of fungi allows the emergence of novel, better-adapted phytopathogens and more damaging diseases. These processes of adaptation are exemplified by Leptosphaeria maculans ‘brassicae’ (Phyllum Ascomycota, class Dothideomycetes), which causes stem canker (blackleg) of oilseed rape (Brassica napus) and other crucifers. This fungus has been recorded on crucifers (mainly cabbages) since 1791, but only began to cause substantial damage to broad acre Brassica species and spread around the world in the last four decades3. Other phytopathogens often rapidly cause lesions on
plants to ensure asexual reproduction. In contrast, L. maculans shows an unusually complex parasitic cycle with alternating saprotrophy associated with sexual reproduction on stem debris, necrotrophy and asexual sporulation on leaf lesions, endophytic and symptomless systemic growth, and a final necrotrophic stage at the stem base3.
Some features of filamentous fungal genomes are remarkably constant; for instance, size (20–60 Mb typically about 34 Mb), gene number (10,000–13,000), gene content, intron size and number, and the low content of repeated sequences4. Comparative genomic
approaches have shown that most of the candidate ‘pathogenic-ity genes’ (for example, those encoding hydrolytic enzymes that can degrade plant cell walls, or involved in formation of infection structures) analysed in the last decade in a gene-by-gene approach are shared by saprobes and pathogens4. These genes were probably
recruited as pathogenicity factors when phytopathogens evolved from saprobes, but they do not account for host range or host spe-cificity of phytopathogens. Such roles are played by ‘effector’ pro-teins, which modulate host innate immunity, enable parasitic infec-tion and are generally genus, species, or even isolate-specific5,6. Such
effector genes include those with a primary function as avirulence genes or encoding toxins or suppressors of plant defense. While bacteria produce few effectors (typically < 30), which mostly seem to suppress plant innate immunity7, hundreds of candidate effectors
have been identified in oomycetes8–10. In fungi, in contrast, such a
catalogue of effectors has only been established to-date in the hemi-basidiomycete pathogen of maize, Ustilago maydis, in which many of the effector genes are organized as gene clusters11.
In L. maculans, the only characterized effectors include a toxic secondary metabolite, sirodesmin PL12 and the products of three
avirulence genes, AvrLm1, AvrLm6 and AvrLm4-7, of which at least one, AvrLm4-7, is implicated in fungal fitness13–15. These three
aviru-lence genes show typical features of effector genes; that is, they are predominantly expressed early in infection, encode small proteins predicted to be secreted (SSPs) into the plant apoplast and have no or few matches in databases. Intriguingly, all three are located within large AT-rich, heterochromatin-like regions that are mostly devoid of other coding sequences13,15.
In this paper, we describe the genome of L. maculans. We speculate how the genome, characterized by a distinct division into guanidine– cytosine (GC)-equilibrated and AT-rich blocks of homogenous nucle-otide composition, has been reshaped following massive invasion by and subsequent degeneration of transposable elements (TEs). We also predict the repertoire of pathogenicity effectors for the first time in an ascomycete genome and we propose how the unusual genome struc-ture may have led to the diversification and evolution of effectors. Results
General features of the L. maculans genome. The haploid genome
of strain v23.1.3 of L. maculans ‘brassicae’ was sequenced using a whole-genome shotgun strategy. This fungus is closely related
to Phaeosphaeria (Stagonospora) nodorum, Pyrenophora
tritici-repentis and Cochliobolus heterostrophus, as seen in the phylogeny
based on sequence analysis of a range of genes (Supplementary Table S1; Fig. 1). The genome assembly had a total size of 45.12 Mb, scaffolded into 76 SuperContigs (SCs; 30 large SCs > 143 kb; Tables 1 and 2; Supplementary Table S2). The correspondence of SCs to chromosomes was inferred by a combination of approaches (Fig. 2; Supplementary Figs S1 and S2). Conglomerated data are consistent with the presence of 17 or 18 chromosomes, ten of which correspond to single SCs (Supplementary Fig. S1; Supplementary Table S2).
Gene models were identified using the EuGene prediction pipe-line (Supplementary Tables S3 and S4), and the resulting total of 12,469 genes is consistent with that in other Dothideomycetes (Table 2). Expression of 84.4% of predicted genes was detected using NimbleGen custom-oligoarrays in free-living mycelium or during early stages of oilseed rape infection (Table 3). About 10% of the genes were significantly overexpressed during infection (Table 3). Taking into account expressed-sequence-tag (EST), transcriptomic, and proteomic support, 84.8% of the gene models were biologically validated (Table 3). The genes are shorter than those in the other Dothideomycetes whose genomes have been sequenced (Table 2). Intergenic distances are shorter than those of P. nodorum, the clos-est relative to have been sequenced, and bi-directional promoters are common (Supplementary Table S5).
Automated finding and annotation of repeated elements in the genome using the REPET pipe-line (http://urgi.versailles.inra.fr/ index.php/urgi/Tools/REPET) showed that they comprise one-third of the genome compared to 7% in P. nodorum (Table 2). Although most of the repeat elements are truncated and occur as mosaics of multiple families, their origin as TEs is clear (Supplementary Data S1 and S2). Class I elements (see ref. 16 and Table 4 for classification of TEs) dominate with nine families comprising 80% of the repeated elements (Table 4, Supplementary Data S1). Of these, just four fami-lies comprise 11.37 Mb, which is 25% of the genome assembly. Very few, if any, of the TEs are transcribed, as shown by EST inspection and transcriptomic analysis. TEs are clustered in blocks distributed across SCs, and the number of TE copies per SC correlates with size of the SC (R2 = 0.86; Supplementary Fig. S3).
The TEs are RIP affected. Alignment and comparison of repeat
families also showed a pattern of nucleotide substitution consisting mainly of C-to-T and G-to-A changes, suggesting the presence of induced point mutation (RIP). RIP is a premeiotic repeat-inactivation mechanism specific to fungi and has been previously experimentally identified in L. maculans17. The L. maculans genome
possesses orthologues of all the Neurospora crassa genes currently postulated to be necessary for RIP18 (Supplementary Table S6).
Analysis using RIPCAL, a quantitative alignment-based method19,
indicated that C bases within CpA dinucleotides were mutated to T, more frequently than the sum of CpC, CpG and CpT dinucleotides, confirming the action of RIP on all of the TEs (Supplementary Figs S4 and S5; Supplementary Data S2).
The compartmentalized genome of L. maculans. The L. maculans
genome is larger and has a lower overall GC content (44.1% GC) than those of the related Dothideomycetes P. nodorum, Alternaria
brassicicola, C. heterostrophus, P. tritici-repentis or the more
diver-gent species Mycosphaerella graminicola (Table 2). As previously reported for a broader range of fungi20, the larger size is consistent
with the genome having been extensively invaded by TEs. The GC content of ESTs and other known coding sequences is 50.5%, and the low genome GC content is due to the compartmentalized struc-ture of the genome into GC-equilibrated regions (51.0% GC content, sizes between 1 and 500 kb, average 70.4 kb; henceforth denoted as GC-blocks) alternating with AT-rich regions (henceforth denoted as AT-blocks; averaging 33.9% GC content; with sizes between
ARTICLE
nATuRE CommunICATIons | DoI: 10.1038/ncomms1189
1 and 320 kb, average of 38.6 kb). Whole-genome analysis identi-fied 413 AT-blocks and 399 GC-blocks (Supplementary Table S7). The AT-blocks cover 36% of the genome and are distributed within the large SCs, comprising between 23.1 and 49.2% (Fig. 2c,
Supplementary Table S7; Supplementary Fig. S6). SC22, correspond-ing to a minichromosome,21 contains nine AT-blocks amounting to
92.5% of the SC (Supplementary Table S7).
As well as differences in GC content, the two types of genomic regions are dissimilar in terms of recombination frequency and gene content. The number of crossovers (CO) along a chromosome ranges between 1.16 and 3.31, depending on size of the chromosome, with one CO every 820 kb on average. The recombination frequency is significantly higher between marker pairs located within GC-blocks than those located on each side of one AT-block (F-Fisher = 5.873,
P = 0.019; Fig. 2d, Supplementary Fig. S7).
GC-blocks contain 95% of the predicted genes of the genome, at a higher density (4.2 per 10 kb) than in other Dothideomycetes (Table 2) and are mostly devoid of TEs. In contrast, AT-blocks are gene-poor, comprising only 5.0% of the predicted coding sequences,
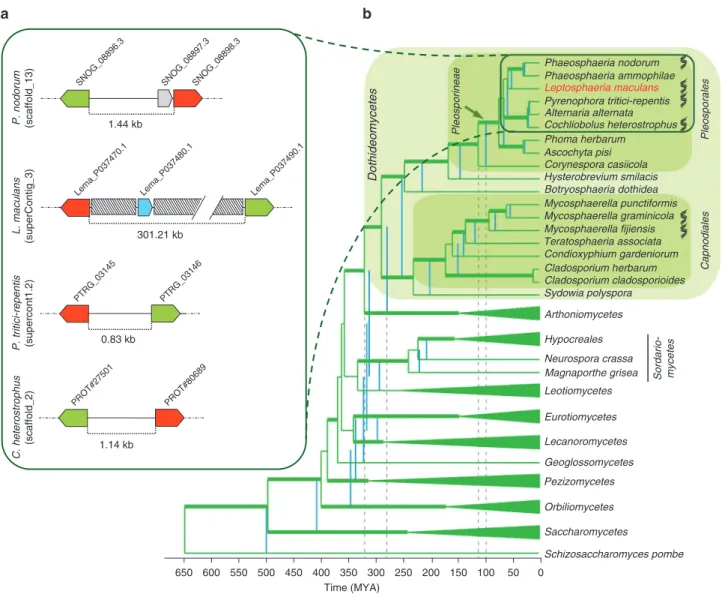
C. heterostrophus (scaffold_2) PROT#27501 PROT#80689 1.14 kb P. tritici-repenti s (supercont1.2) PTRG_03145 PTRG_03146 0.83 kb Lema_P037490.1 Lema_P037470.1 L. maculans (superContig_3) 301.21 kb Lema_P037480.1 P. nodoru m (scaffold_13 ) SNOG_08896.3 SNOG_08898.3 1.44 kb SNOG_08897.3 Phaeosphaeria nodorum Pleosporinea e Dothideomycetes Phaeosphaeria ammophilae Leptosphaeria maculans Pyrenophora tritici-repentis Alternaria alternata Cochliobolus heterostrophus Pleosporale s Capnodiales Sordario- mycetes Phoma herbarum Ascochyta pisi Corynespora casiicola Hysterobrevium smilacis Botryosphaeria dothidea Mycosphaerella punctiformis Mycosphaerella graminicola Mycosphaerella fijiensis Teratosphaeria associata Condioxyphium gardeniorum Cladosporium herbarum Cladosporium cladosporioides Sydowia polyspora Arthoniomycetes Hypocreales Neurospora crassa Magnaporthe grisea Leotiomycetes Eurotiomycetes Lecanoromycetes Geoglossomycetes Pezizomycetes Orbiliomycetes Saccharomycetes Schizosaccharomyces pombe 0 50 100 150 200 250 300 Time (MYA) 350 400 450 500 550 600 650
Figure 1 | Phylogenetic relationships between Dothideomycetes and an example of microsynteny between related species. (a) An example of microsynteny between L. maculans and closely related Dothideomycetes, P. nodorum, C. heterostrophus and P. tritici-repentis, showing the integration of an AT-rich genomic region (grey boxes) between two orthologous genes encoding for fungal transcription factors (red and green arrows) of the three other species, along with generation of one novel small-secreted protein-encoding gene (blue arrow) in L. maculans only. Grey arrow, P. nodorum predicted gene. The ID of each gene in the corresponding genome sequence is indicated. The intergenic distance (expressed in kb) is shown. (b) A phylogenetic tree and estimated time divergences of major lineages in Ascomycota with a selection of plant pathogenic lineages in Dothideomycetes. The phylogenetic analysis was performed using RaxmL44 and the chronogram, calibrated using recent data from the literature and fossil dates, produced using r8s (ref. 45). Classes outside of the Dothideomycetes were collapsed in TreeDyn, except for sordariomycetes where the order Hypocreales represented an important calibration point. The blue vertical lines correlate with divergence times when the root of the tree was fixed at 500 mYA, whereas the green lines of the tree represent a fixed root of 650 mYA. The range of dates for the emergence of Dothideomycetes and Pleosporineae are highlighted with stippled lines. Thickened branches on the tree represents nodes that had more than 70% bootstrap values in a RAxmL run. species with genome data are marked with a DnA logo.
Table 1 | Assembly statistics for the L. maculans genome. SuperContigs Contigs number 76 1,743 size (mb) 45.12 43.76 n50 (kb) 1,770 61 min/max size (kb) 0.49/4,258.57 0.22/395.37 mean size (kb) 594 26 median size (kb) 29 11
and mainly contain mosaics of TEs mutated by RIP, thus resulting in a low-GC content of TEs. There are three categories of AT-blocks: telomeres, which include a Penelope retroelement22
(Supplemen-tary Fig. S8); large AT-blocks (216 sized 13–325 kb); and mid-sized AT-blocks (197 sized 1–13 kb; Supplementary Fig. S9), mostly corresponding to single integrations of only two families of DNA transposons (Supplementary Table S8).
In almost half of the cases where pairs of orthologues are on the same SC, the genes flanking AT-blocks in L. maculans have orthologues in P. nodorum that are either two consecutive genes or genes separated by only a few others (Fig. 1a; Supplementary Data S3). A similar pattern was observed for C. heterostrophus and
P. tritici-repentis, suggesting that the TEs invaded the genome after
the separation of Leptosphaeria from other species of suborder
Pleosporineae 50–57 million years ago (MYA; Fig. 1b).
The ribosomal DNA repeat is extensively affected by RIP. In
eukaryotes, the ribosomal DNA (rDNA) comprises a multigene family organized as large arrays of tandem repeats. The core unit is a single transcription unit that includes the 18S or Small Subunit, 5.8S, and 28S or Large Subunit separated by internal transcribed spacers (ITS1 and ITS2). Each transcription unit is separated by the Inter-genic Spacer (Fig. 3a). Although essential duplicated regions would be expected to be protected from RIP mutations, the rDNA repeats in L. maculans are in part affected by RIP (Fig. 3b,c, Supplemen-tary Fig. S10). The number of rDNA repeats ranges between 56 and 225 in different L. maculans isolates23. The assembly of strain v23.1.3
has > 150 repeats, only two of which are highly similar (99.6% iden-tity) and are not affected by RIP. Fifty complete rDNA units and 107 incomplete units are present, and most of them are on extreme ends of SC2 and SC19, which are not complete chromosomes. Many of these repeats are severely affected by RIP (Fig. 3, Supplementary Fig. S10). Selker24 has suggested that rDNA repeats in the
nucleo-lus organizer region are protected from RIP. Our data indicate that this is not the case in L. maculans, at least for a part of the array of tandem repeats.
AT-blocks as niches for effectors. As described above, AT-blocks
have few genes. Furthermore, 76% of these genes are located close to the borders with GC-blocks; only 24% (148 genes) are located within AT-blocks (Table 3; Supplementary Data S4 and S5). Pro-tein comparisons and Gene Ontology (GO) analysis indicate that AT-blocks are enriched in genes likely to have a role in pathogenicity (Supplementary Fig. S11). These include orphan genes such as those
0 10 15 20 0 1,000 2,000 3,000 10 cM 10 cM 10 cM kb Count per 20 kb kb kb kb 0 1,000 2,000 3,000 0 1,000 2,000 3,000 0 1,000 2,000 3,000 0.57 GC% 0.01 PKS4
Figure 2 | Main features of the L. maculans genome as exemplified by chromosome 5 SuperContig 1. (a) Transposable elements (TEs) distribution and gene density along the supercontig. TE density is drawn in green and gene density is in blue. (b) Location of ssPs (small-secreted protein encoding genes). Blue arrowheads, ssP in AT-blocks, corresponding to TE-rich regions in a; red arrowheads, ssP in GC-blocks, corresponding to gene-rich genome regions in a. (c) GC content along the sC showing alternating GC-equilibrated and AT-rich regions, with location of a polyketide synthase-encoding gene, PKs4. (d) Genetic (upper part, expressed in centimorgan—cm) to physical (expressed in kb) distance relationship as a function of the isochore-like structure. Lower part: physical location of genetic markers. upper part of the panel: genetic map using mapmaker/Exp 3.0 with parameters set at likelihood ratio value > 3.0 and minimum distance = 20 cm. only markers drawn from the sequence data are represented.
Table 2 | Features of genomes of L. maculans and other related Dothideomycetes. L. maculans* P. (Stagonospora)
nodorum* P. tritici-repentis* C. heterostrophus* A. brassicicola* graminicola*M.
no. of chromosomes 17–18 19 11 15–16 9–11 21 Genome size (mb) 45.1 36.6 37.8 34.9 30.3 39.7 no of contigs 1,743 496 703 400 4,039 21 no of superContigs (sCs) 76 107 47 89 838 21 sC n50 (mb) 1.8 1.1 1.9 1.3 2.4 nA† Gaps (%) 2.5 0.4 1.7 1.1 5.4 0.01
no. of predicted genes 12,469 10,762 12,141 9,633 10,688 10,952
Average gene length (bp) 1,323 1,326 1,618 1,836 1,523 1,600
GC content (%) 44.1 50.3 50.4 52–54 50.5 55.0
Repeat content (%) 34.2 7.1 16.0 7.0 9.0 18.0
‘Core’ genome size (mb)‡ 29.7 34.5 31.7 32.5 27.6 32.6
Gene density/core genome (no. of gene per 10 kb)
4.2 3.1 3.8 3.0 3.9 3.4
*References for the genomes as follows: L. maculans54, P. nodorum55, P. tritici-repentis56, C. heterostrophus57, A. brassicicola58, M. graminicola59; unpublished reannotation of P. nodorum genome was provided
by J. K. Hane and R. P. oliver.
†not applicable, as the M. graminicola genome is finished; that is, each sC corresponds to a chromosome. ‡‘Core’ genome excluding the repeated elements, but including the gaps in the genome sequence.
ARTICLE
nATuRE CommunICATIons | DoI: 10.1038/ncomms1189
encoding SSPs, genes involved in response to chemical or biotic stimuli (Supplementary Fig. S11), as well as non-ribosomal pep-tide synthetases and polykepep-tide synthases, which encode enzymes involved in biosynthesis of secondary metabolites (Supplementary Tables S9 and S10; Supplementary Fig. S12).
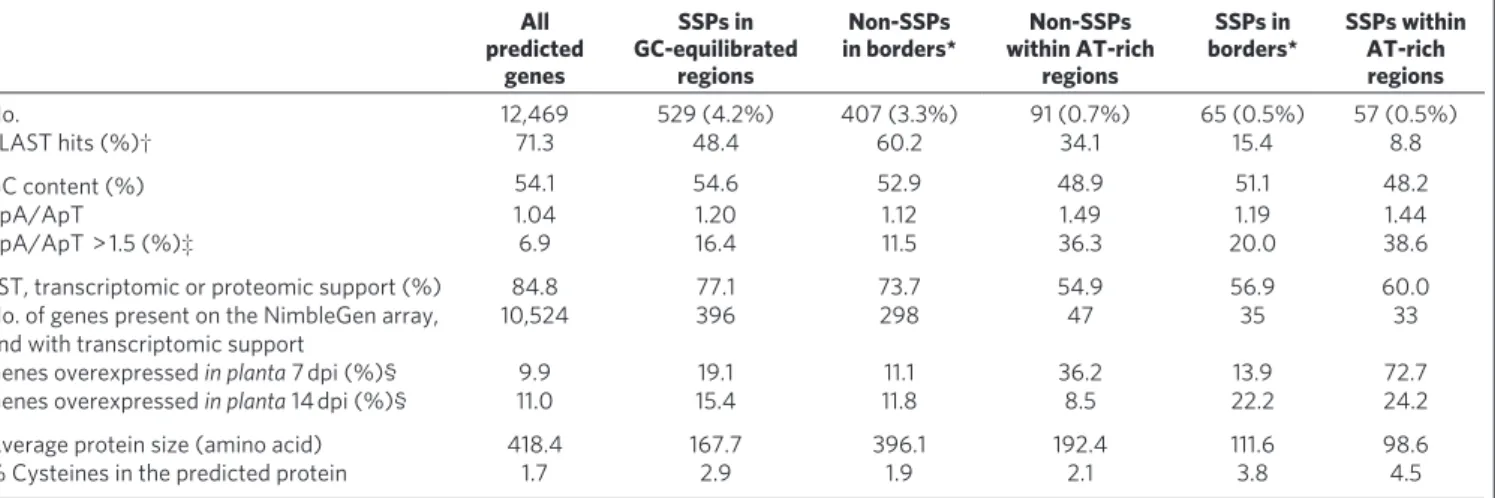
One hundred and twenty-two (~20%) of the genes located in AT-blocks encode putative SSPs (Table 3; Supplementary Data S4). Only 4.2% of the genes in the GC-blocks encode SSPs (529 genes), and these lack many features of known effectors of L. maculans (Table 3). In contrast, the SSPs encoded in AT-blocks have features indica-tive of effectors such as low EST support in in vitro grown cultures, low abundance in in vitro secretome samples, increased expression upon plant infection, lack of recognizable domains or homologues in other fungi, and high cysteine content (Table 3; Supplementary Data S4). Three TEs, the retrotransposon, RLx_Ayoly, and two DNA transposons, DTF_Elwe and DTx_Gimli, are significantly over-represented in the immediate vicinity of SSPs (Supplementary Fig. S13). Although SSPs are never embedded within a single TE, four SSPs are inserted between two tandemly repeated copies of the DNA transposon DTM_Sahana.
As well as the avirulence genes, two SSPs, LmCys1 and LmCys2, have been functionally analysed. LmCys1 contributes to fungal growth in planta, whereas LmCys2 contributes to suppression of plant defence responses, reflecting their roles as effectors (I. Fudal, unpublished data). Expression of 70.2% of the SSP-encoding genes was detected (Table 3). Of these, 72.7% of the SSP-encoding genes located within AT-blocks (compared with 19.1–22.2% in GC-blocks) were over-expressed at early stages of infection of cotyledons com-pared with in vitro mycelium growth (Table 3; Supplementary Fig. S14). Accordingly, these are postulated to be effectors. In addi-tion, 45% of the predicted SSPs in AT-blocks show a presence/ absence polymorphism in field populations, as is the case for aviru-lence genes in L. maculans and other fungi25. The SSPs in GC-blocks
include 110 (20.8%) with best BLAST hits to hypothetical proteins from P. nodorum. In contrast, very few SSPs in AT-blocks have iden-tifiable orthologues; only two (1.8%) had a best match to a predicted protein of P. nodorum (Supplementary Data S4). In addition to their lack of orthologues, SSPs in AT-blocks also lack paralogues; only seven genes belong to gene families comprising one to four para-logues. Biases in codon usage occur: in GC-blocks, the preferred codon for each of the 20 amino acids ends with a C or a G and
the preferred stop codon is TGA, whereas in SSP genes located in AT-blocks, the preferred codon ends with an A or T for 13 amino acids and the preferred stop codon is TAA (Supplementary Table S11). This, however, only has a limited impact on amino acid favoured usage by SSPs (Supplementary Table S12).
Motifs resembling the RxLR translocation motifs of oomycetes were sought26 following the validation that one such motif, RYWT,
present in the N-terminal part of AvrLm6 allows translocation into plant and animal cells26. Searches for 〈[RKH] X [LMIFYW] X〉 or
〈[RKH] [LMIFYW] X [RKH]〉 showed that up to 60% of SSPs in AT-blocks and up to 73% of SSP in GC-blocks have putative ‘RxLR-like’ motifs, implicating these SSPs as candidate effectors that enter plant cells (Supplementary Data S4).
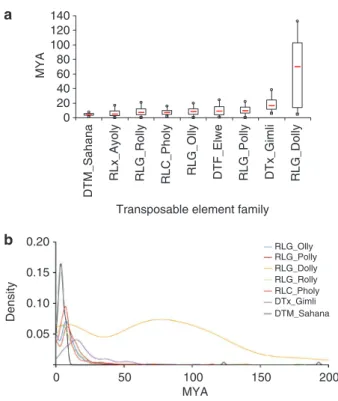
History of genome invasion by TEs. A range of 278–320 MYA
is estimated for the origin of the Dothideomycetes with the crown radiation of the class during the Permian (251–289 MYA; Fig. 1b). The origins of the plant pathogenic Pleosporineae is determined at 97–112 MYA, placing it in the Cretaceous at a time when flower-ing plants were beginnflower-ing to become widespread and eudicots were emerging, during the late Cretaceous and Paleocene. Leptosphaeria likely diverged from the other species analysed between 50 and 57 MYA (Fig. 1b). Phylogenetic analyses suggest three main features of genome invasion by TEs: transposition bursts mostly after separa-tion of L. maculans from other species of suborder Pleosporineae as indicated by a ‘recent’ divergence of the TE families, estimated to 4– 20 MYA (Fig. 4a); a single or few wave(s) of massive transposition(s) followed by a ‘rapid’ decay, with some cases like DTM_Sahana where divergence between copies is extremely low; and no on-going waves of genome invasion by TEs (Fig. 4b). Like other organisms with a high density of TEs, the L. maculans genome exhibits ‘nesting’, where repeats occur within previously inserted TEs. In this fungus, TEs are commonly invaded by other TEs generating a complex ‘nesting net-work’. Eighty-five % of these cases correspond to TEs invading one other TE (primary nesting relationship). Most of the retrotranspo-son families investigated can invade or be invaded to similar extents (Supplementary Table S8). They also can invade TEs from the same family (self-nests), but usually at a very low frequency compared with invasion of retrotransposons from other families. In contrast, the DNA transposons are more commonly invaded (23.3% of the cases) than acting as invaders (3.5% of the cases; Supplementary Table S8).
Table 3 | Comparative features of SSP-encoding genes occurring in diverse genome environments. All predicted genes SSPs in GC-equilibrated regions Non-SSPs
in borders* within AT-rich Non-SSPs regions
SSPs in
borders* SSPs within AT-rich regions no. 12,469 529 (4.2%) 407 (3.3%) 91 (0.7%) 65 (0.5%) 57 (0.5%) BLAsT hits (%)† 71.3 48.4 60.2 34.1 15.4 8.8 GC content (%) 54.1 54.6 52.9 48.9 51.1 48.2 TpA/ApT 1.04 1.20 1.12 1.49 1.19 1.44 TpA/ApT > 1.5 (%)‡ 6.9 16.4 11.5 36.3 20.0 38.6
EsT, transcriptomic or proteomic support (%) 84.8 77.1 73.7 54.9 56.9 60.0
no. of genes present on the nimbleGen array,
and with transcriptomic support 10,524 396 298 47 35 33
Genes overexpressed in planta 7 dpi (%)§ 9.9 19.1 11.1 36.2 13.9 72.7
Genes overexpressed in planta 14 dpi (%)§ 11.0 15.4 11.8 8.5 22.2 24.2
Average protein size (amino acid) 418.4 167.7 396.1 192.4 111.6 98.6
% Cysteines in the predicted protein 1.7 2.9 1.9 2.1 3.8 4.5
TpA/ApT, frequency of occurrence of dinucleotide TA over dinucleotide AT.
* ‘Borders’ refer to 859 ± 385 bp transition regions between AT-rich and GC-equilibrated genomic regions. †BLAsT to nr cutoff=1×e − 10.
‡Percentage of genes showing a TpA/ApT RIP index above 1.5. This cutoff corresponds to that observed in the majority of RIP-inactivated AvrLm6 alleles39.
§Genes with more than 1.5-fold change in transcript level and an associated P-value < 0.05 were considered as significantly differentially expressed during infection (7 or 14 dpi) compared with growth
In accordance with overlapping divergence time estimates (Figs 1b and 4), these data indicate periods of overlapping transpositional activity for the long terminal repeats retrotransposons that form the major part of AT-blocks. In such a scenario, the later insertions would be preferentially tolerated in existing decayed transposons. These TEs, having undergone RIP in their turn, would initiate a posi-tive reinforcement loop that would create large AT-rich and gene-poor blocks of homogeneous nucleotide composition.
Discussion
The peculiar genomic structure of the L. maculans genome is remi-niscent of that discovered in mammals and some other vertebrates: the base composition (GC-content) varies widely along chromo-somes, but locally, base composition is relatively homogenous. Such structural features have been termed ‘isochores’27. In L. maculans,
AT-blocks are gene-poor, rich in TEs and deficient in recombination compared with GC-blocks, as in mammals27. However, despite these
similarities, these genomic landscapes seem to result from differ-ent mechanisms. In mammals, the evolution of GC-rich isochores is most likely driven by recombination: genomic regions sized between 100 kb to several Mb with a high recombination rate tend to increase in GC content relative to the rest of the genome. This pattern is not due to a mutational effect of recombination, but most probably due to biased gene conversion28. In L. maculans, variations
in base composition occur at a much finer scale (the isochore-like blocks are about 10–20 times smaller than in mammals), and it is
unknown whether biased gene conversion contributes to increase the GC content of GC-blocks. Conversely, L. maculans isochores can be attributed to the AT-biased mutational pattern induced by RIP mutation of TEs and their flanking regions, thus leading to the evolution of AT-rich isochores.
Although the evolutionary forces we postulate shaped the
L. maculans genome are common to many species, no fungal
genome characterized so far has a similar isochore-like structure. This structure reflects extensive genome invasion by TEs that are nonetheless tolerated by the pathogen and the existence of an active RIP machinery (Supplementary Table S6) that has so far been restricted to the Pezizomycotina subphylum of the Ascomycota and maintenance of sexual reproduction (necessary for RIP). Whereas many species seem to have maintained an active RIP machinery, most of the sequenced fungal genomes are poor in TEs, indicat-ing that run-away genome expansion is normally deleterious. Also, many fungal species have lost the ability to cross in nature (for example, Fusarium oxysporum, Magnaporthe oryzae) and no case of large-scale sculpting of repeat-rich regions is found in these species, only some ancient signatures of RIP are found29.
On the basis of the characteristics of avirulence genes in L.
mac-ulans, we have described a comprehensive repertoire of putative
effectors, which has not previously been done for an Ascomycete. In L. maculans, AT-rich blocks are enriched in effector-like sequences. Location of effector genes has been investigated in only some eukaryotic genomes. A few of the effectors of M. oryzae are
Table 4 | Main families and characteristics of transposable elements and other repeats in the L. maculans genome. Genome coverage Size (bp) LTR/TIR size
(bp) Number of copies complete copiesNumber of incomplete Complete/ copies Superfamily Class I (retrotransposons)* LTR: 9 families. 12.30 mb (27.26%) RLG_Olly 3.06 mb 7,246 250 1,085 187 0.172 Ty3/Gypsy RLG_Polly 2.97 mb 6,928 179 1,014 164 0.162 Ty3/Gypsy RLG_Rolly 2.24 mb 11,875 235 594 46 0.077 Ty3/Gypsy RLC_Pholy 3.10 mb 6,981 281 1,020 83 0.081 Ty1/Copia RLG_Dolly 0.30 mb 6,620 228 85 30 0.353 Ty3/Gypsy RLC_Zolly-1 and -2 0.16 mb 5,306 177 97 14 0.144 Ty1/Copia RLx_Jolly 0.02 mb 803 259 57 5 0.088 unknown RLx_Ayoly 0.40 mb 10,397 217 164 8 0.049 unknown
RLG_Brawly 0.05 mb 7,289 none 22 3 0.136 Ty3/Gypsy
Class II (DNA transposons)
TIR: 10 families 1.19 mb (2.64%) DTF_Elwe 199.3 kb 2,173 57 158 54 0.342 Fot1-Pogo DTm_Lenwe 25.6 kb 3,489 49 36 3 0.083 Mutator DTx_Olwe 5.3 kb 866 49 15 4 0.267 unknown DTx_Valwe 11.5 kb 1,793 37 73 2 0.027 unknown DTT_Finwe-1 2.7 kb 529 29 7 4 0.571 Tc1-Mariner DTT_Finwe-2 10.8 kb 523 29 31 11 0.355 Tc1-Mariner DTT_Finwe-3 7.4 kb 806 29 15 4 0.267 Tc1-Mariner
DTm_Sahana 782.8 kb 5,992 none 873 49 0.056 Mutator
DTx_Gimli 112.9 kb 606 none 279 51 0.183 unknown
DTm_Ingwe 33.4 kb 3,582 37 48 1 0.021 Mutator uncharacterized repeats (11 families) 159.9 kb (0.35%) rDnA repeats† 767 kb (1.70%) 7,800‡ > 100 50 Telomeric repeats§ 935.0 kb (2.07%)
* Classification of TEs according to Wicker et al.16: the three-letter code refers to class (R, retrotransposon; D, DnA transposon), order (L, Long terminal repeat—LTR; T, terminal inverted repeat—TIR;
P, Penelope-like element—PLE) and superfamily (G, Gypsy; C, Copia; P, Penelope; F, Fot1-Pogo; T, Tc1-Mariner; m, Mutator, x, unknown superfamily) followed by the family (or subfamily) name italicized. †Including a rDnA-specific LInE element.
‡Excluding variable length short-tandem repeats flanking almost every rDnA repeat.
ARTICLE
nATuRE CommunICATIons | DoI: 10.1038/ncomms1189
subtelomeric30, as are those in protozoan parasites of animals, such
as Plasmodium and Trypanosoma31. Genomes of many Fusarium
species contain supernumerary ‘B’ chromosomes enriched in strain-specific effectors and accounting for the host range of each ‘forma
specialis’32,33. The genome of the oomycete Phytophthora infestans has
a plethora of effector candidates embedded in repetitive DNA, and diversification of these effectors is postulated to occur via segmen-tal duplication and variation in intraspecific copy number, resulting in rapidly diverging multigene families8. The association between
one family of effectors and a LINE in Blumeria graminis, the barley powdery mildew fungus, is proposed to provide a mechanism for amplifying and diversifying effectors34. Diversification of effectors in
the species mentioned above is postulated to be associated with TE-driven gene duplication and generation of multigene families. In the
L. maculans genome, SSP-encoding genes are associated with only a
few TE families, which may indicate the ability of TEs to ‘pickup and move’ effectors. In contrast to the above examples, duplicated effec-tor genes are not present in L. maculans, a finding consistent with the steady inactivation of TEs by RIP and with ancient transposition activity before underdoing RIP.
The origins of some effector genes might be at least partially ascribed to lateral gene transfer, a specialty of species within the Pezizomycotina35–37. Regardless of the origin of the effector genes,
our data suggest that RIP is an important mechanism for generat-ing diversity for genes occurrgenerat-ing within AT-blocks of the genome of
L. maculans, in a manner not previously documented in any other
species. RIP has previously been reported to be restricted to dupli-cated DNA, but most SSPs or other genes in AT-blocks are present in single copies. How, then, can RIP act on SSP-encoding genes?
28S
c
b
a
IGS 18S 5.8S ITS 1 & 2 7.8 kb 7.8 kbrDNA repeats alignment
211.6 423.2 634.8 846.4 1058.0
RIP mutation frequency
kb
1 2 3 4 5 6 7
0
Figure 3 | Repeat-induced point (RIP) mutation in ribosomal DNA of L. maculans shown as RIPCAL output. (a) schematic representation of the rDnA unit in L. maculans (ITs, internal transcribed spacers; IGs, intergenic spacer); (b) a schematic multiple alignment of the 7.8 kb ‘complete’ ribosomal DnA (rDnA) units occurring in superContigs 2 and 19. Polymorphic nucleotides are coloured as a function of the type of RIP mutation observed, with black, invariant nucleotide; red, CpA ← → TpA or TpG ←→ TpA mutations; dark blue, CpC ←→ TpC or GpG ← → GpA mutations; pale blue, CpT ←→ TpT or ApG ←→ ApA mutations; green, CpG ←→ TpG or CpG ←→ CpA mutations; (c) RIP mutation frequency plot over a rolling sequence window, corresponding to the multiple alignment directly above. nucleotide polymorphisms (against the alignment consensus, which is also the highest GC-content sequence) mostly correspond to CpA ←→ TpA or TpG ←→ TpA (red curve) and CpG ←→ TpG or CpG ←→ CpA (green curve).
0 50 100 150 200 0.05 0.10 0.15 0.20
b
a
Density MYA 0 20 40 60 80 100 120 140 DTM_SahanaRLx_Ayoly RLG_Rolly RLC_Phol
y
RLG_Olly DTF_Elwe RLG_Polly DTx_Gimli RLG_Dolly
Transposable element family
MYA RLG_Olly RLG_Polly RLG_Dolly RLG_Rolly RLC_Pholy DTx_Gimli DTM_Sahana
Figure 4 | Dynamics of transposable elements in the L. maculans genome. A phylogenetic analysis was used to retrace the evolutionary history of each transposable element (TE) family after elimination of mutations due to repeat-induced point mutations. Terminal fork branch lengths were assumed to correspond to an evolutionary distance used to estimate the age of the last transposition activity. The divergence values were converted to estimated divergence time using a substitution rate of 1.05×10 − 9 substitution per location per year52,53 (expressed as ‘million years ago’ mYA). (a) Box plot graph of divergence times. The red line represents the median value; the boxes include values between the first and the third quartile of the distribution; squares and circles, first and ninth decile, respectively. (b) Kernel density of divergence plots. A R-script was written to plot a histogram of the terminal fork branch length with kernel density estimate for each family.
Studies in N. crassa indicated that the RIP machinery can occasion-ally overrun the repeated region into adjacent single-copy genes38.
The embedding of SSPs within RIP-degenerated TEs would then favour such RIP leakage (Supplementary Fig. S4c), while selection pressure to maintain functional effectors would prevent them from becoming extinct due to an excessive degree of RIP. This would result in extensive mutation of the affected gene and could account for the mutation rate required for diversifying selection. In con-trast, effector genes that became detrimental to pathogen fitness, such as avirulence genes subjected to resistance gene selection, would be lost rapidly as alleles that have undergone extensive RIP are selected for39. Evidence for this scenario is provided by
exami-nation of RIP indices and in alignment-based studies of alleles of SSPs39. The genes (including SSPs) within AT-blocks had higher
TpA/ApT indices than those in GC-blocks (Table 3; Supplementary Fig. S15), consistent with former genes having been RIP affected. RIP indices for the effectors located within AT-blocks thus would be a compromise between values leading to complete degeneration of the sequence and values enabling sequence diversification while retaining functionality. In plant-pathogen systems, diversifying selection operates on effector genes whose products interact with host proteins25. This has been demonstrated for both resistance
and avirulence genes, but mechanisms for the diversifying selec-tion of effectors have not been proposed. RIP is shown here to be a potential factor to create the genetic (hyper)variation needed for selection to occur in L. maculans, and this process may also act on effectors in other fungi40.
These findings allow speculation about an evolutionary scenario for birth of isochore-like structures in the L. maculans genome and its incidence on effector diversification. First, the genome was invaded by a few families of TEs over a (relatively) short time period, mostly after the separation of L. maculans from other related fungi. This TE invasion is unlikely to have been targeted to pre-existing effector-rich genome regions as seen in microsynteny analyses (Fig. 1a). Accordingly, the most recent invader, DTM_Sahana, is not specifically associated with SSPs. Second, waves of overlapping transposition occurred with probable transduction, translation or duplication of genes, resulting in the large amplification of a few families. Such transpositions were primarily targeted to other TEs as shown by the nesting of retrotransposons within other TEs. In parallel, duplicated copies of TEs and genes (either duplicated or not) hosted within TE-rich regions underwent RIP either to extinction for TEs or to generate gene diversity in cases where a strong selection pressure to retain genes was exerted. This eventu-ally resulted in complete inactivation of transposition events, and the sculpting of the genome in an isochore-like structure. Effector genes were maintained in AT-blocks to favour rapid response to selection pressure39,41 and probable epigenetic concerted regulation
of their expression (Supplementary Fig. S14b). L. maculans shows intriguing evolutionary convergence with both higher eukaryotes in terms of an isochore-like genome structure, and with oomycetes in terms of hosting effectors in highly dynamic ‘plastic’ regions of the genome8. It differs in exploiting a RIP-based mechanism for
diversi-fication and inactivation of effector genes.
The sequencing of genomes of several species or subspecies of the recent and more ancient outgroups that derived from a common ancestor with L. maculans will provide more information on origin of effectors, genome invasion by TEs and the subsequent effect on generation/diversification of effectors, and thus test the validity of the proposed evolutionary scenario.
Methods
Phylogenetic analysis. A taxon set containing representatives of most classes in Ascomycota was selected from the data matrices produced in two previous papers42,43. Sequences were concatenated from the Small Subunit and Large Subunit
of the nuclear ribosomal RNA genes and three protein coding genes, namely the
translation elongation factor-1α and the largest and second largest subunits of RNA polymerase II (Supplementary Table S1). A phylogenetic analysis was per-formed using RAxML v. 7.0.4 (ref. 44) applying unique model parameters for each gene and codon. A combined bootstrap and maximum likelihood (ML) tree search was performed in RAxML with 500 pseudo replicates. The best scoring ML tree was analysed in the program R8sv1.7 (ref. 45) to produce a chronogram (Fig. 1b).
Sequencing and assembly. L. maculans ‘brassicae’ isolate v23.1.3. was sequenced because it harbours numerous avirulence genes, three of which have been cloned by a map-based strategy involving large-scale sequencing of surrounding genomic regions13,15,41. Isolate v23.1.3. results from a series of in vitro crosses between
European field isolates46 and is representative of the populations of the pathogen
prevalent in Europe in the mid-1990s.
DNA was provided as agarose plugs containing partly digested conidia21.
Whole-genome shotgun sequencing of three types of libraries (high-copy-number plasmids with 3.3 kb inserts; low-copy-number plasmids with 10 kb inserts and fos-mids with inserts 35 or 40 kb; Supplementary Table S13) was performed, and also six cDNA libraries, including ones derived from infected plants, were sequenced (Supplementary Table S14). Sequencing reads were assembled using Arachne47
(Table 1) and the correspondence of SCs to chromosome was inferred by aligning the genetic map to the genome sequence, hybridization of single-copy markers to chromosomal DNA separated by pulsed-field gel electrophoresis, identification of telomere-specific repeats, and by mesosynteny analyses (conserved gene content) with genomes of other Dothideomycetes (Supplementary Table S2).
L. maculans genome annotation. Automated structural annotation of the genome was performed using the URGI genomic annotation platform, including pipelines, databases and interfaces, developed or locally set up for fungi. The EuGene predic-tion pipeline v. 3.5a (ref. 48), which integrates ab initio (Eugene_IMM, SpliceMa-chine and Fgenesh 2.6 (www.softberry.com)) and similarity methods (BLASTn, GenomeThreader, BLASTx), was used to predict gene models. The functional annotation pipeline was run using InterProScan49. Genome assembly and
annota-tions are available at INRA (http://urgi.versailles.inra.fr/index.php/urgi/Species/ Leptosphaeria).
Genome assemblies together with predicted gene models and annotations were deposited at DNA European Molecular Biology Laboratory/GenBank under the accession numbers FP929064 to FP929139 (SC assembly and annotations). ESTs were submitted to dbEST under accession nos. FQ032836 to FQ073829.
Full description and associated references for sequencing, assembly and gene annotation are provided as Supplementary Methods.
Annotation and analysis of repeated elements. TEs16 were identified and
an-notated using the ‘REPET’ pipeline (http://urgi.versailles.inra.fr/index.php/urgi/ Tools/REPET), optimized to better annotate nested and fragmented TEs. Repeats were searched with BLASTER for an all-by-all BLASTn genome comparison, clus-tered with GROUPER, RECON and PILER, and consensuses built with the MAP multiple sequence alignment program. Consensuses were classified with BLASTER matches, using tBLASTx and BLASTx against the Repbase Update databank50
and by identification of structural features such as long terminal repeats, terminal inverted repeats16 and so on. Additional steps of clustering and manual curation of
data were performed, resulting in a series of consensuses used as an input for the REPET annotation pipeline part, comprising the TE detection software BLASTER, RepeatMasker and Censor, and the satellite detection softwares RepeatMasker, TRF and Mreps.
Analysis of the dynamics of genome invasion by TEs was first based on phylogenetic analysis of each family of repeats, retracing the evolutionary history, regardless of truncation, insertion in other TEs and deletion events51. After
elimi-nation of all RIP targets, the tree topology was used to retrace the dynamics and demography of TE invasion in the genome. Terminal fork branch lengths from the trees were used to calculate the age of the last transposition events of the cop-ies in the genome. The divergence values were converted in estimated divergence time using a substitution rate of 1.05×10 − 9 nucleotide per site per year as applied
to fungi52,53.
Dynamics of TE aggregation over time was also analysed by a visual analysis of nesting relationships between TEs. Following the long join annotation, mosaics of TEs were visualised using Artemis v. 12.0 (http://www.sanger.ac.uk/Software/ Artemis/) in SC0-22 and a data matrix recording the frequency with which a given TE family was inserted into another one (invader) and the frequency with which one given TE was recipient of an insertion from one or multiple other TEs (invaded TE) was generated (Supplementary Table S8). The statistical identification and significance of the favoured invasion of other TE families as compared with ran-dom association was evaluated with a χ2-test for given probabilities with simulated P-values, based on 20,000 replicates, as implemented in R.
RIP and DeRIP analyses. Automated analysis of RIP in L. maculans genomic DNA repeats was performed using RIPCAL (http://www.sourceforge.net/projects/ ripcal), a software tool that performs both RIP index and alignment-based analyses19.
In addition, RIP indices such as TpA/ApT and (CpA + TpG)/(ApC + GpT) were used to evaluate the effect of RIP on genes or genome regions for which multiple
ARTICLE
nATuRE CommunICATIons | DoI: 10.1038/ncomms1189
alignments could not be generated. DeRIP analyses, which predict putative ancient pre-RIP sequences, were performed using an updated version of RIPCAL, includ-ing the Perl script ‘deripcal’ and ripcal_summarise.
Analysis of AT-blocks. AT- and GC-blocks were manually discriminated from each scaffold using Artemis (http://www.sanger.ac.uk/Software/Artemis/), and a Python script was used to extract sequences and features of AT-blocks. TE content of AT- and GC-blocks was analysed using the REPET pipeline. Size distribution of AT-blocks, occurrence of AT-blocks on chromosomes and relationship between AT-blocks, TE content and chromosome length were calculated.
To evaluate meiotic recombination differences between AT- and GC-blocks, micro- and minisatellites located either in GC-blocks or located on both sides of a single AT-block were mapped in a reference cross, and the number of CO between two consecutive markers was calculated. The recombination frequency between two successive markers was calculated, plotted against the physical distance between the two markers and subjected to analysis of variance and a non-paramet-ric test (Mann–Whitney test) using XLStat, to compare recombination frequencies between and within GC-blocks.
Intergenic distances were compared between AT- and GC-blocks in
L. maculans, and also compared with those of the closely related Dothideomycete, P. nodorum (Supplementary Table S5).
GO annotations were compared between genes occurring in AT- and GC-blocks using the blast2GO program.
Identification and features of SSPs. Non-repeated regions within AT-blocks were identified following masking of TEs with RepeatMasker. The EMBOSS:GETORF program was used on these genomic regions to refine the identification of genes encoding SSPs with a size limit set at 600 amino acids (lower limit: 60 amino acids). A dedicated script combined the outputs of GETORF, FgeneSH and EuGene and a pipeline written in Python screened the predicted proteins according to their size and the presence of signal peptide and transmembrane domains (SignalP 3.0, TargetP and TMHMM). Base composition of the genes encoding SSPs (percent of each base in the sequence, GC content and GC3 content) and amino-acid count of the SSPs (as % of each amino acid in the protein) were calculated by custom Python scripts. Statistical bias in amino acid occurrence was evaluated by an
F-test to determine if the variances were equal in both sets, followed by Student’s t-test (95% confidence level) to compare the mean use of each amino acid in each
set of predicted proteins. Biases in codon usage were evaluated using EMBOSS: CHIPS. A χ2-test for given probabilities with simulated values (20,000 replicates)
as implemented in R was performed to test random association of SSP-encoding genes in AT-blocks with specific TEs. Motifs similar to the RxLR motif neces-sary for oomycete effectors to be translocated within plant cells were sought in predicted SSPs, using a Python script aiming at identification of motifs (〈[RKH] X [LMIFYW] X〉 or 〈[RKH] [LMIFYW] X [RKH]〉).
Analysis of expression patterns of SSP-encoding genes were compared between
in vitro (mycelium grown in axenic medium) and in planta (3, 7 and 14 days after
inoculation of oilseed rape cotyledons), either using the L. maculans whole-genome expression array (manufactured by NimbleGen Systems) or by quantitative reverse transcription-PCR on a selected subset of SSP-encoding genes.
References
1. Skamniotia, P. & Gurr, S. J. Against the grain: safeguarding rice from rice blast disease. Trends Biotechnol. 27, 141–150 (2009).
2. Oliver, R. P. & Solomon, P. S. Recent fungal diseases of crop plants: is lateral gene transfer a common theme? Mol. Plant-Microbe Interact. 21, 287–293 (2008). 3. Rouxel, T. & Balesdent, M. H. The stem canker (blackleg) fungus, Leptosphaeria
maculans, enters the genomic era. Mol. Plant Pathol. 6, 225–241 (2005).
4. Soanes, D. N. et al. Comparative genome analysis of filamentous fungi reveals gene family expansions associated with fungal pathogenesis. Plos One 3, 1–15 (2008).
5. Stergiopoulos, I. & de Wit, P. J. G. M. Fungal effector proteins. Annu. Rev.
Phytopathol. 47, 233–263 (2009).
6. Rouxel, T. & Balesdent, M. H. Avirulence genes. in: Encyclopedia of Life
Sciences (ELS) (John Wiley & Sons, 2010) (doi: 10.1002/9780470015902.
a00212672010).
7. Alfano, J. R. Roadmap for future research on plant pathogen effectors.
Mol. Plant Pathol. 10, 805–813 (2009).
8. Haas, B. J. et al. Genome sequence and analysis of the Irish potato famine pathogen Phytophthora infestans. Nature 461, 393–398 (2009).
9. Jiang, R. H. Y., Tripathy, S., Govers, F. & Tyler, B. M. RXLR effector reservoir in two Phytophthora species is dominated by a single rapidly evolving super-family with more than 700 members. Proc. Natl Acad. Sci. USA 105, 4874–4879 (2008).
10. Tyler, B. M. et al. Phytophthora genome sequences uncover evolutionary origins and mechanisms of pathogenesis. Science 313, 1261–1266 (2006).
11. Kämper, J. et al. Insights from the genome of the biotrophic fungal plant pathogen Ustilago maydis. Nature 444, 97–101 (2006).
12. Elliott, C. E., Gardiner, D. M., Thomas, G., Cozijnsen, A. J., van de Wouw, A. & Howlett, B. J. Production of the toxin sirodesmin PL by Leptosphaeria maculans during infection of Brassica napus. Mol. Plant Pathol. 8, 791–802 (2007). 13. Fudal, I. et al. Heterochromatin-like regions as ecological niches for avirulence
genes in the Leptosphaeria maculans genome: map-based cloning of AvrLm6.
Mol. Plant-Microbe Interact. 20, 459–470 (2007).
14. Huang, Y. J., Li, Z. Q., Evans, N., Rouxel, T., Fitt, B. D. L. & Balesdent, M. H. Fitness cost associated with loss of the AvrLm4 function in Leptosphaeria
maculans (Phoma stem canker of oilseed rape). Eur. J. Plant Pathol. 114, 77–89
(2006).
15. Parlange, F. et al. Leptosphaeria maculans avirulence gene AvrLm4-7 confers a dual recognition specificity by Rlm4 and Rlm7 resistance genes of oilseed rape, and circumvents Rlm4-mediated recognition through a single amino acid change. Mol. Microbiol. 71, 851–863 (2009).
16. Wicker, T. et al. A unified classification system for eukaryotic transposable elements. Nat. Rev. Genet. 8, 973–982 (2007).
17. Idnurm, A. & Howlett, B. J. Analysis of loss of pathogenicity mutants reveals that repeat-induced point mutations can occur in the Dothideomycete
Leptosphaeria maculans. Fungal Genet. Biol. 39, 31–37 (2003).
18. Espagne, E. et al. The genome sequence of the model ascomycete fungus
Podospora anserina. Genome Biol. 9, R77 (2008).
19. Hane, J. K. & Oliver, R. P. RIPCAL: a tool for alignment-based analysis of repeat-induced point mutations in fungal genomic sequences. BMC
Bioinformatics 9, 478 (2008).
20. Feschotte, C., Keswani, U., Ranganathan, N., Guibotsy, M. L. & Levine, D. Exploring repetitive DNA landscapes using REPCLASS, a tool that automates the classification of transposable elements in Eukaryotic genomes. Genome
Biol. Evol. 1, 205–220 (2009).
21. Leclair, S., Ansan-Melayah, D., Rouxel, T. & Balesdent, M. H. Meiotic behaviour of the minichromosome in the phytopathogenic ascomycete
Leptosphaeria maculans. Curr. Genet. 30, 541–548 (1996).
22. Gladyshev, E. A. & Arkhipova, I. R. Telomere-associated endonuclease-deficient Penelope-like retroelements in diverse eukaryotes. Proc. Natl Acad. Sci
USA 104, 9352–9357 (2007).
23. Howlett, B. J., Cozijnsen, A. J. & Rolls, B. D. Organisation of ribosomal DNA in the ascomycete Leptosphaeria maculans. Microbiol. Res. 152, 1–7 (1997). 24. Selker, E. U. Premeiotic instability of repeated sequences in Neurospora crassa.
Annu. Rev. Genet. 24, 579–613 (1990).
25. Stukenbrock, E. H. & McDonald, B. A. Population genetics of fungal and oomycete effectors involved in gene-for-gene interactions. Mol. Plant-Microbe
Interact. 22, 371–380 (2009).
26. Kale, S. D. et al. External lipid PI-3-P mediates entry of eukaryotic pathogen effectors into plant and animal host cells. Cell 142, 284–295 (2010). 27. Eyre-Walker, A. & Hurst, L. D. The evolution of isochores. Nat. Rev. Genet. 2,
549 (2001).
28. Duret, L. & Galtier, N. Biased gene conversion and the evolution of mammalian genomic landscapes. Annu. Rev. Genomics Hum. Genet. 10, 285–311 (2009). 29. Ikeda, K. et al. Repeat-induced point mutation (RIP) in Magnaporthe grisea:
implications for its sexual cycle in the natural field context. Mol. Microbiol. 45, 1355–1364 (2002).
30. Farman, M. L. Telomeres in the rice blast fungus Magnaporthe oryzae: the world of the end as we know it. FEMS Microbiol. Lett. 273, 125–132 (2007). 31. Pain, A. et al. The genome of the simian and human malaria parasite
Plasmodium knowlesi. Nature 455, 799–803 (2008).
32. Ma, L. J. et al. Comparative genomics reveals mobile pathogenicity chromosomes in Fusarium oxysporum. Nature 464, 367–373 (2010). 33. Coleman, J. J. et al. The genome of Nectria haematococca: contribution of
supernumerary chromosomes to gene expansion. PloS Genet. 5, e1000618 (2009). 34. Sacristan, S. et al. Coevolution between a family of parasite virulence effectors
and a class of LINE-1 retrotransposons. PloS One 4, e7463 (2009). 35. Friesen, T. L. et al. Emergence of a new disease as a result of interspecific
virulence gene transfer. Nat. Genet. 38, 953–956 (2006).
36. Marcet-Houben, M. & Gabaldón, T. Acquisition of prokaryotic genes by fungal genomes. Trends Genet. 26, 5–8 (2010).
37. Khaldi, N. & Wolfe, K. H. Elusive origins of the extra genes in Aspergillus
oryzae. Plos One 3, e3036 (2008).
38. Irelan, J. T., Hagemann, A. T. & Selker, E. U. High frequency repeat-induced point mutation (RIP) is not associated with efficient recombination in
Neurospora. Genetics 138, 1093–1103 (1994).
39. Fudal, I. et al. Repeat-induced point mutation (RIP) as an alternative mechanism of evolution towards virulence in Leptosphaeria maculans. Mol.
Plant-Microbe Interact. 22, 932–941 (2009).
40. Stergiopoulos, I., De Kock, M. J. D., Lindhout, P. & de Wit, P.J.G.M. Allelic variation in the effector genes of the tomato pathogen Cladosporium fulvum reveals different modes of adaptive evolution. Mol. Plant-Microbe Interact. 20, 1271–1283 (2007).
41. Gout, L. et al. Genome structure impacts molecular evolution at the AvrLm1 avirulence locus of the plant pathogen Leptosphaeria maculans. Environ.
42. Schoch, C. L. et al. A class-wide phylogenetic assessment of Dothideomycetes.
Stud. Mycol. 64, 1–15S10 (2009).
43. Schoch, C. L. et al. The Ascomycota Tree of Life: a phylum-wide phylogeny clarifies the origin and evolution of fundamental reproductive and ecological traits. Syst. Biol. 58, 224–239 (2009).
44. Stamatakis, A. RAxML-VI-HPC: maximum likelihood-based phylogenetic analyses with thousands of taxa and mixed models. Bioinformatics 22, 2688–2690 (2006).
45. Sanderson, M. J. r8s: inferring absolute rates of molecular evolution and divergence times in the absence of a molecular clock. Bioinformatics 19, 301–302 (2003).
46. Balesdent, M. H., Attard, A., Ansan-Melayah, D., Delourme, R., Renard, M. & Rouxel, T. Genetic control and host range of avirulence toward Brassica napus cultivars Quinta and Jet Neuf in Leptosphaeria maculans. Phytopathology 91, 70–76 (2001).
47. Jaffe, D. B. et al. Whole-genome sequence assembly for mammalian genomes: Arachne 2. Genome Res. 13, 91–96 (2003).
48. Foissac, S. et al. Genome annotation in plants and fungi: EuGene as a model platform. Curr Bioinformatics 3, 87–97 (2008).
49. Quevillon, E. et al. InterProScan: protein domains identifier. Nucleic Acids Res.
33 (Suppl. 2), W116–W120 (2005).
50. Jurka, J., Kapitonov, V. V., Pavlicek, A., Klonowski, P., Kohany, O. & Walichiewicz, J. Repbase Update, a database of eukaryotic repetitive elements.
Cytogenet. Genome Res. 110, 462–467 (2005).
51. Fiston-Lavier, A. S. Etude de la dynamique des répétitions dans les génomes eucaryotes: de leur formation à leur élimination. PhD Thesis, University Pierre et Marie Curie, Paris, France (2008).
52. Berbee, M. L. & Taylor, J. W. Dating the molecular clock in fungi—how close are we? Fungal Biol. Rev. 24, 1–16 (2010).
53. Kasuga, T., White, T. J. & Taylor, J. W. Estimation of nucleotide substitution rates in Eurotiomicete fungi. Mol. Biol. Evol. 19, 2318–2324 (2002). 54. Rouxel, T., Balesdent, M.H., Amselem, J. & Howlett, B. J. GnpGenome:
a Genome Browser for Leptosphaeria maculans structural annotation (2010)http://urgi.versailles.inra.fr/cgi-bin/gbrowse/lmaculans_pub/. 55. Hane, J. K. et al. Dothideomycete plant interactions illuminated by genome
sequencing and EST analysis of the wheat pathogen Stagonospora nodorum.
Plant Cell 19, 3347–3368 (2007).
56. Cuiffetti, L. M. Pyrenophora tritici-repentis database (2008) http://www. broadinstitute.org/annotation/genome/pyrenophora_tritici_repentis/Home.html. 57. Turgeon, B. G. Cochliobolus heterostrophus C5 whole genome project (2008)
http://genome.jgi-psf.org/CocheC5_1/CocheC5_1.home.html. 58. Lawrence, C. B. Alternaria brassicicola whole genome project (2006)
http://genome.jgi-psf.org/Altbr1/Altbr1.home.html.
59. Goodwin, S. B. & Kema, G. H. J. Mycosphaerella graminicola whole genome project (2008) http://genome.jgi-psf.org/Mycgr3/Mycgr3.home.html.
Acknowledgments
We acknowledge Marc-Henri Lebrun (INRA-Bioger) and Francis Martin (INRA, Interactions arbres/micro-organismes, Champenoux, France) for support and advice. The genome sequencing of L. maculans was funded by the Genoscope, Institut de Génomique, CEA, France. The establishment of databases and interfaces was funded by Agence Nationale de la Recherche (GnpAnnot project; ANR-07-GPLA-051G). Whole-genome effector analysis was funded by ANR (FungEffector project; ANR-06-BLAN-0399). Recombination analysis and P.B. were funded by ANR (AvirLep project; ANR-07-GPLA-015). B.J.H and R.P.O. thank the Australian Grains Research and Development Corporation for funding. C.L.S was supported in part by the Intramural Research Program of the NIH, National Library of Medicine. J.W.S acknowledges support from the
U.S. National Science Foundation, grant number DEB-0717476. B.M.T. was supported in part by the U.S. National Science Foundation, grant number IOS-0924861. Thanks are due to INRA-SPE department, the ‘Leptosphaeria maculans’ scientific and applied community, and the ‘Dothideomycete’ community for support of the L. maculans genome initiative.
Author contributions
J.K.H., C.H., A.P.vdW, A.C. and V.D. contributed equally to this work as second authors. J.A., H.Q., R.P.O., P.W., M.H.B. and B.J.H. coordinated genome sequencing, annotation and data analyses, and made equivalent contributions as senior authors. Individual contributions were as follows: T.R., M.H.B. and B.J.H. initiated the sequencing project; M.H.B was responsible for DNA production; P.W. and J.W. coordinated the sequencing; J.P., A.C. and V.A. performed the sequencing and assembled the genome; J.A. was responsible for annotation pipelines, databases and interfaces; V.D., C.H., and J.A. did the ab initio annotation of gene models; M.M., A.J.C. and B.J.H. provided EST/cDNA information; and V.D., C.H. and J.A. did the cDNA clustering, defined the training set for ab initio gene finder steps and inserted annotation data in the database. Genome statistics were performed by J.A., H.Q., and J.G. J.K.H., R.P.O. and J.G. carried out the genome synteny analyses; M.H.B., P.B., L.G., A.J.C., A.P.vdW., A.St., and J.G. identified and designed mini- and microsatellite markers; M.H.B and A.P.vdW. built the genetic maps; J.K.H. and R.P.O. performed mesosynteny and RIPCAL analyses; A.J.C. and K.M. hybridized electrokaryotypes and annotated NRPSs and PKSs; H.Q., V.D., L.G. and T.R. analysed TEs; V.D. and J.G. estimated time for TE transposition events; J.G., T.R. and M.H.B. analysed TE nesting; N.L. performed automated functional analysis; N.L. and S.B. performed GO analyses; B.M.T. and J.G. carried out RXLR analysis of effector candidates; I.F., A.Si., J.G., B.O. and J.L. designed microarrays and analysed microarray data; A.De., B.O., N.G. and I.F. performed expression analysis of effectors by reverse transcription-PCR and quantitative reverse transcription-transcription-PCR; A.Di. analysed polymorphism of effectors in field populations. D.V. carried out proteomic and secretomic analyses. L.M.C., S.B.G., C.B.L., G.H.J.K. and B.G.T. contributed to comparative genomics approaches. L.D. analysed isochores-like blocks and contributed to comparative analysis with those of mammals. C.L.S. and J.W.S. performed phylogenetic analyses and estimated divergence time. T.R. organized co-ordination between groups. T.R. wrote and edited the paper with major input from B.J.H. and R.P.O. Final editing of the text, Tables and Figures was done by S.B., J.G., M.H.B., B.J.H. and T.R.
Additional information
Acccession codes: Genome assemblies together with predicted gene models and annotations have been deposited in the DNA European Molecular Biology Laboratory/ GenBank nucleotide core database under the accession numbers FP929064 to FP929139 (SC assembly and annotations). ESTs were submitted to dbEST under accession numbers FQ032836 to FQ073829. Oligo array data has been deposited in the gene Expression Omnibus under accession code GSE27152.
Supplementary Information accompanies this paper at http://www.nature.com/ naturecommunications
Competing financial interests: The authors declare no competing financial interests. Reprints and permission information is available online at http://npg.nature.com/ reprintsandpermissions/
How to cite this article: Rouxel, T. et al. Effector diversification within compartments of the Leptosphaeria maculans genome affected by repeat-induced point mutations.
Nat. Commun. 2:202 doi: 10.1038/ncomms1189 (2011).
License: This work is licensed under a Creative Commons Attribution-NonCommercial-Share Alike 3.0 Unported License. To view a copy of this license, visit http://