HAL Id: hal-02478065
https://hal.archives-ouvertes.fr/hal-02478065
Submitted on 4 Aug 2020
HAL is a multi-disciplinary open access
archive for the deposit and dissemination of
sci-entific research documents, whether they are
pub-lished or not. The documents may come from
teaching and research institutions in France or
abroad, or from public or private research centers.
L’archive ouverte pluridisciplinaire HAL, est
destinée au dépôt et à la diffusion de documents
scientifiques de niveau recherche, publiés ou non,
émanant des établissements d’enseignement et de
recherche français ou étrangers, des laboratoires
publics ou privés.
Boumerdès-Zemmouri (Algeria) Earthquake: Field
Investigations on the French Mediterranean Coast and
Tsunami Modelling
A. Sahal, J. Roger, S. Allgeyer, B. Lemaire, H. Hébert, F. Schindelé, F.
Lavigne
To cite this version:
A. Sahal, J. Roger, S. Allgeyer, B. Lemaire, H. Hébert, et al.. The Tsunami Triggered by the 21 May
2003 Boumerdès-Zemmouri (Algeria) Earthquake: Field Investigations on the French Mediterranean
Coast and Tsunami Modelling. Natural Hazards and Earth System Sciences, European Geosciences
Union, 2009, 9 (6), pp.1823–1834. �10.5194/nhess-9-1823-2009�. �hal-02478065�
www.nat-hazards-earth-syst-sci.net/9/1823/2009/ © Author(s) 2009. This work is distributed under the Creative Commons Attribution 3.0 License.
and Earth
System Sciences
The tsunami triggered by the 21 May 2003 Boumerd`es-Zemmouri
(Algeria) earthquake: field investigations on the French
Mediterranean coast and tsunami modelling
A. Sahal1, J. Roger2,3, S. Allgeyer2, B. Lemaire2, H. H´ebert2, F. Schindel´e2, and F. Lavigne1
1Universit´e Paris 1 Panth´eon-Sorbonne, Laboratoire de G´eographie Physique, UMR 8591, 1 place Aristide Briand, 92195
Meudon Cedex, France
2CEA, DAM, DIF, Bruy`eres le Chˆatel, 91297 Arpajon Cedex, France
3Centro de Geofisica da Universidade de Lisboa, Rua Ernesto de Vasconcelos, Faculdade de Ci`encias Ed. C8, 6◦,
1700 Lisboa, Portugal
Received: 2 April 2009 – Revised: 27 August 2009 – Accepted: 2 October 2009 – Published: 10 November 2009
Abstract. A field survey was organized on the French
Mediterranean coasts to investigate the effects of the tsunami induced by the 21 May 2003 Boumerd`es-Zemmouri
(Alge-ria) earthquake (Mw=6.9). The results show that eight
har-bours were affected by important sea level disturbances that caused material loss. Unfortunately, the low sampling rate of the French tide gage records (10 min) does not allow for a proper evaluation of the tsunami wave amplitudes since these amplitudes were probably underestimated in the har-bours where these sensors are installed. The survey brings to light regional and local contrasts among the harbours’ hy-drological responses to the tsunami.
To better understand these contrasts, a numerical simula-tion of the sea level elevasimula-tions induced by the tsunami was conducted. The simulation showed a certain correlation be-tween the field results and the wave amplification along the coast; however it underestimated the observed phenomena. Another simulation was then conducted using high resolution bathymetric grids (space step of 3 m) centred more specifi-cally on 3 neighbouring harbours, however, again the simu-lation results did not match the amplitudes recorded through the observations. In order to better understand the wave am-plification mechanisms inside each grid, a Gaussian signal was virtually broadcasted from the source to the harbours. Virtual sensors identified the periods which are stimulated – or not – by the arrival of the signal in each grid. Comparing these periods with those previously recorded emphasizes the proper period of each waterbody.
Correspondence to: A. Sahal
(alexandre@sahal.fr)
This paper evaluates the limitations of such a study, fo-cusing specifically on (1) the importance of having accurate and precise data about the source (the lack of information about the signal amplitude leads to an underestimation of the tsunami, thus reproducing only a fourth to a third of the ob-served phenomenon), (2) the need for networked tide gages with high resolution records and short sampling rates, and (3) the importance of conducting field studies immediately after a tsunami occurs.
1 Introduction
The Western Mediterranean coasts have suffered from tsunamis in the past, and their present exposure to future tsunami hazard is undeniable. In this geographical location, three main regions are identifiable sources (seismic, as well as submarine landslide sources) for tsunamis:(1) the region of the Ligurian sea from Sanremo to Livorno (Italy) where seismic activities have triggered many devastating tsunamis, such as the earthquake-induced tsunami of 1887 (Eva and Rabinovich, 1997); (2) Sicily and the Aeolian Islands (Italy) which were the sources of numerous tsunamis triggered by eruption-induced submarine landslides (Tinti et al., 2004; Maramai et al., 2005; Gerardi et al., 2008), or triggered by earthquakes, as was the case of Catania in 1693 (Gutscher et al., 2006); and (3) the North-African margin which was a source that triggered several noticeable tsunamis, such as in 1365 and in 1856 (Roger and H´ebert, 2008), as well as in 1980 when the El Asnam earthquake triggered a small tsunami that moderately impacted the Spanish shoreline (as shown by tide gauge observations) (Soloviev, 2000).
Background seismicity (1998-2005) (CSEM-EMSC) 0˚ 5˚E 35˚N 35˚N 40˚N 45˚N 45˚N 19:05 19:25 19:45 20:05 20:25 20:45 20:25 19:05 19:25 19:45 20:05 20:25 20:45 20:25 20:15 20:15 ETA (GMT) -5000 -3000 -1000 0 1000 3000 5000 m 21 May 2003 18:44, Mw=6.9 SR = 10 min 0,5 1,0 Cagliari SR = 10 min 0,5 1,0 Carloforte SR = 10 min 0,5 1,0 P.Empedocle SR = 10 min 0,5 1,0 Palermo SR = 10 min 0,5 1,0 Livorno SR = 10 min 0,5 1,0 Genoa 20:40 SR = 10 min 0,5 1,0 Imperia SR = 1 min 0,5 1,0 Palma 19:35 SR = 5 min 0,5 1,0 Ibiza 19:34 SR = 2 min 0,5 1,0 Sant Antoni 19:45 SR = 10 min 0,5 1,0 Almeria SR = 5 min 0,5 1,0 Malaga SR = 10 min 0,5 1,0 P. Alicante SR = 10 min 0,5 1,0 Alicante SR = 5 min 0,5 1,0 Valencia SR = 5 min 0,5 1,0 Barcelona SR = 10 min 0,5 1,0 Senetosa 19:50 SR = 10 min 0,5 1,0 Ajaccio 19:50 SR = 10 min 0,5 1,0 Monaco 20:20 SR = 10 min 0,5 1,0 Nice 20:20 SR = 10 min 0,5 1,0 Toulon 20:40 SR = 10 min 0,5 1,0 Marseilles Digital -ized 0,5 1,0 Sète 20:50 SR = 10 min 0,5 1,0 Algiers 18:48
Tide gage max. sea elevation rec. (m),
time of arrival (GMT), SR= sampling rate SR = 10 min 0,5 1,0 Genoa 20:40
France
France
Morroco
Morroco
Italy
Italy
Spain
Spain
Tunisia
Tunisia
Algeria
Algeria
Fig. 1. The 21 May 2003 tsunami in the Western Mediterranean Sea: estimated travel time and tide gage records. The background seismicity depicts the 2003 seismic crisis. The tsunami travel times (red lines) were computed using the TTT SDK v 3.2 (http://www.geoware-online. com/). The colour code for the tide gage stations indicates the various sampling rates for the data acquisition (see text for details).
The French Mediterranean coast was affected by some of these tsunamis, and additionally has suffered from the im-pact of local submarine landslides, such as in 1979, when the Nice airport embankment collapsed and triggered a tsunami affecting the Baie des Anges, and more specifically, Antibes (Assier-Rzadkiewicz et al., 2000).
More recently, on 21 May 2003 at 18:44 UTC, an
earth-quake of moment magnitude Mw=6.9 occurred in the region
of Boumerd`es-Zemmouri, Algeria, generating a tsunami which reached the Western Mediterranean coasts in a time span of a few minutes to several hours (Alasset et al., 2006). Figure 1 shows the maximal sea level elevations recorded by the tide gages of the Western Mediterranean Sea.
The tide gages in operation in 2003 recorded sea level el-evations ranging from a few centimetres in Sardinia (Italy)
to a meter in the Balearic Islands (Spain). The sampling rates from the tide gages vary from 1 to 10 min. Figure 1 shows that the tide gages with precise sampling rates (less than 5 min, coloured in green) were the only ones to record significant sea level variations (with the exception of Puerto Alicante). In fact, tide gages with sampling rates equal to or larger than 10 min (coloured in grey) are ineffective in recording all the amplitudes of tsunami-induced sea level os-cillations because such osos-cillations happen to have too short main periods (between 15 and 20 min) compared to the sam-pling interval.
Therefore, the French and Italian tide gage records are not sufficient to evaluate the local impact of the 21 May 2003 Boumerd`es-Zemmouri tsunami on the French Mediterranean coast. Consequently, a witness-based investigation along the
shoreline was required to assess the actual impact of this tsunami. In May 2007, a three month field investigation be-gan on the French Riviera and in Corsica to assess if any-one had noticed sea level variations during the evening and the night of 21–22 May 2003, and to build an observation database.
The aim of this article is to: (1) expose the methodology and the results of this field investigation, (2) determine if the simulation can reproduce the same effects using different ap-proaches, (3) improve the understanding of the resonance ef-fects along a tsunami path through frequency analysis, and (4) identify what can be improved concerning data collec-tion in the Western Mediterranean Sea, and more specifically on the French coast, to better understand and mitigate the tsunami hazard.
2 Building a database based on harbour observations
2.1 Field investigation methodology
Figure 1 shows that the tsunami triggered at 18:44 UTC in Algeria should have begun impacting the French coasts around 20:10 UTC (21:10 LT). Since the tsunami occurred at night and during the holiday off-season, the field investiga-tion methodology had to be adapted to account for a poten-tial lack of witnesses, as no one may have been present on the beaches. Therefore, potential witnesses would have been people living on their boats or working in the harbours at night. Consequently, the investigation concentrated mostly on harbours: a total of 135 harbours were contacted and al-most all of the harbours accepted to consult their surveillance logs – if one existed – for the night of 21–22 May 2003. Dur-ing three months, a widely diffused “call for witnesses” was posted in each harbour office next to the meteorological fore-casts which are consulted daily by people who sail and fish offshore. The poster asked those who had noticed any hy-drological phenomena during the night of 21–22 May 2003 to call a dedicated phone number.
Coast guards, semaphores, the Maritime Rescue Co-ordination (CROSS) and commercial harbour pilots were also contacted. They agreed to verify their logs for anomalies during the evening and night of 21–22 May 2003. Figure 2 shows the location of investigated harbours and semaphores. It should be noted that harbours and semaphores cover most of the French seashore, and for the purpose of this study, they represent a comprehensive view of the studied terrain.
Eye-witnesses participated in a semi-directed interview. These interviews were adapted to the specific context of observation: direct observation from a wharf, from a boat alongside the quay, from a boat offshore, or from a specific location (observation tower, semaphore, for example). De-tails about hydrological phenomena were collected concern-ing unusual currents, siphons, sea-level variations and/or the
corresponding consequences (for example boats moving and making specific noises, boats touching the sea-bottom, etc.). Noticeable impacts were also noted: broken mooring lines, sunken boats, displaced two-ton moorings, etc. The chrono-logical timeline and the physical measurements of these hy-drological phenomena, as well as their impacts, were col-lected as precisely and as often as possible. Written informa-tion from the harbour offices’ logs was collected and studied when it described unusual phenomena.
Every local, regional and national newspaper archive was also reviewed. The review focused on the week following the earthquake.
2.2 Results and discussion
Of the 135 harbours that were investigated, only 66 had the capacity to observe any unusual hydrological phenomenon
through their nocturnal surveillance structure. Of the
66, only 8 harbours noticed hydrological anomalies which could be attributed to the 21 May 2003 earthquake-induced tsunami. The other 69 harbours did not have the nocturnal structures needed and were therefore unable to notice if any-thing had happened during the night. Also, the following day, they did not notice any consequences of any hydrologi-cal anomaly. This is not to say that nothing happened, rather it could mean the phenomenon did not leave any noticeable damage. Figure 3 focuses on the Eastern part of the French Riviera (yellow frame on Fig. 2), which appears to be the only affected area.
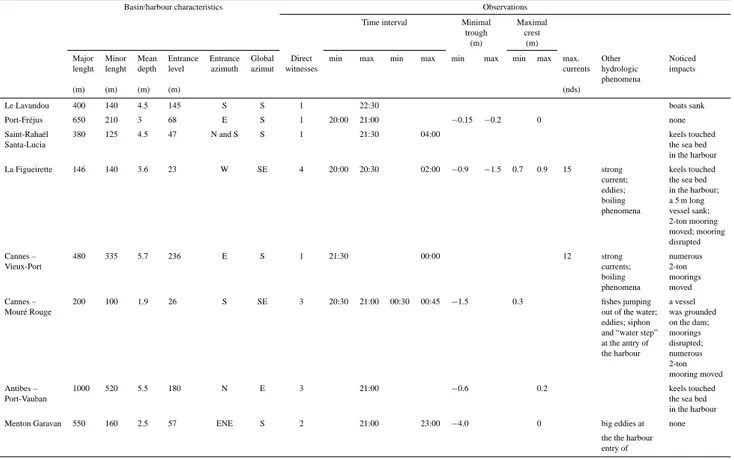
Table 1 illustrates the characteristics of each harbour, the number of direct witnesses and the corresponding phenom-ena. It also shows the chronological timeline of the sea level variation as reported by the witnesses.
Not all harbours were affected by the tsunami in this area. The affected harbours are quite different from each other: various sizes, azimuths of the entrance and of the coast, etc. Most of them were affected by sea elevation variations and boiling phenomena. Of the 8 affected harbours, 6 suffered
material loss. La Figueirette and Mour´e-Rouge harbours
were the most affected: they both suffered from a high am-plitude drop of the sea level (0.9 to 1.5 m and 1.5 m, respec-tively). At the same time, Cannes – Vieux-Port was less af-fected by sea-level variations. To better understand these dif-ferences at a local level, modelling was focused on this area (Fig. 4).
These results have practical limitations. On the one hand, it is quite difficult for witnesses to remember the precise time the event occurred, especially several years after the event. On the other hand, some witnesses are sailors who know their boat and the bathymetry of the harbours quite well. They can easily estimate the sea level variations since they need to adjust their moorings according to the sea level. Other witnesses were working as harbour guards during the night of 21–22 May 2003 and were able to take note of anomalies at precise hours.
8°0'0"E 8°0'0"E 6°0'0"E 6°0'0"E 4°0'0"E 4°0'0"E 44°0'0"N 44°0'0"N 42°0'0"N 42°0'0"N 0 50 100 km Harbours (135) Semaphores (17) France
France ItalyItaly
Spain Spain Nice Nice Marseille Marseille Toulon Toulon Ajaccio Ajaccio Montpellier Montpellier 0 50 100 km
Fig. 2. Location of the investigated harbours and semaphores on the French seashore (background ESRI).
20:20 20:20 20:25 20:25 20:25 20:25 20:20 20:20 7°30'0"E 7°30'0"E 7°0'0"E 7°0'0"E 6°30'0"E 6°30'0"E 43°30'0"N 43°30'0"N 43°0'0"N 43°0'0"N 1 2 3 4 5 6 7 8 ItalyItaly France
France NiceNice
Hyères Hyères 1 Le Lavandou Saint-Raphaël Santa-Lucia La Figueirette Cannes - Vieux-Port Cannes - Mouré-Rouge Antibes - Port-Vauban Menton Garavan Port-Fréjus 2 3 4 5 6 7 8 Unaffected harbours ! 0 15 30 km 0 15 30 km Affected harbours
Fig. 3. Location of the harbours affected or supposedly unaffected by the 21 May 2003 earthquake-induced tsunami (background ESRI).
7°10'0"E 7°10'0"E 7°5'0"E 7°5'0"E 7°0'0"E 7°0'0"E 6°55'0"E 6°55'0"E 43°30'0"N 43°30'0"N 43°25'0"N 43°25'0"N -28 -24 -20 -16 -12 -8 -4 0 4 8 12 m Cannes Cannes Mandelieu-la-Napoule 0 4 8 km 0 22 4 8 km 0 100 200 m. Cannes - Mouré-Rouge 0 500 m. Cannes - Vieux-Port 0 100 200 m. La Figueirette
Table 1. French harbours affected by the 21 May 2003 tsunami: characteristics and observed hydrological phenomena according to witnesses.
Basin/harbour characteristics Observations
Time interval Minimal Maximal
trough crest
(m) (m)
Major Minor Mean Entrance Entrance Global Direct min max min max min max min max max. Other Noticed
lenght lenght depth level azimuth azimut witnesses currents hydrologic impacts
phenomena
(m) (m) (m) (m) (nds)
Le Lavandou 400 140 4.5 145 S S 1 22:30 boats sank
Port-Fr´ejus 650 210 3 68 E S 1 20:00 21:00 −0.15 −0.2 0 none
Saint-Raha¨el 380 125 4.5 47 N and S S 1 21:30 04:00 keels touched
Santa-Lucia the sea bed
in the harbour
La Figueirette 146 140 3.6 23 W SE 4 20:00 20:30 02:00 −0.9 −1.5 0.7 0.9 15 strong keels touched
current; the sea bed
eddies; in the harbour;
boiling a 5 m long
phenomena vessel sank;
2-ton mooring moved; mooring disrupted
Cannes – 480 335 5.7 236 E S 1 21:30 00:00 12 strong numerous
Vieux-Port currents; 2-ton
boiling moorings
phenomena moved
Cannes – 200 100 1.9 26 S SE 3 20:30 21:00 00:30 00:45 −1.5 0.3 fishes jumping a vessel
Mour´e Rouge out of the water; was grounded
eddies; siphon on the dam;
and “water step” moorings
at the antry of disrupted;
the harbour numerous
2-ton mooring moved
Antibes – 1000 520 5.5 180 N E 3 21:00 −0.6 0.2 keels touched
Port-Vauban the sea bed
in the harbour
Menton Garavan 550 160 2.5 57 ENE S 2 21:00 23:00 −4.0 0 big eddies at none
the the harbour entry of
Nevertheless, in order to build observation databases a
large number of testimonies are needed. Unfortunately,
only a few could be recorded. The lack of witnesses can be explained by the phenomenon’s arrival late at night on the French coasts (after 21:00 LT). Video surveillance tapes could have been more objective witnesses, but they are not kept longer than a month. Therefore it is essential that such field investigations be processed as soon as an event occurs since time is a crucial factor.
To better understand these observations, the tsunami was modelled in the Western Mediterranean Sea and the effects on the three selected harbours of the French Riviera were simulated.
3 Tsunami modelling
3.1 Generalities
The method applied to model tsunami initiation, propaga-tion and coastal impact has been in development for several years with the objective of studying tsunami hazards in re-gions such as French Polynesia (Sladen et al., 2007) and the Mediterranean Sea (Alasset et al., 2006; Roger and H´ebert, 2008), and to better understand the source characteristics of
tsunamigenic earthquakes (H´ebert et al., 2005; Sladen and H´ebert, 2008). The initial sea surface elevation is obtained from the sea bottom co-seismic deformation (computed us-ing the Okada formula, 1985), and considers a full and in-stantaneous deformation from the bottom to the surface of the sea. Then, to calculate the propagation, the hydrodynam-ical equations are solved, under the non-linear shallow wa-ter approximation, with a finite difference Crank Nicolson scheme applied to a series of nested bathymetric grids to ac-count for the shoaling effect that occurs close to shores. It is worth noting that for this type of shallow water propagation, the tsunami propagation is non-dispersive, and the celerity equation depends only on water depth.
In the present case, different authors attempted to describe the seismic event, proposing different sources and deforma-tion scenarios, based either on seismic or GPS data (Delouis et al., 2004; Mourad Bezzeghoud, University of Evora, Por-tugal, personal communication in 2006; Meghraoui et al., 2004; Semmane et al., 2005; Yelles et al., 2004; parameters are described in Table 2).
All of these scenarios have been tested and the results in-dicate that several sources match the tide gage records in the Balearic Islands fairly well, especially Delouis’. How-ever, even though the phases were properly modelled, the
Table 2. Sources and characteristics of the 21 May 2003 earthquake according to various authors.
Delouis Bezzeghoud Meghraoui Semmane Yelles Longitude 36.83◦N 36.83◦N 36.83◦N 36.83◦N 36.91◦N Latitude 3.65◦E 3.65◦E 3.65◦E 3.65◦E 3.65◦E Depth of the fault centre (km) ∼6 ∼8 ∼8 ∼16 ∼9 Strike (◦) 70 64 54 54 60 Dip (◦) 45 50 50 47 42 Rake (◦) 95 111 90 90 84 Length (km) 60 50 54 64 32 Width (km) 24 16 15 32 14
computed amplitudes proved to be too low to fit the data (Alasset et al., 2006). Thus, given that all of the seismic sources yielded nearly similar results in terms of tsunamis, the source proposed by Delouis et al. (2004) was the one cho-sen in this study for the purpose of modelling.
The main bathymetric grid used for tsunami modelling
includes the entire Western Mediterranean Sea. It was
built from GEBCO data (GEneral Bathymetric Chart of the Oceans, British Oceanographic Data Centre, 1997, resolu-tion 1’) and interpolated at a space step of 1000 m. The grid was used to model the co-seismic deformation derived from the model proposed by Delouis et al. (2004), and then to compute the maximal sea elevation reached in each cell of the grid in the Western Mediterranean Sea during the first 4 hours after the earthquake (Fig. 5).
3.2 Results
3.2.1 General results
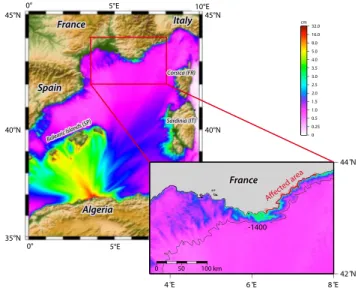
Figure 5 clearly shows that the maximal energy wave is di-rected mostly towards the Balearic Islands, as aforemen-tioned by Alasset et al. (2006). In fact, this pattern is very dependent on the fault azimuth used, but all models showed that the Balearic Islands were the most impacted. At the same time, various acceptable azimuths only changed which island was impacted the most, either Ibiza or Majorca (Alas-set et al., 2006). This kind of pattern is also noticeable for the 1856 Jijel (Algeria) earthquake and associated tsunami, which is assumed to have struck mostly Menorca and the eastern part of Mallorca (Roger and H´ebert, 2008). What-ever the case, the role that submarine canyons appear to play in wave amplification should be mentioned.
Figure 5 also reveals amplifications in several places along the Spanish, Sardinian, Corsican and South-eastern French shorelines. However, these amplifications are still less than 10 cm high on this large grid (grid 0). On the large scale, modelling clearly shows that for the French shoreline, ampli-fied values coincide well with the areas that the field investi-gation determined to be affected, e.g. the Eastern French Riv-iera. In contrast, the Western Mediterranean French shore-line (Gulf of Lion) shows less important sea level elevations.
0 0.25 0.5 1.0 1.5 2.0 2.5 3.0 3.5 4.0 5.0 8.0 16.0 32.0 cm 4 E 6 E 8 E42 N 44 N 0 50 100 km -1400 Affect ed ar ea France
France ItalyItaly
Spain Spain Algeria Algeria Balearic Islands (SP ) Balearic Islands (SP
) Sardinia (IT)Sardinia (IT)
Corsica (FR) Corsica (FR) France France 35°N 5°E 0° 5°E 0° 10°E 40°N 45°N 40°N 45°N
Fig. 5. Modelling of the maximal sea elevation reached during the first 4 h after the earthquake, based on Delouis’ source (grid 0).
Such low elevations could be mostly explained by the shield effect of the Balearic Islands, by the loss of energy of the phe-nomenon when reaching the continental margin of the Gulf of Lion, and by the wide extent of the corresponding sub-marine shallow shelf. However, more generally, in South-eastern France, the simulated amplifications (a few centime-tres of wave amplitude) are less than those witnessed during the event, but could be in agreement with the recorded signal
from the tide gages in Nice (43.695◦N, 7.285◦E). However,
the results obtained using a large scale grid of 1000 m of res-olution are not expected to account for the shoaling effect which mostly contributes to the tsunami amplification when the water depth decreases in the last few tens of meters, es-pecially along Mediterranean French coasts which are asso-ciated with steep slopes. Areas of major amplification may also match bathymetric features such as submarine canyons or particular shelf shapes that are not well mapped on the GEBCO grid.
Therefore, in order to more accurately estimate the ampli-fication associated with the shoaling effect, the model was processed on a more precise scale on the coasts, using multi-scale grids. Coastal and harbour bathymetric grids were built to gradually enhance the precision of bathymetric data from the source to the studied harbours. As mentioned previ-ously, the Figueirette and Mour´e-Rouge harbours seem to be the locations where the most important amplifications were reported in 2003. However, nothing was reported by wit-nesses for the Vieux-Port of Cannes located between these 2 harbours. Thus, these 3 harbours represent good candi-dates to more accurately study wave amplification in South-ern France during the 2003 event and to understand the ob-served differences.
The high resolution grids of the 3 studied harbours were built with data from GEBCO and from the French SHOM
1˚ 3˚ 5˚ 7˚ 9˚ −4000 m −3000 −2000 −1000 0 1000 2000 3000 4000 2000 1500 1000 500 0 −500 −1000−1500−2000 m 0 5 km B2 C1 C2 C3 −2000 m −1500 C3 A A2 A3 A4 B1 C3 C2 C1 B2 grd0 grd1 grd2 grd3 grd4 grd6 F1 F2 0 100 m F1 F2 F1 F2 grd8 E1 E2 0 500 m E1 E2 E2 E1 grd7 D2 D1 D2 D1 0 100 m D1 D2 grd5
Grid (grd) n° Space step (m.)
0 0°/10°E 35°N/45°N 1000
1 5°E/9°E 41°N/44°N 50 0
2 6.5°E/7.5°E 43 °N/43.75°N 15 0
3 6.9°E/7.1°E 43.4°N/43.6°N 40
4 6.924°E/6.955°E 43.47°N/43.49°N 13 5 (Fig ueirette) 6.9316°E/6.9366 °E 43 .481 6°N/43.485°N 3 6 7.005°E/7.05°E 43.528°N/43.552°N 13 7 (Vieux-Po rt) 7.01°E/7.0 23°E 43.5416°N/43.5516 °N 3 8 (Mouré-Ro uge) 7.04°E/7.9 45°E 4 3.54 °N/43.5 44°N 3
Boundaries
Fig. 6. Grids and sensors used to model the maximal sea elevation reached in the three studied harbours after the 21 May 2003 earthquake.
(Service Hydrographique et Oc´eanographique de la Marine) with a 3 m space step and completed using navigation maps
(Escales, 2007). Interpolation/extrapolation was used in
parts of the harbours with no available data, by using pic-tures, satellite views, etc., in order to obtain a better repre-sentation of the harbours’ geometry. Finally, a total of 9 im-bricated grids were built on 6 levels of resolution (Fig. 6).
3.2.2 Results in harbours
The modelling results (Fig. 7) show the greatest amplifica-tion inside the La Figueirette harbour, which is the small-est studied harbour (maximum wave height reaching over 22 cm).
This result is clearly less than the observations, as the observations reveal a maximum wave height reaching more than 70 cm in La Figueirette harbour. Even if the modelled propagation time was matched to the observed time of ar-rival (one hour after the earthquake, taking into account po-tential inaccuracies in witness accounts), the simulated ele-vation would still be less than the reported obserele-vation. As in previous studies on the impact of this event on the Balearic Islands (Alasset et al., 2006), the model reproduces only a fourth to a third of the recorded or observed maximal ampli-tudes. 6.9˚ 6.9˚ 7˚ 7˚ 7.1˚ 7.1˚ 43.4˚ 43.4˚ 43.5˚ 43.5˚ 43.6˚ 43.6˚ 0 2.5 5.0 7.5 10 25 100 cm 6.9˚ 6.9˚ 7˚ 7˚ 7.1˚ 7.1˚ 43.4˚ 43.4˚ 43.5˚ 43.5˚ 43.6˚ 43.6˚ 0 5 km grd 7 grd 8 grd 5 grd 7 grd 8 grd 5 0 500 m 0 100 200 m 0 100 200 m MOURE-ROUGE (grid 8) VIEUX-PORT (grid 7) FIGUEIRETTE (grid 5) MOURE-ROUGE (grid 8) VIEUX-PORT (grid 7) FIGUEIRETTE (grid 5) 0 2 4 6 8 10 12 14 16 18 20 24 28 36 cm
Fig. 7. Maximal sea level elevation during the first 4 h after the earthquake in the three studied harbours and the bay of Cannes.
Concerning the Vieux-Port, the largest studied harbour (lo-cated between the 2 harbours where the maximum ampli-tudes were observed), a very small sea level variation is ob-tained, with a maximum of about 15 cm. The Mour´e-Rouge harbour is hardly larger than La Figueirette, and seems to be much less affected. Perhaps the presence of the L´erins Is-lands to the south of the Mour´e-Rouge harbour shielded it (Fig. 7), but this has to be demonstrated further.
Globally, the detailed modelling does not allow for a re-production of the observations in terms of amplitude. It is important to mention here that the accounts given by wit-nesses four years after an event need to be considered with caution. However, these modelling results confirm that the La Figueirette harbour was the most affected site, at least in relation to the two other ones studied.
One idea proposed in this study is that additional ampli-fications, due to resonances outside or inside the considered harbours, may have also occurred. The modelling method already accounts for these phenomena, as in French Polyne-sia (e.g. H´ebert et al., 2009) where long lasting resonance periods observed were efficiently accounted for by the tide gages in Taiohae Bay. Therefore, since the seismic source seems to produce amplitudes that are too low, a frequency analysis of the signal from the source (Algerian Margin) to the French coasts is conducted. Additionally, the responses are tested in the bay and in the harbours and then discussed using synthetic modelling.
3.2.3 Frequency analysis in harbours
Numerous studies have shown that submarine features or sudden bathymetric changes could have consequences on in-cident wave amplitudes, inducing, for example, the shelf resonance (Monserrat et al, 2006; Horillo et al., 2008; Munger and Cheung, 2008). Carrier et al. (1971) showed that seismic-generated tsunamis, like atmospheric pressure disturbances, are possible causes of harbour resonance. Changes in the geometry of a harbour modify its natural pe-riod of oscillation (Monso de Prat and Escartin Garcia, 1994; Bellotti, 2007). This is an important aspect to consider in order to protect a harbour against the arrival of long waves.
In the realm of this study, the objective is to understand why, in the same area, some harbours like the La Figueirette harbour were affected in 2003, while others such as the Vieux-Port and Mour´e-Rouge harbours were not affected or were only affected a little. Therefore, the study focused on the evolution of periodic components of the tsunami during its propagation from its origin (the Algerian margin) to its arrival on the continental shelf and onwards to the coast.
The aim is to use parallel synthetic tsunami modelling in order to avoid relying on the seismic source and in order to consider only the harbours. To define the periods which need to be studied, the results of the modelling are integrated with data about the seismic source and are analysed. The atten-tion is then focused on the most precise grids (the harbours):
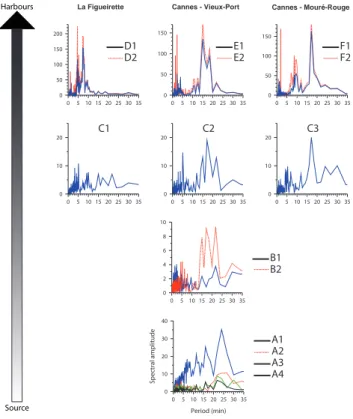
synthetic tide gages are placed over the different grids (a few are located on Fig. 6), particularly in harbours, in lo-cations which do not correspond to nodes (minimal sea level amplitude for the standing wave), i.e. near the structures of the harbours in question (breakwaters, piers, etc.), where the anti-nodes occur. This is an important aspect to take into ac-count for resonance investigations. Spectral analysis of each recorded synthetic signal is performed using FFT (Fig. 8).
On the scale of the Western Mediterranean sea, the fre-quency analysis of the signal recorded by the synthetic sen-sors from the Algerian shore to the French coasts reveals the appearance and disappearance of main periods. Except for a global diminution of the main amplitude during the propaga-tion from A1 to A2 (loss of energy due to depth and geomet-rical spreading), the sensors recorded a decrease in the low frequency peak (20–25 min) as time passes from sensor A1 to sensor A4. A second peak (16–17 min) remains during the entire propagation process. These two peaks can be linked to the geometry of the rupture. Nothing particular about the high frequencies (less than 10 min) can be deduced.
Similarly, given that every water body (including man-made harbours or bays) has natural oscillation modes with eigenperiods that depend on its physical characteristics (Jansa et al., 2007), i.e. its geometry and depth (Monso de Prat and Escartin Garcia, 1994; Woo et al, 2004), a spec-tral analysis in the different grids was conducted, especially on the 3 harbours’ grids, using a method inspired by Yal-ciner and Pelinovsky (2006) which these authors used in the Marmara Sea. This methodology consists in comparing the evolution of a signal modelled with the available information about its source all along its path to the evolution of a well known synthetic signal along the same path. Through mod-elling, the synthetic signal is altered by the environment of the basin. By comparing these two signals, this methodol-ogy enables one to highlight the main frequencies (peaks) of each grid: if a peak is invisible on the synthetic signal anal-ysis but visible on the source based signal analanal-ysis, it can be deduced that this peak is attributable to the source. It is to be noted that unlike in the case of the Marmara Sea, the stud-ied basin is open. Several tests on open basins which reso-nance periods were known have been conducted in the bay of Sainte-Anne (Guadeloupe, eastern Caribbean Sea) and vali-dated this methodology for such basins (Roger et al., 2009). Following this methodology, a FFT algorithm is used to anal-yse the evolution of an arbitrary initial surface with virtual gage points (Fig. 9). In this case, the known synthetic signal is a Gaussian.
A manual correlation between the main frequency peaks of the different spectra is conducted. The main period peak (low frequencies), which corresponds to a very large and also dissipative period (the more the harbour is open, the more it is large; the resonance is not well auto-maintained), can be explained by the non-closed structure of the harbour (con-firmed by additional calculations not presented here in this study).
0 10 20 30 40 Spectral amplitude 0 5 10 15 20 25 30 35 Period (min) A1 A2 A3 A4 0 2 4 6 8 10 0 5 10 15 20 25 30 35 B1 B2 0 10 20 0 5 10 15 20 25 30 35 C1 0 10 20 0 5 10 15 20 25 30 35 C2 0 10 20 0 5 10 15 20 25 30 35 C3 0 50 100 150 0 5 10 15 20 25 30 35 E1 E2 0 50 100 150 200 0 5 10 15 20 25 30 35 D1 D2 0 50 100 150 0 5 10 15 20 25 30 35 F1 F2
La Figueirette Cannes - Vieux-Port Cannes - Mouré-Rouge
Harbours
Source
Fig. 8. Signal evolution from the source (Delouis et al., 2004) to the harbours in the Gulf of La Napoule (A1 to F2 are the sensors located on Fig. 6).
The comparison of the signals recorded by five synthetic sensors located in the La Napoule Bay (B1, B2, C1, C2 and C3, Fig. 8) shows that the previously described 16–17 min peak is still present and even amplified offshore from the Vieux-Port and the Mour´e-Rouge harbours (respectively C2 and C3). As this peak is not on the signal spectrum for the area where the Gaussian is applied (Fig. 9), the peak is conse-quently linked to the source, and not to a local resonance phe-nomenon. The amplification of this peak is limited offshore from the La Figueirette’s harbour (C1), probably due to the presence of a submarine canyon (Fig. 6, grd3) which dimin-ishes the spectral amplitudes (important dissipation). Simi-larly, a 7–8 min peak appears in front of the La Figueirette harbour (Fig. 8) which is not reproduced by the synthetic sig-nal (Fig. 9). Can this peak be linked to the source? All the other peaks present in Fig. 8 are in phase with the calculated synthetic signals (Fig. 9).
Regarding the signal in the La Figueirette harbour, the D1 and D2 synthetic signal graphs (Fig. 9) show that the 16– 17 min peak is still present on Fig. 8, but its amplitude is clearly diminished. The signals recorded from the applica-tion of the Gaussian (Fig. 9) indicate that the 5 min peak could be generated by a resonance effect caused by the en-trance of the harbour since it disappears when the harbour is closed. The 1 min peak is also attributable to the harbour’s
B1 B2 C1 C2 C3 E1 E2 D1 D2 F1 F2 Spectral amplitude Period (min)
La Figueirette Cannes - Vieux-Port Cannes - Mouré-Rouge
Harbours 0 20 40 60 80 100 120 0 5 10 15 20 0 50 100 150 200 0 5 10 15 20 0 50 100 150 200 0 5 10 15 20 0 50 100 150 200 0 5 10 15 20 0 100 200 300 400 0 5 10 15 20 0 1000 2000 0 5 10 15 20 0 50 100 0 5 10 15 20
Fig. 9. Responses of the virtual sensors to a synthetic signal.
entrance, while the 7–8 min peak (which is the same on D1 and D2, Fig. 8) could correspond to a resonance outside the harbour.
In comparison to the signal in the Vieux-Port harbour, the 16–17 min peak is visible at the arrival of the signal in the harbour (Fig. 8) and could be attributed to the source as it is not reproduced by the synthetic signal (Fig. 9). No peak is attributable to the harbour’s entrance. On the other hand, the 1 min peak is still visible, associated with the 2 and 4 min peaks (Fig. 8). These three peaks are amplified from the en-trance (E1) to the far end of the harbour (E2). The 2 and 4 min peaks are not attributable to the Gaussian signal and are therefore probably due to a local interference (resonance before the harbour’s entrance).
In the Mour´e-Rouge harbour, the peaks which are due to the resonance of the harbour (less than 2 min) are well re-produced by the Gaussian and are amplified from F1 to F2. The peak associated with the entrance of the harbour (around 6 min) is still visible, but partially masked by a larger peak of a 10 min period which is not reproduced by the synthetic signal. This peak could be generated by the semi-enclosed water body between the L´erins Islands and the continental shore.
3.3 Discussion about the modelling
The amplifications observed by the witnesses are neither re-produced by a realistic earthquake source (Delouis et al., 2004), nor by any source available (Yelles et al., 2004; Meghraoui et al., 2004). Consequently, the study attempted to determine the characteristics which would have produced the actual observations. The detailed frequency analysis al-lows one to distinguish the imputable spectral component of
the source from the spectral characteristics due to harbour structures. The additional synthetic analysis using a Gaus-sian signal indicates which type of signal is able to stimulate the harbours or bays in question, leading to important wave amplifications. As in the Balearic Islands where the mod-elled amplitudes also fit poorly to the actual observations, this issue remains unexplained. Numerical dispersion ex-ists in the modelling method, but results obtained in French Polynesia with much longer propagation paths never suffered from this poor fit when using realistic seismic sources.
When comparing the spectrums obtained with the signal coming from the seismic source to the spectrums obtained with the signal coming from the synthetic Gaussian signal, one can clearly see that some of the peaks present on the sec-ond spectrum (synthetic) do not appear on the first one (seis-mic source signal). This indicates that the modelled source does not stimulate all the proper modes (fundamental and/or harmonics) of the harbours. The eigenperiod of the source’s signal is probably not correct, whether or not what was ob-served in the La Figueirette and Mour´e-Rouge harbours is actually a resonance phenomenon.
The lack of physical dispersion in the propagation model could be a primary reason for the mismatch between the models and the observations, after taking into consideration the validity of eyewitness reports, as previously mentioned. Indeed, for such a moderate event, shorter tsunami wave-lengths could have also been generated. A more rigorous model should take into account the dispersion of wavetrains (Boussinesq model). In addition, the very late observations reported in the harbours could be in agreement with late ar-rivals of dispersed wavetrains, characterized by shorter peri-ods, which could have caused the La Figueirette’s harbour to resonate. Another reason, not completely independent from the former, stands that some places along the coast could be receptive to some waves arriving from Algeria that ex-hibit resonance phenomena, as it was shown by Roger and H´ebert (2008) in the Balearic Islands for the 1856 event. Once again, late and dispersed wavetrains could induce reso-nances at specific arrival times. A proper physical dispersion would allow shorter wavelengths to get amplified, stimulat-ing short eigenperiods in some harbours. However, usstimulat-ing a Boussinesq model would also diminish the final amplitudes, yet, it would not be required for this study as the earthquake source seems to be too low with respect to tsunami observed amplitudes.
Another weakness in the modelling could be the lack of data concerning the exact bathymetry of the harbours. Bathy-metric data is not currently dense enough on the coasts (shal-low water) and practically non-existent in harbours. However the data from SHOM are well resolved close to the shores, except in the harbours where the constructed grids may be not precise enough, as previously mentioned (see Sect. 3.2). However, an error of 15% on the mean water depth should not shift the main spectral values by more than 10%.
Nevertheless, the models presented in this study have helped determine the resonance periods in the studied sites, and these periods appear to be important parameters for sea level variation amplifications. By integrating data from wit-nessed observations into the model, the identification of the signal’s periodic components in proximity to the harbours, and even at the tsunami’s source, is possible. This approach displays the relationship between the resonance period (or the harmonics) of a basin – such as a harbour – and its expo-sure to wave amplification (Bellotti, 2007).
Harbour resonance is probably not the only parameter which has an influence on the harbours’ response to the sig-nal. A statistical study comparing the harbours’ entrance ori-entation, geometry, etc. to the witnessed impacts could bring forward other explanations.
4 Conclusions
Four years after the tsunami triggered by the 21 May 2003 Boumerd`es-Zemmouri (Algeria) earthquake, a long and careful survey was conducted along the French
Mediter-ranean coast. The maritime authorities and 135 harbours
were contacted and interviewed about the observations they noticed in the hours following the earthquake.
Assessing the impacts of such a relatively small tsunami was quite challenging, as it had not been identified as a tsunami by the harbour authorities, and therefore no official national report was made concerning its impact. The con-ducted survey enlightened and summarized the effects of the 2003 Mediterranean Sea tsunami on the French coasts, which had not previously been studied. The results of this study showed that the effects of the tsunami was underestimated by the French tide gage records, as it had consequent effects in many French harbours.
Compared to the field observations, the various modelling approaches showed an underestimation of about a fourth to a third of the actual effects of the 21 May 2003 tsunami. Such a gap could be linked to an underestimation of the initial deformation amplitude at the source. The role of the reso-nance phenomenon has been underlined as an important fac-tor of wave amplification in bays and harbours. This phe-nomenon needs to be refined in a detailed tsunami modelling, especially for small magnitude events. Knowing the period of resonance for each harbour allows one to deduce which wave frequency falls into resonance inside that particular wa-ter body, and thus helps one to more accurately predict and prevent the effects of the hazard for specific tsunami wave-lengths. A more detailed analysis of a harbour’s resonance would nevertheless be improved using continuous tide gage data whose spectral analysis provides the main eigenperiods of the basins (Monserrat et al., 1998).
Finally, the Western Mediterranean shores are not the most exposed to the tsunami hazard. The hazard level is quite low, with low recurrence and low intensities. However, the shores
are very vulnerable, as they are highly urbanized and pop-ulated, especially during summer. The 2003 phenomenon would have caused more damage due to the 15-knot currents (7 m/s) that were observed if it had occurred in the middle of the day when traffic is increased in harbours.
This study underlines the need for post-tsunami surveys to be organized as soon as a tsunami occurs, covering all the potentially affected shores. It would be interesting to or-ganize such surveys for the 2003 event in all the Western Mediterranean basin, and more particularly in Spain, Alge-ria, Tunisia and Italy, where modelling shows an important amplification of the sea level elevation along these shores.
Acknowledgements. The authors would like to thank the CEA
(French atomic energy commission) who financed the field
inves-tigation along the French shore. The work was funded within
the FP6 European project TRANSFER under contract 037058 and within the RiskNat program under contract ANR-08-RISKNAT-005-01/MAREMOTI. The paper benefited from constructive re-views by Alexander B. Rabinovich and an anonymous referee. The authors would also like to thank all the administrations who provided them with the records of the tide gages:
J. P. Alasset, from the “Institut de Physique du Globe de Stras-bourg”, who collected several records of the Italian tide gages through the “Istituto Superiore per la Protezione e la Ricerca Am-bientale” (ISPRA).
The Italian ISPRA, and more specifically the technical services pro-vided by S. Corsini, for the tide gage in Genova.
The French “Service Hydrologique de la Marine Nationale” (SHOM), and more specifically R. Jehan who provided the records of the tide gage in Nice (France); R. Creach and P. Bonnefond from the SHOM’s RONIM project for the other French tide gages. The French “Service de Navigation Maritime Languedoc Roussil-lon” (SNMLR), who provided the records of the tide gage in S`ete. The Spanish “Instituto Espa˜nol de Oceanograf´ıa de Madrid” (IEO, Spanish Oceanographic Institute), and more specifically M. J. Gar-cia who provided the records of the tide gage in Palma de Mallorca. The Spanish “IGN Madrid”, and the “Puertos del Estado Madrid” administrations, for the records of the other Spanish gages. The CROSS, for searching their database for interventions during the evening of 21 and the night of 21–22 May.
All the harbours’ staff which participated in, or facilitated, the field investigation.
All of the witnesses who accepted to share their experience of the 2003 Boumerd`es-Zemmouri tsunami with us.
Finally, Christa Teplicky who kindly corrected this article.
Edited by: S. Tinti
Reviewed by: A. Rabinovich and another anonymous referee
References
Alasset, P.-J., H´ebert, H., Maouche, S., Calbini, V., and Meghraoui, M.: The tsunami induced by the 2003 Zemmouri earthquake (Mw=6.9, Algeria): modelling and results, Geophys. J. Int., 166, 213–226, 2006.
Assier-Rzadkieaicz, S., Heinrich, P., Sabatier, P. C., Savoye, B., and Bourillet, J. F.: Numerical Modelling of a Landslide-generated Tsunami: The 1979 Nice Event, Pure Appl. Geophys., 157(10), 1707–1727, 2000.
Bellotti, G.: Transient response of harbours to long waves under resonance conditions, Coast. Eng., 54, 680–693, 2007.
Carrier, G. F., Shaw, R. P., and Miyata, M.: The response of nar-row mouthed harbours in a straight coastline to periodic incident waves, J. Appl. Mech., 38E-2, 335–344, 1971.
Delouis, B., Vallee, M., Meghraoui, M., Calais, E., Maouche, S., Lammali, K., Mahsas, A., Briole, P., Benhamouda, F.,
and Yelles, K.: Slip distribution of the 2003
Boumerd`es-Zemmouri earthquake, Algeria, from teleseismic, GPS, and
coastal uplift data, Geophys. Res. Lett., 31, L18607,
doi:10.1029/2004GL020687, 2004.
Eva, C. and Rabinovich, A. B.: The February 23, 1887 tsunami recorded on the Ligurian coast, western Mediterranean, Geo-phys. Res. Lett., 24(4), 2211–2214, 1997.
Escales: Guide de Bord, edited by: “Editions de Chabassol”, Bussy-St-Georges, France, 592 pp., 2007.
Gerardi, F., Barbano, M. S., De Martini, P. M., and Pantosti, D.: Discrimination of Tsunami Sources (Earthquake versus Land-slide) on the Basis of Historical Data in Eastern Sicily and South-ern Calabria, B. Seismol. Soc. Am., 98(6), 2795–2805, 2008. Gutscher, M. A., Roger, J., Baptista, M.-A., Miranda, J. M., and
Tinti, S.: Source of the 1693 Catania earthquake and tsunami (southern Italy): New evidence from tsunami modelling of a locked subduction fault plane, Geophys. Res. Lett., 33, L08309, doi:10.1029/2005GL025442, 2006.
H´ebert, H., Schindel´e, F., Altinok, Y., Alpar, B., and Gazioglu, C.: Tsunami hazard in the Marmara Sea (Turkey): a numeri-cal approach to discuss active faulting and impact on the Istanbul coastal areas, Mar. Geol., 215, 23–43, 2005.
H´ebert, H., Reymond, D.,, Krien, Y., Vergoz, J., Schindel´e, F., Roger J., and Loevenbruck , A.: The 15 August 2007 Peru earth-quake and tsunami: influence of the source characteristics on the tsunami heights, Pure Appl. Geophys., 166, 1–22, 2009. Jansa, A., Monserrat, S., and Gomis, D.: The rissaga of June 2006
in Ciutadella (Menorca), a meteorological tsunami, Adv. Geosci., 12, 1–4, 2007, http://www.adv-geosci.net/12/1/2007/.
Maramai, A., Graziani, L., and Tinti, S.: Tsunamis in the Aeolian Islands (southern Italy): a review, Mar. Geol., 215(1–2), 11–21, 2005.
Meghraoui, M., Maouche, S., Chemaa, B., Cakir, Z., Aoudia, A., Harbi, A., Alasset, J.-P., Ayadi, A., Bouhadad, Y., and Ben-hamoud, F.: Coastal uplift and thrust faulting associated with the Mw=6.8 Zemmouri (Algeria) earthquake of 21 May, Geophys. Res. Lett., 31, L19605, doi:10.1029/2004GL020466, 2003. Monserrat, S., Rabinovich, A. B., and Casas, B.: On the
Recon-struction of the Transfer Function for Atmospherically Generated Seiches, Geophys. Res. Lett., 25(12), 2197–2200, 1998. Monserrat, S., Vilibi´c, I., and Rabinovich, A. B.: Meteotsunamis:
atmospherically induced destructive ocean waves in the tsunami frequency band, Nat. Hazards Earth Syst. Sci., 6, 1035–1051,
2006, http://www.nat-hazards-earth-syst-sci.net/6/1035/2006/. Monso de Prat, J. L. and Escartin Garcia, F. J.: Long wave
reso-nance effects produced by changes in the layout of the port of Ciutadella (Menorca, Spain), Bulletin of the Permanent Interna-tional Association of Navigation Congresses, 83/84, 209–216, 1994.
Munger, S. and Cheung, K. F.: Resonance in Hawaii waters from the 2006 Kuril Islands tsunami, Geophys. Res. Lett., 35, L07605, doi:10.1029/2007GL032843, 2008.
Roger, J. and H´ebert, H.: The 1856 Djijelli (Algeria) earthquake and tsunami: source parameters and implications for tsunami hazard in the Balearic Islands, Nat. Hazards Earth Syst. Sci., 8, 721– 731, 2008,
http://www.nat-hazards-earth-syst-sci.net/8/721/2008/.
Roger, J., Allgeyer, S., H´ebert, H., Baptista, M. A., Loevenbruck, A., and Schindel´e, F.: The 1755 Lisbon tsunami in Guadeloupe Archipelago: contribution of numerical modelling, The Open Oceanography Journal, accepted, 2009.
Semmane, F., Campillo, M., and Cotton, F.: Fault location and source process of the 2003 Boumerd`es, Algeria, earthquake in-ferred from geodetic and strong motion data, Geophys. Res. Lett., 32, L01305 1–4, 2005.
Sladen, A., H´ebert, H., Schindel´e, F., and Reymond, D.: Evaluation of far-field tsunami hazard in French Polynesia based on histori-cal data and numerihistori-cal simulations, Nat. Hazards Earth Syst. Sci., 7, 195–206, 2007,
http://www.nat-hazards-earth-syst-sci.net/7/195/2007/.
Sladen, A. and H´ebert, H.: On the use of satellite altimetry to infer the earthquake rupture characteristics: application to the 2004 Sumatra event, Geophys. J. Int., 172, 707–714, 2008.
Soloviev, S., Solovieva, O. N., Go, C. N., Kim, K. S., and Shchet-nikov, N. A.: Tsunamis in the Mediterranean Sea 2000 B.C. – 2000 A.D. Advances in Natural and Technological Hazards Re-search, Kluwer Academic Publishers, 237 pp., 2000.
Tinti, S., Maramai, A., and Graziani, L.: The new catalogue of the Italian tsunamis, Nat. Hazards, 33, 439–465, 2004.
Woo, S.-B., Hong, S.-Y., and Han, K.-N.: Numerical study of nonlinear resonance in narrow bay, OCEANS ’04, MTTS/IEEE TECHNO-OCEAN ’04, 3, 1512–1518, ISBN: 0-7803-8669-8, 2004.
Yalciner, A. C. and Pelinovsky, E. N.: A short cut numerical method for determination of periods of free oscillations for basins with irregular geometry and bathymetry, Ocean. Eng., 34(5–6), 747– 757, 2007.
Yelles, K., Lammali, K., and Mahsas, A.: Coseismic deformation of the May 21st, 2003, Mw=6.8 Boumerdes earthquake, Alge-ria, from GPS measurements, Geophys. Res. Lett., 31, L13610, doi:10.1029/2004GL019884, 2004.