HAL Id: hal-02149100
https://hal.archives-ouvertes.fr/hal-02149100
Submitted on 30 Aug 2019
HAL is a multi-disciplinary open access
archive for the deposit and dissemination of
sci-entific research documents, whether they are
pub-lished or not. The documents may come from
teaching and research institutions in France or
abroad, or from public or private research centers.
L’archive ouverte pluridisciplinaire HAL, est
destinée au dépôt et à la diffusion de documents
scientifiques de niveau recherche, publiés ou non,
émanant des établissements d’enseignement et de
recherche français ou étrangers, des laboratoires
publics ou privés.
Detection of Simulated Brain Strokes Using Microwave
Tomography
Vanna Lisa Coli, Pierre-Henri Tournier, Victorita Dolean-Maini, Ibtissam El
Kanfoud, Christian Pichot, Claire Migliaccio, Laure Blanc-Féraud
To cite this version:
Vanna Lisa Coli, Pierre-Henri Tournier, Victorita Dolean-Maini, Ibtissam El Kanfoud, Christian
Pichot, et al.. Detection of Simulated Brain Strokes Using Microwave Tomography. IEEE
Jour-nal of Electromagnetics, RF and Microwaves in Medicine and Biology, IEEE, 2019, 1, pp.1.
�10.1109/JERM.2019.2921076�. �hal-02149100�
Detection of synthetic cerebrovascular accidents by means of microwave tomography and image processing
(CLSR stands for Carbon Loaded Silicon Rubber, image courtesy of EMTensor GmbH).
Take-Home Messages
• Brain strokes are one of the leading causes of disability and mortality in adults in developed countries.
We
investigate how microwave tomography reveals changes in the brain’ tissues and thereby enable to detect and
identify the type of stroke
.
• We demonstrate that hemorrhagic stroke can be automatically identified with microwave tomography.
• Because of portability and cost effectiveness, microwave imaging systems may significantly improve the
medical care of cerebrovascular accidents.
• Stroke identification including images reconstruction and automatic detection lasts less than 5 minutes.
• We implement massive parallel computing to solve the electromagnetic inverse problem and to speed up the
reconstruction process.
Detection of Simulated Brain Strokes
Using Microwave Tomography
Vanna Lisa Coli, Pierre-Henri Tournier, Victorita Dolean, Ibtissam El Kanfoud, Christian Pichot, Fellow, IEEE,
Claire Migliaccio, and Laure Blanc-Féraud
Visual Summary
Max 4 inch x 6 inch
IEEE JOURNAL OF ELECTROMAGNETICS, RF AND MICROWAVES IN MEDICINE AND BIOLOGY 1
Detection of Simulated Brain Strokes
Using Microwave Tomography
Vanna Lisa Coli, Pierre-Henri Tournier, Victorita Dolean, Ibtissam El Kanfoud, Christian Pichot, Fellow, IEEE,
Claire Migliaccio, and Laure Blanc-F´eraud
Abstract—Brain strokes are one of the leading causes of disability and mortality in adults in developed countries. The ischemic stroke (85% of total cases) and hemorrhagic stroke (15%) must be treated with opposing therapies, thus the nature of the stroke must be determined quickly in order to apply the appropriate treatment. Recent studies in biomedical imaging have shown that strokes produce variations in the complex electric permittivity of brain tissues, which can be detected by means of microwave tomography. Here we present some synthetic results obtained with an experimental microwave tomography-based portable system for the early detection and monitoring of brain strokes. The determination of electric permittivity first requires the solution of a coupled forward-inverse problem. We make use of massive parallel computation from domain decomposition method and regularization techniques for optimization methods. Synthetic data are obtained with electromagnetic simulations corrupted by noise, which have been derived from measurements errors of the experimental imaging system. Results demonstrate the possibility to detect hemorrhagic strokes with microwave systems when applying the proposed reconstruction algorithm with edge preserving regularization.
I. INTRODUCTION
C
EREBROVASCULAR accidents (CVAs) are one of the leading causes of physical disability and mortality in adults in developed countries. There are two types of CVAs (or strokes): ischemic or cerebral infarction (85% of cases) and hemorrhagic (15%). Ischemic stroke is due to a clot that blocks the blood circulation. An intravenous tissue plasmino-gen activator (tPA) must be administered within 3 hours of stroke onset. In contrast, hemorrhagic stroke is caused by rupture of a blood vessel,and thus the correct diagnosis is critical in order to select the appropriate treatment. Currently, the nature of stroke can only be discriminated by MRI or CT imaging [1]. However, these bulky and expensive systems require too much infrastructure to be practiced outside the hospital. This highlights the potential value of a system that could be used in an ambulance, for example. In addition, during the follow-up phase of the treatment, medical imaging examinations need to be repeated at regular intervals. Con-ventional imaging approaches such as MRI and CT require the patient to be regularly moved during follow-up treatment, whereas microwave systems could allow for in situ patient monitoring.Recent studies have developed a microwave imaging sys-tem with 24 antennas [2] for testing an algorithm based on Truncated Singular Value Decomposition scheme [3], and a previous study on 2D phantoms used the linear sampling
This paper is expanded from a presentation at the 2018 IEEE International Symposium on Antennas and Propagation and USNC–URSI Radio Science Meeting held in Boston, MA, USA.
Vanna Lisa Coli is with Universit´e Cˆote d’Azur, CNRS, CEPAM, Nice, France (e-mail: [email protected])
Pierre-Henri Tournier is with Universit´e Sorbonne, CNRS, LJLL, INRIA, Paris, France (e-mail: [email protected])
Victorita Dolean is with Universit´e Cˆote d’Azur, CNRS, LJAD, Nice, France (e-mail: [email protected])
Ibtissam El Kanfoud, Christian Pichot and Claire Migliaccio are with Universit´e Cˆote d’Azur, CNRS, LEAT, Sophia Antipolis, France (e-mail: [email protected], [email protected], [email protected])
Laure Blanc-F´eraud is with Universit´e Cˆote d’Azur, CNRS, INRIA, I3S, Sophia Antipolis, France (e-mail: laure.blanc [email protected])
method [4] for brain stroke monitoring. A conjugate-gradient-based regularization technique in Lp Banach spaces, in
con-junction with an inexact-Newton solving scheme, has also been developed recently [5], and the employment of portable microwave-based devices for pre-hospital use is discussed in [6]. Recent works have shown the dependence of complex permittivity on the nature of stroke (ischemic or hemorrhagic) in the microwave frequency range. Indeed, complex dielectric permittivity increases up to 20% in the hemorrhagic stroke area [7], while ischemic stroke corresponds to a decrease of 10% [7], [8]. Hemorrhagic stroke occurs when a blood vessel bursts, which causes an excess of blood in the stroke area. Since the blood has among the highest permittivities in the brain, it causes a local increase. On the contrary, when a clot blocks a vessel, the blood that previously flew through the vessel, cannot reach this area anymore and the local permittivity de-creases. These findings suggest that microwave imaging tech-niques could offer a promising method of stroke classification due to their inherent contrast mechanism, low cost, and quick acquisition time. The company EMTensor GmbH (Vienna, Austria) has developed a portable microwave scanner for the detection and monitoring of strokes [9], which is embeddable in ambulances and has been extensively investigated in [10]. Authors of [11] proposed a frequency-based method and tested it experimentally on a simplified brain phantom. Due to strong variations of the head complex permittivity over frequency, we elected to work at a single frequency, and to test our reconstruction algorithm with synthetic data obtained from a realistic brain model1 (CT and MRI images) corrupted with
noise.
Stroke detection by microwave tomography with the EMTensor GmbH scanner was previously analyzed in [10]. The aim of this paper is to further investigate this topic, in particular:
• the choice of regularization term in the inverse problem; • the sensitivity of the results to the position of the stroke;
COMPARISON WITH LITERATURE
Ref. Type of reconstruction Data/phantom Number of tissues Stroke Stroke model Automatic detection
[2] Stroke location Simulated 7 Hemorrhagic Homogeneous (blood) No
[5] Quantitative permittivityQuantitative permittivity SimulatedMeasured 82 HemorrhagicHemorrhagic Homogeneous (glycerin)Homogeneous (blood) NoNo
[6] Stroke detection Patients Not applicable Hemorrhagic and ischemic Not applicable Yes
[7] Quantitative permittivity Simulated 10 Hemorrhagic and ischemic Inhomogeneous -10%/+20% No
[11] Stroke location Measured 6 Hemorrhagic Homogeneous (blood) No
This paper Quantitative permittivity Simulated 10 Hemorrhagic and ischemic Inhomogeneous -10%/+10% Yes
• a data processing method for automatic hemorrhagic
stroke detection.
To the best of our knowledge, this paper is the sole example of automatic detection of strokes based on microwave tomog-raphy making use of a complex phantom (including blood and blood vessels) and an inhomogeneous model of a small local perturbation of the complex permittivity for the stroke (see Table I for literature comparison). Finally, this process takes place under very high noise assumptions (0 dB).
The paper is organized as follows: the investigation protocol and the regularized reconstruction algorithm are outlined in Section II, while Section III deals with the numerical testing and data processing that we carried out for the detection and discrimination of hemorrhagic and ischemic CVAs.
II. EXPERIMENTAL FRAMEWORK
We refer the reader to [10] for a detailed description of the imaging system and the forward problem modeling. Here we build on this foundation, and present the inverse problem formulation and the regularization, however we must remind the reader that we have simulated the whole imaging system (including antennas and measurement chamber).
A. Problem formulation
The 3D reconstruction of the permittivity value map inside the imaging chamber involves two main parts, a forward problem and an inverse problem. The solution of the forward problem provides the scattering parameters of the system in presence of the virtual brain. The inverse problem is modeled as an optimization problem involving a fit-to-data term and a regularizing term, as follows:
min 2⌦J() = 1 2 N X j=1 N X i=1 Sij() Sem ij Smeas ij Sijmeas,em 2 + ↵R(), (1) where:
• R() =R⌦p|r|2+ is a smooth Total Variation (TV)
functional [12];
• N = 160 is the number of antennas of the measurement
system;
• > 0 is the TV smoothing parameter which ensures
differentiability ( = 10 7in the experiments);
• ⌦is the 3D domain corresponding to the imaging
cham-ber;
• = k20✏r is the unknown complex parameter of the
inverse problem;
• ✏ris the complex permittivity to be reconstructed;
• k0 is the vacuum wavenumber;
• Sij() are the scattering coefficients computed for the
wavenumber ;
• Sijmeas are the scattering coefficients for the the head
measurements;
• Sijem (respectively S meas,em
ij ) are the computed
(respec-tively measured) scattering coefficients for the empty chamber;
• ↵ > 0 is the regularization parameter, heuristically
chosen to sufficiently reduce noise and obtain suitable images (↵ = 10 2 in the experiments).
Problem (1) is a nonlinear ill-posed problem with approxi-mately a million of unknowns, whose solution is found by means of the iterative L–BFGS method [13], which provides both fast convergence and good quality results, but avoids the storage of matrices for large scale optimization problems [14]. Real data was not available for our current investigation because measurements on volunteers are restricted in terms of legal agreements and medical infrastructure. Therefore, we use simulated data as input data (Smeas
ij ) for the reconstruction
process. In order to model the S-parameters of a real brain, we performed electromagnetic simulations of a synthetic virtual brain and we corrupted the results with a multiplicative error model [15], [16], derived from measurements of the empty chamber. The full model Snoise
ij includes a calibration error
and noise model caused by electronics from the vector network analyzer driving the system and electronic switches:
Snoiseij =E calib,noise ij S meas ij , (2) where Ecalib,noise
ij is described by a set of six coefficients tuned
upon measurements of the real system and Smeas
ij is the result
of the simulation of the forward problem. Finally, Ecalib,noise ij
can be expressed in a short form as:
Eijcalib,noise= (1 + p(GReij + iGImij )). (3)
The coefficient p depends on the six coefficients and GRe ij and
GIm
ij are given for each pair of transmitting/receiving antennas
(i, j); they follow a normal distribution. The signal-to-noise ratio (SNR) for the experiments is close to 0 dB, which is, to the best of our knowledge, the most constraining value applied in the frame of synthetic reconstructions of the brain.
The reconstruction problem is highly complex due to the huge size of the data and high level of heterogeneity in brain tissues. Therefore, regularization techniques need to be investigated.
IEEE JOURNAL OF ELECTROMAGNETICS, RF AND MICROWAVES IN MEDICINE AND BIOLOGY 3
(a)Relative error, ischemic (b)Relative error, hemorrhagic (c)Objective functions
Fig. 1. Comparative analysis for regularization methods: from left to right, relative errors for ischemic and hemorrhagic cases, objective functions.
B. Regularization
With respect to previous investigations on the topic [10] where the Tikhonov functional [17] was employed in the reconstructions, in this paper we propose a different functional as a regularizing term in the objective function J() of problem (1): the smooth TV functional is exploited here with the aim of reducing noise while preserving edges be-tween zones with different permittivity values. TV functionals produce anisotropic smoothing during signal reconstruction, which allows one to prevent from noise amplification and, at the same time, to reconstruct the edges between changes of values. As the strokes correspond to areas with greater or smaller values of the permittivity, TV regularization will better reconstruct these areas compared to Tikhonov regularization. First, we want to stress the requirement of regularization methods for the solution of problem (1). In order to evaluate the solution of problem (1) with and without regularization, in Fig. 1a and Fig. 1b, we show the values of the relative error errRel(n)for the real part of an ischemic and a
hem-orrhagic stroke respectively, where errRel(n) is defined as
errRel(n) :=||<(n) <(exact)||2/||<(exact)||2, and n
is the solution of problem (1) at the n-th iteration and exact
is the ground truth of the synthetic head model. The green line shows the evolution of errRel(n)without regularization (i.e.,
↵ = 0in (1)), while red and blue lines correspond to the choice of R() as a smooth TV regularizer or a Tikhonov regularizer (R() = 1
2
R
⌦|r|2), respectively: when no regularization
is employed, the well-known semi-convergence phenomenon appears, resulting in a solution dominated by noise. Second, the comparison of the TV performances with the Tikhonov functional previously employed in the experiments of [10] does not show remarkable improvements when considering the relative error of the solutions with respect to the ground truth (see Fig. 1a and Fig. 1b). Similar behavior for the relative error evolution is observed when considering the imaginary part of the solution. Although the final values are similar, the error is slightly lower when TV is employed. Third, the objective functions J() for problem (1) are shown in Fig. 1c as follows: continuous lines show the evolution of the functional for the considered ischemic stroke, dashed-dotted lines for the hemorrhagic stroke, and the color scale is the same as in Fig. 1a and Fig. 1b, i.e., green color corresponds to no regularization, red to the smooth TV regularization and blue
to the Tikhonov regularizer. The objective function in Fig. 1c reaches the lowest values when no regularization is employed, nevertheless the solution is not reliable because it includes the noise (see. Fig. 1a and Fig. 1b for the error evaluation); when regularization (Tikhonov or TV) is applied, the function J() ends up at lower values when the TV functional is employed, so the latter is selected for all further experiments.
III. NUMERICAL EXPERIMENTS
The model of a synthetic brain obtained from CT and MRI data, which consists of a complex permittivity map of 362⇥434⇥362 data points with a spatial resolution of 0.5 mm, is used as a ground truth for the experiments. The operating frequency of the system is f = 1 GHz. The experimentation codes for forward and inverse problems were implemented us-ing the program FreeFEM++, an open source tool developed at the Universit´e Pierre and Marie Curie, France [18] devised for High Performance Computing (HPC). Simulations have been performed on the Tier-0 Italian supercomputer MARCONI (CINECA, Bologna). Thanks to HPC, the total computation time to obtain the permittivity value map is less than five minutes. The post-processing of the results was performed using MatLab and takes a few seconds.
A. Reconstructed images
We adopt elliptical-shaped stokes in order to simulate a slightly anisotropic blood diffusion. The ischemic CVAs were simulated by subtracting 10% of the local permittivity in an ellipsoidal region (or conversely, 10% was added for hemorrhagic CVAs) according to observations from [7], [8]. Dielectric permittivity profiles were reconstructed separately on real and imaginary parts. The reconstruction results are shown on the central cross-section of the head. The intensity of each pixel (xl, yl) corresponds to the real and imaginary
part of ✏r. Moreover, in the considered plane, the cross-section
of the stroke has an elliptical shape, described by the following equations:
(
x = 38 cos(t) + x0
y = 23 sin(t) + y0 t2 [0, 2⇡].
(4) We perform several experiments simulating strokes in three different positions defined by (x0, y0) and selected according
Stroke A, Stroke B and Stroke C, corresponding to ellipsoidal regions centered in (x0, y0) = (0,0), (48.3,0) and (14.3, -57.6),
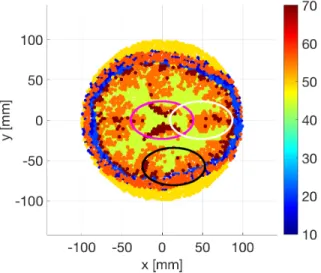
respectively. The borders of the strokes are highlighted on Fig. 2, but the values of ✏r in the figure are those of the
healthy brain. Note that Fig. 2 only shows the region inside the skull, whereas the reconstruction is performed across the entire cross-section of the imaging system; details on the automatic definition of this region will be given in Section III-B. Figure
Fig. 2. Real part of the complex permittivity ✏r of the brain (cross-section)
according to the model derived from MRI and CT-scan, including the three stroke locations (stroke A, stroke B and stroke C in magenta, white and black curves respectively).
3 shows the results for stroke B in the same cross-sectional plane as in Fig. 2 for the real part of ✏r: the reconstructions
of the brain with an ischemic CVA, the healthy brain and the brain with hemorrhagic CVA are displayed from left to right. We highlight three issues: 1. The reconstructed values of the real part of ✏r in Fig. 3 have a narrower range (26 to
63) with respect to Fig. 2. These differences in the range of values can be interpreted as follows. The brain is the assembly of many small structures having different permittivity values. In the microwave domain, the spatial resolution is not sharp enough to perfectly describe the spatial variations of the brain permittivity. This is the reason why the reconstruction tends to average the permittivity values and provides lower spatial resolution compared to the exact permittivity map. 2. By comparison with the maximum reconstructed value of the healthy brain, the stroke provokes an increase of 8 to the maximum value of the real part of ✏r, which corresponds to
an increase of 15%. 3. For this kind of images, detection can only be performed by comparison with healthy brain results, which are not available in real life context. Therefore, we cannot simply rely on reconstructed images but we need post-processing capable of allowing automatic discriminations between both types of CVAs. The post-processing treatment is described in the following section.
MRI can accurately detect both hemorrhagic and ischemic strokes, while CT can only detect hemorrhagic strokes but can be used to determine if the stroke is ischemic through the process of elimination. For our post-processing method we propose to check for the presence of the hemorrhage but also to confirm that there is no false detection in case of ischemic stroke. We are looking for the local increase in permittivity that characterizes a hemorrhage, using a binary accumulative processing. We first have to initialize the reconstruction area, i.e., to restrict the area to pixels located inside the skull. For this, we automatically detect the skull, which is quite straightforward because it has one of the lowest permittivity values of the head. We set a threshold at 26 for the real part of the complex permittivity in the reconstructed image, so that values below 26 are identified as pixels corresponding to the skull. We compute the maximum distance rmaxof skull pixels
from the center of the image. We then select pixels whose distance from the center are inferior to rmax and discard the
other values. This has been done for example in Fig. 2. A similar procedure applies for the imaginary part of the complex permittivity. The binary accumulative processing consists of three steps:
• Step 1: create a set of binary images for real and
imagi-nary part of ✏r, showing the stroke’s persistence; • Step 2: accumulate the images to obtain single images
for both the real and imaginary part;
• Step 3: compose both images and apply a threshold to
obtain the final binary image.
The first step of the binary accumulative processing takes advantage of naturally high values of the complex permittivity within the hemorrhage zone due to the presence of blood. We first set an initial threshold, called T0. When sliding the
threshold toward higher values (T0 + n with n 0) the
hemorrhage will still be visible in the image, provided that nremains in the range of values of the complex permittivity of the reconstructed hemorrhage. Real and imaginary parts of the complex permittivity are computed separately. For the real part, TR
0 equals the mean value MR of the real part of the
reconstructed permittivity of the healthy brain plus the 15% increase characterizing the reconstruction of the hemorrhagic stroke.
T0R= (MR+ 0.15⇤ MR). (5)
Once TR
0 is defined, we slide it by step of 1 to obtain gradually
increasing thresholds:
TnR= T0R+ n (6)
where n 2 {0, . . . , nreal 1} and nreal2 N⇤. The initial image
{AR0} is composed of triplets (xl, yl, (<(✏r))l). For all n, we
set up a binary image {BR
n} composed of triplets (xl, yl, bRl,n) according to thresholding: bRl,n= ( 1, if (<(✏r))l TnR 0, otherwise. (7)
In binary images, red color stands for bR
l,n = 1 and blue for
IEEE JOURNAL OF ELECTROMAGNETICS, RF AND MICROWAVES IN MEDICINE AND BIOLOGY 5
(a)Ischemic stroke (b)Healthy (c)Hemorrhagic stroke
Fig. 3. From left to right: brain with ischemic stroke B, healthy brain and brain with hemorrhagic stroke B (real part of permittivity ✏r). part of the complex permittivity ✏r. We call {BnI} the images,
nimag their total number (nimag 2 N⇤) and we compute the
initial threshold TI 0 with:
T0I = (MI+ 0.15⇤ MI). (8)
where MI is the mean value of the reconstructed imaginary
part of ✏r. In Step 2, we separately accumulate and normalize
images of real and imaginary parts as follows. We built images {CR} and {CI} composed of triplets (xl, yl, blR)and (xl, yl, bIl)
with bRl = nrealX1 n=0 bRl,n nreal , bIl= nimagX1 n=0 bIl,n nimag. (9) As a consequence, bR
l and bIlare between 0 and 1. At this point
we must take into account that the increase of permittivity due to the hemorrhage occurs simultaneously on real and imaginary part of ✏r. For this reason, in Step 3, we first
create a new image composing {CR} and {CI}: we point-wise
multiply bR
l and bIl, which compels simultaneous detection and
enables us to suppress (or at least lower) spurious values at the pixel level. Each value of this new image is between 0 and 1, which we interpret as the percentage of pixels detected in the hemorrhage zone. Second, we set up the final binary image with a thresholding process similar to (7). We set the threshold value at 0.8 (⇡ 0.9 ⇥ 0.9), which corresponds to 90% detec-tion in {CR} and {CI}. Still, the threshold value will have
to be definitively settled with measurement carried out with volunteers in hospitals. As for for previous binary images, red color stands for 1 and blue stands for 0. Results for every step of the binary accumulative processing are shown from Fig. 4 to Fig. 6. For Step 1 we built nreal= 8 images {BR
n} and
nimag = 5 images {BnI}. These values are chosen according
to the differences between the maximum reconstructed values from healthy brain and brain with stroke (15%). We settled upon this percentage after 3 simulations. The investigation needs to be pursued with clinical experiments on a large number of volunteers to fix the percentage of change for the reconstructed permittivity and the mean reconstructed value, which are the starting parameters of the binary accumulative processing. In order to show the evolution of the images according to the threshold increase, we display the first, middle and last image in Fig. 4: as expected, the number of red pixels
decreases as the threshold raises. Fig. 5 shows the results of Step 2 for real (left) and imaginary (right) parts. We see that there are several zones with pixels values close to 1 but not all of them are at the same location on real and imaginary parts of ✏r, which shows that we need an additional processing step.
Results for the final images of Step 3 in Fig. 6 show that the hemorrhage is properly located for all the considered cases. We have also checked that the processing provides no detection (entirely blue images) in case of ischemic strokes.
IV. CONCLUSION
In this paper we have investigated stroke detection and identification based on microwave imaging. We take advan-tage of the physical properties of the hemorrhage, i.e., an increase of 10% of permittivity on both real and imaginary parts. Our process relies on a binary accumulative method applied separately on real and imaginary parts of the complex permittivity. The final binary image is obtained by pixel-wise multiplication and thresholding. The hemorrhage is detected at the right location in all tested cases, whereas no false detection occurs in case of ischemic strokes. Identification, including image reconstruction and automatic detection, takes less than five minutes. Although the process is successful so far, in the future we will investigate specific processing for the ischemic stroke. Nevertheless, the case of an ischemic stroke is more challenging since many tissues of the brain have permittivity values that are lower than those in the ischemic region; to the contrary, the hemorrhage is strongly linked to the blood values (highest value of the brain complex permittivity map), making the thresholding-based accumulative processing better suited for this case. Clinical studies will be necessary to validate the proposed detection method and parameters.
ACKNOWLEDGMENT
The work was supported by the French National Research Agency (ANR) ”MEDIMAX” and IDEX UCAJEDI”WIMAG”
projects. The access to the HPC resources was granted by CINECA under the 2017 Italian SuperComputing Resource Allocation (ISCRA). The authors would like to thank the De-partment of Physics, Informatics and Mathematics (University of Modena and Reggio Emilia, Italy) for their involvement on the ISCRA project.
(a){B0R} (b){B3R} (c){BR7}
(d){B0I} (e){B2I} (f){B4I}
Fig. 4. Step 1: brain with hemorrhagic stroke B, with nreal= 8and nimag= 5. From left to right: first image, middle image and last image of Step 1. From
top to bottom, images of real and imaginary parts.
(a){CR} (b){CI}
Fig. 5. Step 2: brain with hemorrhagic stroke B. From left to right: images for real and imaginary parts.
(a)Stroke A (b)Stroke B (c)Stroke C
IEEE JOURNAL OF ELECTROMAGNETICS, RF AND MICROWAVES IN MEDICINE AND BIOLOGY 7
REFERENCES
[1] K.O. L¨ovblad, S. Altrichter, M. Viallon, R. Sztajzel, J. Delavelle, M.I. Vargas, M. El-Koussy, A. Federspiel, and L. Sekoranja. Neuro-imaging of cerebral ischemic stroke, J. Neuroradiol., vol. 35, no. 4, pp. 197–209, 2002
[2] R. Scapaticci, J. Tobson, G. Bellizi, F. Vipiana, and L. Crocco. Design and numerical characterization of a low-complexity microwave device for brain stroke monitoring, IEEE Trans. Antennas Prop., vol. 60, no. 12, 2018
[3] R. Scapaticci, O. M. Bucci, I. Catapano, and L. Crocco. Differential microwave imaging for brain stroke followup, Int. J. Antennas Propag., vol. 2014, Art. ID 312528, 2014
[4] R. Scapaticci, L. di Donato, I. Catapano, and L. Crocco. A feasibility study on microwave imaging for brain stroke monitoring, Prog. Elec-tromagn. Res. B, vol. 40, pp. 305–324, 2012
[5] I. Bisio, C. Estatico, A. Fedeli, F. Lavagetto, M. Pastorino, A. Ran-dazzo, and A. Sciarrone. Brain stroke imaging by means of a Newton-conjugate-gradient method in Lp Banach spaces, IEEE Trans. Microw. Theory Tech., vol. 66, no. 8, pp. 3668–3682, 2018
[6] A. Fhager, S. Candefjord, M. Elam, and M. Persson. Microwave Diagnostics Ahead: Saving Time and the Lives of Trauma and Stroke Patients, IEEE Microw. Mag., Vol. 19, no. 3, pp. 78–90, 2018 [7] M. Hopfer, R. Planas, A. Hamidipour, T. Henriksson, and S. Semenov.
Electromagnetic tomography for detection, differentiation and monitor-ing of brain stoke, IEEE Antennas Propag. Mag., vol. 59, no 5, pp. 86-97, 2017
[8] S. Semenov, T. Huynh, T. Williams, B. Nicholson, and A. Vasilenko. Dielectric properties of brain tissue at 1 GHz in acute ischemic stroke: Experimental study on swine, Bioelectromagnetics, vol. 38, no. 2, pp. 158–163, 2017
[9] S. Semenov, B. Seiser, E. Stoegmann, and E. Auff, Electromagnetic tomography for brain imaging: From virtual to human brain, in Proc. IEEE Conf. Antenna Measurements Applications, Antibes Juan-les-Pins, pp. 1–4, 2014
[10] P. H. Tournier, M. Bonazzoli, V. Dolean, F. Rapetti, F. Hecht, F. Nataf, I. Aliferis, I. El Kanfoud, C. Migliaccio, M. de Buhan, M. Darbas, S. Se-menov, and C. Pichot. Numerical Modeling and High-Speed Parallel Computing: New Perspectives on Tomographic Microwave Imaging for Brain Stroke Detection and Monitoring, IEEE Antennas Propag. Mag., vol. 59, no. 5, pp. 98–110, 2017
[11] A. Zamani, A. M. Abbosh, and A. T. Mobashsher. Fast frequency-based multistatic microwave imaging algorithm with application to brain injury detection. IEEE Trans. Microw. Theory Tech., vol. 64, no. 2, pp. 653– 662, 2016
[12] L. Rudin, S. Osher, and E. Fatemi. Nonlinear total variation based noise removal algorithms, Physica D., vol. 60, pp. 259–268, 1992
[13] J. Nocedal, and S. J. Wright. Numerical optimization. Springer, New York, 2nd edition, 2006
[14] A.K. Alekseev, I.M. Navon, and J.L. Steward. Comparison of advanced large-scale minimization algorithms for the solution of inverse ill-posed problems, Optim. Methods Softw., vol. 24, no 1, pp. 63–87, 2009 [15] A. Abubakar, P. M. Van den Berg, and J. J. Mallorqui. Imaging
of biomedical data using a multiplicative regularized contrast source inversion method, IEEE Trans. Microw. Theory Tech., vol. 50, no. 7, pp. 1761–1771, 2002
[16] M. Haynes, J. Stang, and M. Moghaddam. Real-time microwave imaging of differential temperature for thermal therapy monitoring, IEEE Trans. Bio-med. Eng., vol. 61, no. 6, pp. 1787–1797, 2014
[17] M. Kern, Numerical Methods for Inverse Problems. Hoboken, NJ: Wiley, 2016
[18] F. Hecht. ”New development in FreeFem++”, J. Numer. Math., vol. 20, no. 3-4, pp. 251–265, 2012
Vanna Lisa Coli is with the Universit´e Cˆote d’Azur, French National Center for Scientific Re-search (CNRS), Culture and Environment, Prehis-tory, Antiquity, Middle Age LaboraPrehis-tory, France. Her research interest are on digital signal processing, inverse problems, imaging and modelling. Her cur-rent works deal with signal processing and shape recognition in order to characterise ancient technical systems and materials.
Pierre-Henri Tournier is a research engineer at the Jacques-Louis Lions Laboratory, Universit´e Sor-bonne, French National Center for Scientific Re-search (CNRS), France. He works on devising and implementing robust and efficient parallel numerical algorithms, in particular, using domain decomposi-tion methods for wave propagadecomposi-tion problems.
Victorita Dolean is with the Laboratoire Jean-Alexandre Dieudonn´e, CNRS, Universit´e Cˆote d’Azur, France, and the Department of Mathemat-ics and StatistMathemat-ics at the University of Strathclyde, Glasgow, United Kingdom. Her research interests are in computational methods in wave propagation problems and high-performance parallel computing.
Ibtissam El Kanfoud is a Ph.D. student with the Electronics, Antennas, and Telecommunications Laboratory, Universit´e Cˆote d’Azur, French National Center for Scientific Research (CNRS), France. Her research focuses on electromagnetic simulation of microwave imaging systems for brain stroke detec-tion.
Christian Pichot is a Research Director Emeritus at the French National Center for Scientific Research (CNRS), in the Electronics, Antennas, and Telecom-munications Laboratory, Universit´e Cˆote d’Azur, CNRS, France. His research activity concerns scat-tering and propagation of electromagnetic waves, computational electromagnetics, antenna design and shape optimization, inverse scattering (microwave imaging and tomography), and development of mi-crowave imaging systems. He is a Fellow of the IEEE.
tronics, Antennas, and Telecommunications Labo-ratory, Universit´e Cˆote d’Azur, Centre Nationale de la Recherche Scientifique (CNRS), France. Her research interests include antennas, and microwave and millimeter-wave measurements dedicated to radar and imaging systems.
Laure Blanc-F´eraud is a Research Director at the French National Center for Scientific Research in the Informatics, Signals and Systems Laboratory (Universit´e Cˆote d’Azur, CNRS), in the Morpheme team, shared with Inria and the Institute of Biology Valrose (IBV) in Sophia Antipolis, France. Her research topic concerns image processing, mainly inverse problems resolution, using PDE and calculus of variation, under smooth, non smooth and l0-sparse constraints. She focuses her activity on 3D microscopy imaging in biology.