HAL Id: hal-01024053
https://hal.inria.fr/hal-01024053
Submitted on 1 Aug 2014
HAL is a multi-disciplinary open access
archive for the deposit and dissemination of
sci-entific research documents, whether they are
pub-lished or not. The documents may come from
teaching and research institutions in France or
abroad, or from public or private research centers.
L’archive ouverte pluridisciplinaire HAL, est
destinée au dépôt et à la diffusion de documents
scientifiques de niveau recherche, publiés ou non,
émanant des établissements d’enseignement et de
recherche français ou étrangers, des laboratoires
publics ou privés.
Constructing Visual Representations: Investigating the
Use of Tangible Tokens
Samuel Huron, Yvonne Jansen, Sheelagh Carpendale
To cite this version:
Samuel Huron, Yvonne Jansen, Sheelagh Carpendale. Constructing Visual Representations:
Inves-tigating the Use of Tangible Tokens. IEEE Transactions on Visualization and Computer Graphics,
Institute of Electrical and Electronics Engineers, 2014, Transactions on Visualization and Computer
Graphics, 20 (12), pp.1. �10.1109/TVCG.2014.2346292�. �hal-01024053�
Constructing Visual Representations:
Investigating the Use of Tangible Tokens
Samuel Huron, Yvonne Jansen, Sheelagh Carpendale
Fig. 1. Constructing a visualization with tokens: right hand positions tokens, left hand points to the corresponding data.
Abstract—The accessibility of infovis authoring tools to a wide audience has been identified as a major research challenge. A key
task in the authoring process is the development of visual mappings. While the infovis community has long been deeply interested in finding effective visual mappings, comparatively little attention has been placed on how people construct visual mappings. In this paper, we present the results of a study designed to shed light on how people transform data into visual representations. We asked people to create, update and explain their own information visualizations using only tangible building blocks. We learned that all participants, most of whom had little experience in visualization authoring, were readily able to create and talk about their own visualizations. Based on our observations, we discuss participants’ actions during the development of their visual representations and during their analytic activities. We conclude by suggesting implications for tool design to enable broader support for infovis authoring.
Index Terms—Constructive visualization; Physical visualization; Dynamic visualization; Empirical study; Token; Visualization
author-ing; Information visualization; Visual mappauthor-ing; Novices; Visualization construction; Visual analytics
1 INTRODUCTION
The use of information visualization (infovis) is becoming increas-ingly widespread, with the result that infovis can now be encountered in everyday life: online, in newspapers, or on TV shows. In response, the research community started to consider infovis for purposes other than strictly analytical ones [43] and to explore questions such as the democratization of visualization [53]. However, this democratization requires that the general public, not just experts, be able to design, publish, and discuss their own visualizations with their own data.
The need to create new, more accessible information visualization tools is noted as a major research challenge [29, 36]. As Victor [52] illustrates, the available software tools either offer only a limited set of predefined visualization templates or require effort and skills, such as coding, to create more adapted or customized results. By comparing different approaches to creating visualizations, e.g. spreadsheet soft-ware, programming languages, and computer assisted drawing, he
de-• Samuel Huron is with Inria and IRI. E-mail: [email protected]. • Yvonne Jansen is with Inria and University of Copenhagen. E-mail:
• Sheelagh Carpendale is with University of Calgary. E-mail: [email protected].
Manuscript received 31 March 2013; accepted 1 August 2013; posted online 13 October 2013; mailed on 4 October 2013.
For information on obtaining reprints of this article, please send e-mail to: [email protected].
rives three relevant properties that may help the community reach the goal of creating accessible yet powerful visualization tools: simplic-ity, expressivsimplic-ity, and dynamicity. We can find some of these properties in existing tools that people spontaneously use to help them think vi-sually. Examples include creating visualizations with manual encod-ing [5], on napkins [14], on whiteboards [54], with paper and scis-sors [19], or building tangible visualizations [34].
In previous work, we defined constructive visualization [31] as a theoretical basis for a new visualization authoring paradigm based on Froebels ideas [21]. Constructive Visualization is motivated by ben-efits that may arise from constructing a visualization out of tokens. Since tokens can be added and removed as needed, such constructions offer possibilities for both expressive freedom and dynamic adjust-ment. We present in this article a study to examine and refine this paradigm. Our goal is to investigate: if people can construct their own visualizations using tokens, how they construct their visualizations, and what type of visualizations they create. Finally we are interested what limitations people encounter with this approach. In particular, we focus on the visual mapping process – the process by which peo-ple use tokens to create a visual arrangement that represents their data. Our deconstruction of this process reveals eleven logical tasks that can be grouped according to their main purpose of construction, computa-tion and explanacomputa-tion. Our primary contribucomputa-tions are:
• showing how infovis novices create, update, and discuss a tangible token based visualization;
onto a visual and spatial representation with tangible tokens; • presenting a visual mapping model that allows researchers to better
understand the activity of this specific population;
• presenting implications for research and design, highlighting op-portunities for future research; and
• offering suggestions for new approaches to designing infovis digital and tangible authoring tools.
2 MOTIVATION& BACKGROUND
Here we motivate our research question from open research challenges and provide a rationale for the design of our approach. To keep the discussion coherent, we define our commonly used terms in Table 1.
token A token is a basic unit to which information or data has been mapped.
construct A construct is the result of the assembly of two or more tokens and can contain any number of tokens, or tokens and one or more constructs.
assembly model An assembly model is the process by which a construct is created. This process can involve different types of activi-ties such as construction and deconstruction.
representation A representation is a formal system for making explicit cer-tain entities or types of information [41].
presentation A presentation is the act of displaying a representation, em-phasizing and organizing areas of interest [13].
Table 1. Summary of terminology used throughout this article.
2.1 Infovis Democratization
The benefits of visual thinking are currently well established [8, 12]. Beyond the consumption of prepared visual representations, studies show that the creation and manipulation of visual representations can improve the learning and understanding of students [22, 24, 48]. Sim-ilarly, even for abstract problems such as Bayesian reasoning [42], the active construction of a visual representation seems promising [17]. These studies focus on simple diagrams or only require participants to draw on pre-existing visual representations. There is still a lack of studies investigating self-defined visual representations.
Indeed, the creation of information visualizations by a wide audi-ence has been identified as a major challenge by several researchers. The NIH/NSF visualization research challenges report states: “A big challenge is to create [...] a system that, while clearly not compre-hensive and all-powerful, does help to enable non-experts to perform tasks [...] in any reasonable time frame. [...] The goal is to make sualization a ubiquitous tool that enables ordinary folks to think vi-sually in everyday activities” [36]. Similarly, Heer and Shneiderman point out the need to create new interfaces for visualization specifica-tions: “Novel interfaces for visualization specification are still needed. [...] New tools requiring little to no programming might place custom visualization design in the hands of a broader audience” [29].
Tools such as ManyEyes [53] and Tableau Public [3] attempt to make the creation of visualizations accessible to a wider audience. These web-based tools allow one to create, publish and discuss visual-izations. These tools support the creation of visualizations by provid-ing sets of pre-defined templates which can be populated with one’s own data. Despite the benefits of this work, potential users are lim-ited to the templates provided by the respective websites and have no means of developing their own visual mappings.
2.2 The Challenge of Visual Mapping
The development of a visual mapping from data dimensions to visual features is a key task of the visualization authoring process. The com-mon reference model for this process is shown in Figure 2. The core of this model, the visual mapping transformation, defines the map-ping from a dataset to a visual representation, or more specifically the mapping of data dimensions to the variables of the visual marks that compose the visual representation [9].
While much work has been done on finding perceptually efficient visual representations [15, 56], we know comparatively little about how humans perform the step of visual mapping themselves [26].
presentation mapping percept information visual mapping visual representation processed data rendering visual presentation integration percept transformation decoding + insight formation visual mental model data transformation
raw data presentationphysical
Fig. 2. The extended visualization reference model [34], adapted to our terminology.
Consequently, to improve the accessibility of visualization authoring tools, we first need a better understanding of how a visualization au-thor performs a representational mapping transformation.
2.3 Choosing a Methodology
Several different approaches exist that can inform the design of new visualizations tools. One is to study currently existing tools to deter-mine possible improvements for these and future tools. For example, Grammel et al. [26] conducted a study to understand how non-experts design visualizations. In order to avoid confounds possibly introduced by the use of a specific software tool, participants were asked to spec-ify visualizations verbally while an operator created and displayed the resulting visualization to the participant. This study identified three barriers related to the visual mapping process: i) selecting which di-mensions to map to visual variables, ii) selecting which visual marks to use, and iii) decoding and interpreting the visual result. While this study provides valuable insights, it is based on the participants choos-ing among pre-defined templates and thus leaves many unanswered questions about the details of the visual mapping process.
A different approach is to design a new technique, to develop a prototype, and to compare it empirically to currently existing tools. While this may provide insight into the tools studied, this approach does not unpack the visual mapping process. Yet another approach is to study human behavior independently from the design of specific software tools. Our work falls into this category. Observing how peo-ple construct their own visual mappings may help us to develop a bet-ter understanding of basic processes of visualization authoring. This understanding may then be valuable for informing future tool design. Observing people developing visualizations without a software author-ing tool reduces possible tool bias and allows us to observe directly the behavior that is commonly encompassed within a software tool.
2.4 Design Paradigms of Infovis Authoring Tools
The underlying design paradigm of an infovis authoring tool is rel-evant to consider in the context of a tool’s accessibility for a wide audience. Existing tools can be classified by considering their design paradigm. Victor [52] distinguishes between three fundamentally dif-ferent paradigms:
Using pre-existing visualization software, such as Excel, Tableau [4], Spotfire [2], ManyEyes [53], Google Chart Editor [1].
Drawing visualizations either free-hand such as studied by Walny et al. for whiteboards [54, 55] or by using computer aided drawing tools such as Adobe Illustrator.
Coding custom visualizations, usually on the basis of existing toolkits or environments such as Processing [44], the Infovis toolkit [20], Prefuse [28], or D3.js [10].
For the purpose of unpacking a visualization author’s processes, all of these approaches are problematic. Coding requires specific program-ming skills while using requires the mastering of a specific application and restricts an author to the provided templates. Drawing is less re-strictive and requires no specific skills but offers no dynamic response and is also problematic as it easily leads to premature commitments [27] due to an increased difficulty of changing a drawn design.
A recent survey of infovis authoring tools inspects articles pub-lished in the main human computer interaction venues over the past twelve years [25] and identifies six different design paradigms: vi-sualization spreadsheets, template editors, shelf configuration, textual programming, visual dataflow, and visual builders. Using Victor’s
classification we can consider visualization spreadsheets, template ed-itors and shelf configuration as variations with his template of using. Textual programming maps to Victor’s coding. Of the remaining two paradigms visual dataflow can be seen as combining coding with
us-ing. Visual builder refers to systems which support construction of vi-sualizations out of basic graphical elements. While this last approach has potential for supporting the free development of visual mappings without requiring specific programming skills, currently tools in this category still require one to master a design environment.
We recently described an alternative paradigm called constructive
visualization[31]. The basic idea of this new paradigm is to construct
visualizations out of tokens (see Table 1). This paradigm is derived from pedagogical theory and the analysis of existing practices such as the construction of visualizations out of Lego bricks and other ma-terials. Such token-based constructions offer the advantage that they can be implemented entirely physically and hence avoid biases due to learning effects with specific software applications or limitations of the hardware employed. Moreover, a token-based approach can ben-efit from the way people use space to support their cognitive abilities as analyzed by Kirsh [38]. These specific spatial abilities have al-ready been studied in different information workspaces such as Visual Knowledge Builder [49] and multi-screen analysis applications [7]. In particular Andrews et al. [7] discuss how space was used by their par-ticipants as both an external memory aid and a semantic layer.
.
2.5 Token-based Visualizations
The concept of tokens has been used in the past by different commu-nities with a variety of connotations. We distinguish two classes of tokens by considering whether meaning is assigned in a static or dy-namic fashion. For example, in computer science, a token can have a static identity referring to a transferable data object with a specific identity, e.g., a security token or an invitation token. Alternatively, it can be dynamic. For example in parsing, a token represents the small-est meaningful unit of information within a longer series of data, if its binding changes programmatically, it is dynamic. In the context of
constructive visualization, a token has a dynamic identity which the
visualization author defines during the construction of the visualiza-tion.
Physical tokens have also been used by pre-historic societies for hu-man information processing purposes [47]. In this context, tokens had a static identity as each specific shape always referred to the same in-formation. Existing currency systems still function on the same prin-ciple, e.g., a 50¢ coin has a static identity and can be readily recog-nized based on its shape, size, and markings. Tokens have also been extensively used as tools to teach mathematics in kindergarten [40]. More recently, token-based information visualizations have emerged as a trend in the infovis community [33, 35, 46, 57]. However, few studies exist on how people manipulate tokens as part of a visual
map-ping process. Here we summarize existing token-based visualization
techniques.
Ullmer et al. [51] discuss the concept of physical tokens in the context of tangible interfaces. In their model, digital information is mapped to physical tokens and logical constraints are mapped to phys-ical constraints. They identify three styles of physphys-ical mapping to digi-tal interpretation: “interactive surface”, “token+constraint”, and “con-structive assembly”. In this work we study and extend the notion of “constructive assembly” to information visualization. Yi et al. [57] use a magnet metaphor to map multivariate data. Data dimensions are mapped to “magnets” and by moving these, data points are attracted depending on their value for the respective data dimension. Each data point can be seen as a token, though tokens are not interactive objects here and can only be indirectly manipulated through the “magnets”. In our study, we investigate the direct manipulation of tokens rather than mediated manipulation. Jetter et al. [35] use physical tokens to represent queries in a faceted search on a tabletop. Each token is a physical object representing a search facet. By manipulating the to-kens, one can create a query through a hybrid interface. Similarly, Klum et al. [39] used stackable tangibles to process faceted search. In
these two examples, tangibles are used to filter a virtual visualization. In contrast, we focus on the use of tangible tokens to construct the visualization itself.
Huron et al. [32] used a sedimentation metaphor to visualize dy-namic data streams over time. Data chunks are mapped to visual to-kens, which fall down into a deposit area, and then aggregate over time into a pre-defined area chart. Tokens are not directly manipu-latable and a visual sedimentation requires coding. Rzeszotarski et al. [46] visualize multivariate data as tokens and combine these with physical affordances. In their multitouch system, data are mapped to points, which are equivalent to tokens. The system provides a set of virtual tools which support the building of representations by changing points’ positions, appearances, and interactivity.
In these last two approaches, discrete visual marks are used to rep-resent and manipulate data, one for data streams, and the other for multivariate data. Both simulate physical affordances of tokens in an environment to create visualizations. Also both claim that; (1) the resulting visualizations are usable with minimal training, and (2) the visible evolution of tokens over time supports understanding of visual assembly and update. These claims are part of the motivation for our study to learn how people assemble tokens for visualization purposes.
3 STUDYDESIGN
In this study we focus on: i) learning more about the visual mapping process, ii) gaining some understanding about what makes the visual mapping process sometimes rather difficult [26] and sometimes quite easy [14], and iii) exploring the suitability of constructive authoring of infovis as an approach to the creation of visualizations.
3.1 Participants
We announced our study by mail, social network, mailing list, and ran-domly approached people on the street (the study took place in a down-town center close to transportation facilities). We recruited 12 partici-pants from a variety of disciplinary and educational backgrounds, with an effort not to disproportionately select those from visualization, hu-man computer interaction, and computer science in general. Partici-pants were between 22 to 43 years old with a median age of 28. They predominantly had a high school diploma, with 2 to 8 years (median 5 years) of further study in a variety of fields such as art, humanities, and science. More demographic background information is summa-rized in Table 3. All participants were rewarded with a 10 Euros gift coupon from a well-known online webstore. All but one participant agreed to be videotaped during the study.
3.2 Setup
Each element of the setup was described by the facilitator in the fol-lowing order:
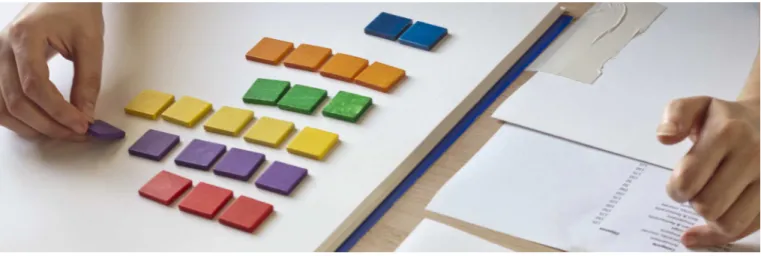
#1The printed dataset. We use an aggregated version of a bank ac-count statement as our dataset. The participant sees three months of expenses on an A4 paper fixed to the table. All expenses are grouped into categories: “amusement”, “bar and restaurants”, “gro-ceries”, “transportation”, and “travel”. To simplify the participants’ data processing all values are rounded to 25. The dataset is ordered first chronologically (Aug., Sept., Oct.) and then by expense category. The order of categories varied across months.
#2The token box. The tokens were contained in two boxes with four compartments taped together and to the table. Six of the eight com-partments contain tokens. Each compartment contains 36 colored to-kens (red, orange, yellow, green, blue, violet). Participants are not explicitly informed of the total number of tokens. The tokens are 25 millimeters wooden tiles taken from a learning toys kit designed by Froebel [40] for Kindergarten education.
#3The token mapping. Since we rounded all data values to the near-est 25, we suggnear-ested to participants a mapping of 1 token∼ 25 and indicated it on an A5 paper sheet with a 3D printed version of a token.
#4An A2 paper canvas. The working area was a fixed A2 paper can-vas, which was placed in the center of the table.
135 22 44 Camera front Camera top 39 31 5 10.5 21 130 90
#1
#3
#2
#4
Fig. 3. Study setup (all measurements are in centimetres).
3.3 Procedure
After filling out a consent form and a demographic questionnaire, par-ticipants were introduced to a specific scenario that provided them with a goal for their task: to help a friend improve his budget. The fa-cilitator then explained the study setup and the tools available to help them reach their goal. We structured the study such that participants were first asked to create a visualization based on the available data. When finished, in a semi-structured interview, the facilitator asked par-ticipants to explain their visualizations. Then, parpar-ticipants were given new data and asked to update their visualization. Afterwards, a second interview was conducted. Next, the participants are asked to annotate their visualization such that their friend, whose budget they visualized, would be able to later understand what they had done. Finally, partic-ipants filled a post-session questionnaire and received a gift card in compensation. The study lasted on average 70 minutes (minimum of 40 minutes; maximum of 103 minutes).
3.4 Tasks
The three tasks that we asked participants to perform were:
A: Create a visualization. To increase the ecological validity of our study, we provided participants with a scenario they could encounter in their real life. We told them that a friend has asked for their help with his financial situation. The friend admits to having trouble man-aging his expenses and to being unsure how to resolve the situation. Then, the facilitator points to the dataset and comments that currently changes over time are hard to see, and a visual representation might be helpful. The available tools for creating such a representation are the tokens placed on the table, and since all values in the dataset are divisible by 25, a mapping of 1 token∼ 25 seems reasonable. Partic-ipants are then invited to take all the time they need and to inform the facilitator once they are finished.
B: Update a visualization. The facilitator tells the participants that the friend provides them with one more month of data. The facilitator slides up the data printout (Figure 3 #1) to reveal a month previously hidden by a paper mask. Participants are asked to update the visual-ization to include the new data, using all the time they need.
C: Annotate a visualization. The facilitator informed the partici-pants that their friend was not currently able to receive their advice. The facilitator provided participants with 4 pens of different colors and a variety of post-its and asked them to annotate their visualization explaining what they did and what they discovered. Participants were explicitly asked to provide sufficient information such that their friend could (1) read the visualization, (2) understand it, and (3) be able to re-create it if needed. Additionally, participants were asked to indicate possible budget improvements. Again, participants had all the time that they wanted and were asked to declare when they had finished.
3.5 Data Collection
To analyze the study tasks, we gathered four types of data.
Video. We recorded the entire process for the participants who gave their agreement. We used two cameras with different viewing angles: a bird’s-eye view, and a view from the front as noted in Figure 3. Questionnaires. Through questionnaires we gathered demographic information, the participants’ opinions on the techniques they used, and the task they had performed.
Interviews. Between task A and task B we conducted a semi-structured interview. During this interview, we asked participants to explain the visualization they created, how they made it, what they manipulated, if they found the task difficult and their thoughts about the activity in general. The goal of these interviews was to obtain more information about their process and the problems they encountered. Photographs. After each task, we took pictures of the state of the visualization on the canvas. Sometimes, during the task, we also took pictures of unexpected behavior.
3.6 Data analysis method
We collected approximately 1540 minutes of videos (2 cameras × 11 participants × 70 min per session, on average). We analysed the video using a qualitative data analysis approach as described by Creswell [18]. The coding of the video was performed in several passes, using in an iterative process. There was primarily one coder, with frequent group discussions between iterations to ensure agree-ment. During the first pass, we described and analyzed the mapping of the final result and noting what was directly apparent during the pro-cess e.g. “[the participant] counted and placed the tokens in a heap”. During the second pass, we identified the regularities between partici-pants during the process. For the third pass, we re-defined our coding to expressly consider actions of participants in terms of transforma-tions within the infovis pipeline. We then applied this selective coding in two passes. Our approach is limited to what we could code and observe. Because participants sometimes created their own mappings in an iterative fashion, we could not always identify if a token was mapped to a data point, and if so, to which point. Some types of oper-ations and decisions (such as data transformoper-ations or color mappings) can only be observed by their result. Hence, where possible, we used information gathered from the interviews to resolve uncertainties in our observations.
4 RESULTS
All participants were able to complete the three tasks in a relatively short period of time (on average they spent: 11 minutes to create, 6 to update, and 7.5 to annotate). However, the time varied consider-ably across participants and tasks (Table 3). To present our results, we deconstruct the study tasks into their why, what, and how compo-nents [34] (summary in Table 2). We identified 11 different subtasks, named after their what component, i.e., the logical task, and grouped by their why component, i.e., their underlying goals, into
construc-tion, computation, and storytelling. Each of these 11 tasks can require several actions in different combinations and in different orders of exe-cution. While we cannot directly observe mental operations, we noted
Why What (logical task) How (mental and physical actions)
Construction
1. Load data READ,COMPUTE,SELECT COLOR,GRASP,CREATE 2. Build constructs ORGANIZE,MOVE
3. Combine constructs ARRANGE,ALIGN
4. Extend READ, COMPUTE, SELECT COLOR, GRASP,
CREATE,ORGANIZE,MOVE,ARRANGE,ALIGN
5. Correct INCREASE,DECREASE,REMOVE
Computation
6. Categorize SELECT COLOR,ARRANGE,MERGE,SPLIT
7. Aggregate MOVE,MERGE
8. Compute New Value SPLIT,COMPUTE+LOAD
9. Unitize ORGANIZE,ARRANGE,SPLIT,MERGE
Storytelling
10. Highlighting SPLIT(temporarily)
11. Marking CREATE,SELECT COLOR
1.Load data 2. Build constructs 3.Combine constructs CREATE Construct INCREASE Construct(s) DECREASE Construct(s) MERGE Constructs REMOVE Construct(s) AM ORGANIZE Construct AM ARRANGE Constructs AM READ
Data SELECTColor(s)
TG SPLIT Construct(s) ROTATE Constructs ALIGN Constructs AM GRASP Token(s) COMPUTE Token(s) Construct(s) OPTIMIZE Construct(s) MOVE Construct(s) 4. Correct
Fig. 5. A flow diagram showing the most common paths. In purple: the mental tasks, in blue: the physical tasks. The gray background rectan-gles illustrate the logical tasks. The gray oblongs linking two spheres represent possibly concurrent actions.
three such actions from observable physical actions. These areREAD
-ING(where the participant is looking at the data and sometimes tracing with a finger),SELECTING(where the participant makes a selection physically), andCOMPUTING(where the participant calculates addi-tional values, such as averages, in an observable or verbally declared manner). Figure 5 illustrates the relationship between these actions while arrows highlight the most common successions of actions. We present our findings for each of the logical tasks. Since actions can be part of different tasks with different purposes, we presentACTIONS
here in the context of logical tasks.
4.1 Construction
We define a visualization as a nested construct of tokens forming a representation of data. As a representation, each of the visualizations follows a formal system – the mapping between data dimensions and available physical variables. We call this formal system an assembly
model. Assembly models vary across participants and either develop
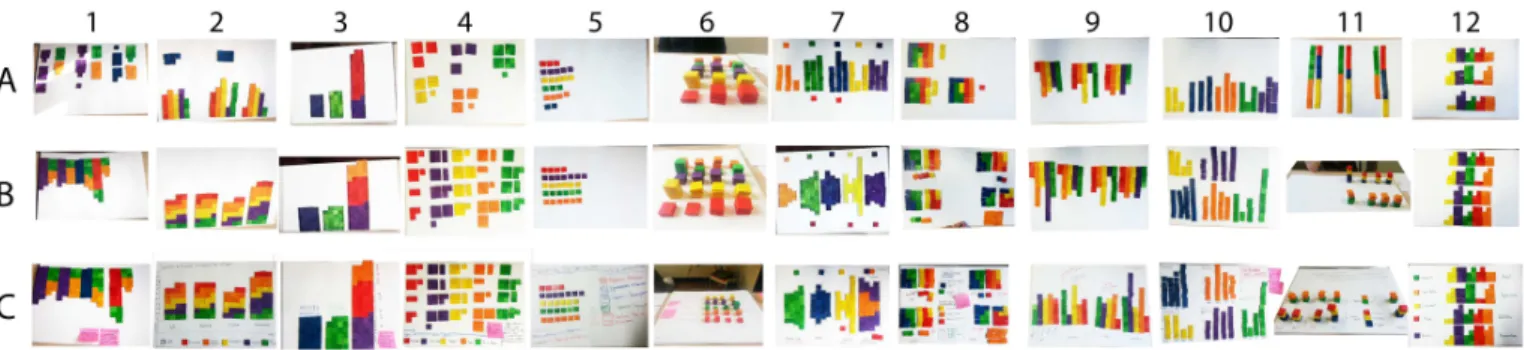
or become apparent to an observer during the construction process. Figure 4 shows the resulting visualizations.
1. Load data: Loading a datacase involved several actions. First, the participant needed toREADthe data. As Figure 6 illustrates, they per-formed this action in different ways: (a) by just looking at the data, (b) by assisting the reading through pointing, (c) by multiplexing reading with some other action such asGRASPINGtokens at the same time.
Participants then needed toCOMPUTEthe required number of to-kens for the data value, e.g., 125∼ 5 tokens. This step was the only action that required computations and occasionally led to mistakes. Computation actions were commonly not physical, though some peo-ple used physical assistance such as accumulating tokens in their hand, counting them up until they reached the data value.
Similar toCOMPUTE, theSELECT COLORaction is also a process which only became apparent once a participant GRASPEDtokens of
Fig. 6. View from the front camera on three participants (1) reading, (2) reading and pointing, (3) reading and grasping tokens.
a specific color. All participants used color to structure and empha-size single or groups of categories. By choosing a color, a participant expands her assembly model or makes it explicit.
Tokens wereGRASPEDindividually or in groups (Figure 7–1/2) de-pending on whether participants (a) counted tokens while grasping them, (b) grasped several tokens and counted them into their other hand, (c) replaced tokens already in their hand, or (d) put tokens back. Once participants placed tokens on the canvas (Figure 7–3/4/5) to form a group, they built a construct. At this point it was not yet appar-ent whether participants were already following an assembly model in their mind or whether that model only emerged during the course of the task. However, we observed that all constructs built by participants were visually dense, and often already highly structured.
2. Build constructs: Initial constructs were not necessarily organized following a formal system but sometimes just consisted of unorga-nized heaps of tokens (e.g., Figure 10–1). In the next step, participants
ORGANIZEDsuch amorphous constructs into meaningful and identifi-able shapes such as lines or rectangles (Figure 8). By doing so they defined rules and visual parameters formalizing (a) the spatial relation-ship between tokens within the construct they were creating, and (b) the spatial relation of the newly created construct to the canvas. 3. Combine constructs: When participants created a second construct for a second data case, they had to consider how toARRANGE con-structs relative to each other (Figure 9). We observed that spatial re-lationships between constructs were often used to encode hierarchical information such as groupings by expense categories then by month or the other way around. Such specifications could be made explicit, for instance, by defining an axis (observed for 11 out of 12 partici-pants, written (11/12) from here on) or other custom configurations (Figure 4–4|A/8|A). Since the study dataset contained two dimensions for each value (month, expense category), participants had to decide at least twice how to encode these dimensions in their arrangement. Some participants recombined their constructs repeatedly before de-ciding on a final encoding.
Some participants tried several different structural combinations be-fore settling on one, sometimes eventually going back to one tried ear-lier. For example, in Figure 9 we can see a participant change from a vertical barchart aligned along the x-axis (1) to a horizontal stacked barchart aligned to the y-axis of her canvas (2). Changing the arrange-ment of constructs can also impact their internal spatial organization. For example, in Figure 9 (3) the participant switched her representa-tion from one where a single color encoded the data to one where the data value is read from the area of the construct.
4. Extend: This refers to the task of applying rules of an assembly
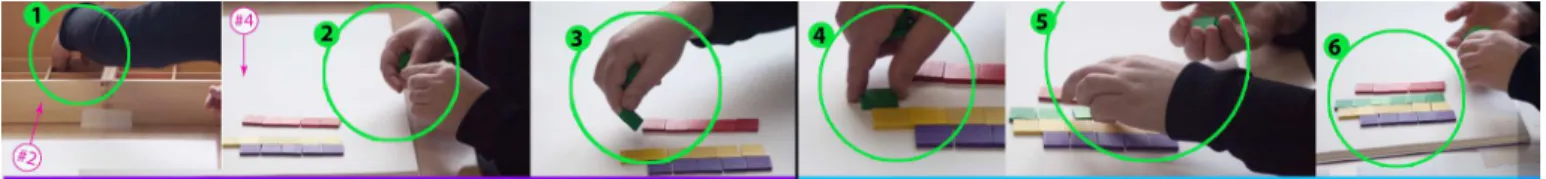
Fig. 7. A participantGRASPStokens (1,2,3) andBUILDSa construct (4,5,6). She is: (1) grasping some tokens from the box, (2) manipulating and transporting the tokens from the box to the canvas area (3) positioning the tokens, (4,5) starting to create a new green construct by placing tokens one by one on the canvas, (5) augmenting the construct in an organized way following her previous assembly (6) done. The pink annotation: #2 points to the token box. #4 points to the canvas.
Fig. 8. Examples of constructs: (1) a line, (2) square and rectangles, (3) a layered construct resembling a horizon graph [45] to optimize canvas real estate, (4) a 3D bar chart column with two nested constructs in green and orange.
model developed during the initial building and combining of con-structs to the rest of the data. For example, afterARRANGINGall data cases for the first month, and combining the constructs for the month dimension, participants could just repeat their previous actions to add the data for the other months. Often this replication was a linear (Fig-ure 11) application of the assembly model but sometimes extend led to further changes of the representation, the spatial placement of con-structs (without changing the assembly model) or the overall structure. Extension can be applied to any sequence of actions. In Figure 10 we can see that participant 4 has repeated a process of extension on
load-ing tokens without organizing them (1), then heORGANIZESa first construct and startsARRANGINGa second construct to form a hierar-chy (2), and then extends again to all constructs (3).
5. Correct: COMPUTINGthe required amount of tokens occasionally led to mistakes. Participants commonly recovered later from such mis-takes once the visual representation of the data facilitated the compar-ison of values. At this point the task of checking the data had become a visual task instead of a mental one thereby reducing the cognitive effort [30]. If participants noticed such mistakes, theyINCREASEDor
DECREASEDthe number of tokens in a construct accordingly. A few times we also observed participants REMOVING an entire construct due to a previous error or a color re-attribution.
4.2 Computation
The overarching goal we set participants – helping a friend to im-prove his budget – inspired some participants to compute additional values such as total amount of expenses, aggregation of categories into mandatory and discretionary expenses, or explicit deltas between high-expense and low-high-expense months. Hence, among all the participants’ visualizations, we observed several constructs which are not directly mapped to data, but are a result of a computation by the participant. We observed such behavior during all three tasks (A, B, C). In this section we describe four different tasks we observed: categorize,
ag-gregate, compute new value, and unitize.
Fig. 9. Participant 2 tested four different combinations with the same visual constructs. During each rearrangement she adapted the organi-zation of the constructs as necessary.
Fig. 10. Participant 4, (1) afterLOADINGall the tokens, (2)ORGANIZING the red construct, (3)EXTENDINGto other constructs.
Fig. 11. Participant 12, (1) defines a assembly of construct for the first month (2) then replicates it for the next month (3), shows the result (4).
6. Categorize: A common data transformation task was the cre-ation of meta-categories (5/12) by developing groupings that partic-ipants considered meaningful, e.g., grouping expense categories into essential and non-essential. Meta-categories were encoded in differ-ent ways, such as by spatial arrangemdiffer-ent (4/12), by color semantics (e.g., warm vs. cold colors) (1/12), color attribution (2/12), and spatial
merges(3/12). For example, participant 11 (Figure 12–C1/C2) used
spatial arrangements to indicate two categories: “reducible expenses” (red, blue and yellow) and “irreducible expenses” (orange and green). These categories persisted throughout the study: first as stacked 2D lines (Figure 12–C1) then as stacked 3D bars (C2). Participant 8 (Fig-ure 12–F) used color semantics to express a similar grouping. She decided to SELECTwarm COLORSfor “leisure expenses”, and cool colors for “necessary expenses”. This encoding allowed her to keep the original categories identifiable and comparable.
7. Aggregate: Aggregation was the most commonly performed com-putation (7/12). When participants aggregated data, they usually did so within one dimension, i.e., aggregating all expenses per month or all expenses per category. Aggregation could be done in the data domain, by mentally adding the data, or in the visual domain, byMERGING
constructs, or byINCREASINGconstructs during initial loading. We also observed aggregation byMERGINGwithout explicit aware-ness. For instance, participant 1 (Figure 12–A) categorized bySE
-LECTINGthe same color for a subset of categories during task A. Then during task B, she wanted to free space on the canvas andMERGED
constructs representing different data categories (Figure 12–A2/A3). With this action she effectively aggregated the values for same-colored categories. When asked during the interview what she did, she stated: “I just added the new month. I didn’t change anything else.”.
Participant 2 performed an aggregation that preserved the underly-ing data. As shown in Figure 12–B, sheMERGEDall categories within a month similar to participant 1. However, she had assigned different colors to categories so that the separate categories were still visible. Additionally, her arrangement into one bar per month represented the aggregated value for total expense per month.
8. Compute new value: Some participants (3/12) computed new values to provide additional goal related information (to help their friend with his budget). In Figure 4–A|2 and Figure 12–D, we can
Fig. 12. Computations: A1/2: categorize by color assignment; A2/3: aggregation by merging constructs; B: information preserving aggregation;
C1: aggregate by spatial merge, categorize by proximity; C2: same categories as in C1 but different arrangement of constructs; D: computation of
delta with another month in blue (highlighted);E: unitized construct∼ 100; F: unitized and merged construct to illustrate a month’s budget.
observe that participant 2 computes the monthly difference against the month with the lowest expenses (represented by blue tokens above each month). She explained in the interview that she did this because her visualization previously did not allow her to see the difference be-tween months. Similarly, participant 11 computed in task C the aver-age of each expense category across months and built two piles in a column to the right to present this extra information (Figure 4–C|11). 9. Unitize: Some of the participants (4/12) subdivided their constructs into meaningful units (e.g., 2 x 2∼ 100). We observed two ways to perform this task: ORGANIZEinto subconstructs, orORGANIZEsuch that the width or height of a construct represented a meaningful unit, e.g., a line of 4 tokens within a bar represents 100 (Figure 12–D & Figure 4–B|8 and B|2). Figure 10–2 shows the first approach where the participantORGANIZEShis constructs into squared subconstructs of four tokens. The second approach, changing the width of a con-struct, can be seen with participant 3 (Figure 4–B|3 to C|3). During the interview he explained that columns with a basis of 4 tokens facil-itate the visual estimation of variables. Participant 8 (Figure 12–E & Figure 4–8|A/B/C) employed an unexpected computation technique. After receiving the instructions for the study she stated it would be difficult to help the friend without knowing his overall budget (which was not provided). To compensate, she decided to impose a hypotheti-cal budget based on the given expenses. To do so, sheARRANGEDthe constructs for all categories of a month into a square, and she consid-ered all tokens which did not fit the square as excess expenses. Priority inside the square was given to “needed expenses” the remaining space was filled with tokens from the “leisure” meta-category.
4.3 Storytelling
During the interviews, we observe that some of the participants (5/12) spontaneously manipulated their visualizations to support their argu-ments. Here we list two tasks, highlighting and marking.
10. Highlight: Some of the participants (4/12) supported their ex-planations during the interview with temporary modifications such as H A HS A A A HS HA A
Considered updating (easy: ,or complex: )
Did you manipulate object Did you manipulate data
(yes: , no: , null: ) (yes: , no: , null: )
Education Domain (Art, Humanities, Science) Gender (Male: , Female: ) Age (Min: 22, Average: 28, Max:43) Highter Education (1year: , 8years: )
Proficiency programming (1: ,5: )
Proficiency drawing (1: ,5: )
Proficiency create infovis (1: ,5: )
Proficiency read infovis (1: ,5: ) Self rated
on 5-point likert scale
Frequently work with data (1: ,5: )
Frequency of reading infovis. (5: ,>3500: )
Frequency of creating infovis. (5: ,>3500: ) over a
year
Task A (Min: 5, Average: 10, Max:28) Task B (Min: 2, Average: 5, Max:14) Task C (Min: 3, Average: 7, Max:17)
Minutes
Internalization of token mapping
Participant 1 2 3 4 5 6 7 8 9 10 11 12
Interview
Enjoyed building a infovis Would do it again Would do it with other data Difficulty of infovis creation Customisability of infovis Modifiabilty of the results
Compared with other techniques this was , Hard: , Neutral: ) (Easy: , Hard: , Neutral: ) (Easy: , Hard: , Neutral: ) (Easy: Expressive Easy to manipulate Easy to update Effective to explore data
, Less: , Neutral: ) (More: , Less: , Neutral: ) (More: , Less: , Neutral: ) (More: , Less: , Neutral: ) (More: Self rated on 5-point likert scale , S. Disagree: ) (Strongly Agree: , S. Disagree: ) (Strongly Agree: , S. Disagree: ) (S. Agree: Questionnaire answers Time Spent Demographic Information HAHSA A AHSHA A
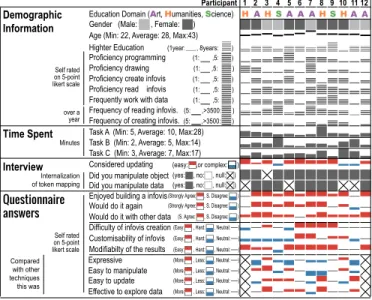
Table 3. Demographic information and questionnaire an-swers. An extended version of this table is accessible on-line: http://constructive.gforge.inria.fr/#!questionnaires.md.
Fig. 13. Storytelling: A1: unitized construct; A2: temporarySPLITto explain the categories; B1: marking of categories exceeding budget;
B2/B3 marking and annotation how to optimize budget.
pointing,MOVING, SPLITTINGand MERGING. For instance, partic-ipant 8 performed a modification that could be observed as the sep-aration between cool colored constructs (“mandatory expenses”) and warm colored constructs (“fun expenses”) in Figure 13–A1 and A2. This modification supported what she was saying: “If we want to ex-plain to our friend his expenses, we have to produce a synopsis to show what is the financial flexibility” (at this point she splits the construct to highlight this, see Figure 13–A2).
11. Marking: One participant used tokens as markers, indicating points of interest (e.g., possible expenses to optimize). In Figure 13– B1, he placed red tokens at the bottom edge of two columns to mark problematic expenses in these categories. After the update for task B the point of interest changed. The participant termed it “an indicator” and declared that “It’s an indicator to [. . . ] alert. It’s more an analytic pointer than just the data.”.
5 DISCUSSION
In this section we discuss our findings in light of our initial questions: • what does the visual mapping process entail?
• how do non-experts cope with the challenge of both developing and explaining their visualizations?
5.1 Unpacking the Visual Mapping Process
This study has revealed many details about the complexity and vari-ability of the visual mapping process. From these we identified 11 elementary tasks people performed when constructing and communi-cationg a visual representation of data (illustrated in Figure 5). We observed that people had similar general goals (construction, compu-tation and storytelling) which transferred into similar logical tasks and led to performing the same type of physical actions. Thus these appear to be a representative set of basic goals, tasks, and actions which pos-sibly generalize to other visual mapping processes and different data types. Further studies are necessary to determine generalizability.
other actions
5 min 10 min 15 min 20 min 25 min
1 2 3 4 6 7 8 9 10 11 12 rotate align split merge assign optimize organize create move
Task: construct a visualization
5.2 Bottom-up and Top-down Procedures
Performed actions combined and recombined differently across partic-ipants. As illustrated by Figure 14, we observed no specific pattern for the exact sequence of actions among the participants. Each participant had their individual process going back and forth between different types of actions throughout the creation process. Still, we did observe two distinct types of procedures. The most common one (10/12) con-sisted of starting from a single data case, then building progressively towards defining higher level structures, e.g., an axis. In the other case, people started by defining the dimensions and axis first and then pop-ulated them with data. We call the former a bottom-up procedure and the latter a top-down procedure (2/12).
In contrast to our observations, a large part of currently available commercial software tools enforce some form of workflow to guide people through the visualization authoring process. For example, many existing tools for non-experts are based on the use of pre-existing templates. People have to decide early on which template to pick. If their data is compatible, they might be able to switch between different templates, but usually no fluent transitions exist between different tem-plates, and people need to re-orient themselves again after a change of visualization technique / template.
With the constructive approach as used in this study, people were free to rearrange constructs as they wished. We hypothesize that any rearrangement action leaves their interpretation and understanding in-tact – at least as long as their constructs are not destroyed during the rearrangement. However, further studies are needed to investigate pos-sible effects of tool imposed authoring procedures.
5.3 The Ease of Constructing Visual Mapping
Previous work seems dichotomized on the ease of defining visual mappings – some emphasized their difficulty [26] while others show counter examples [14]. A relevant question for the accessibility of in-fovis authoring tools in general is what makes one situation easier to master than another. Taking inspiration from the way mathematics is taught to pre-school children in kindergarten [11, 50], we wondered whether the same tools would also facilitate non-expert adults in cre-ation of visualizcre-ations and in understanding of the underlying data.
Overall, none of the participants showed difficulty in creating their first visual representation. It took them less than 30 seconds to build a first construct. Most of the participants (10/12) declared that they would use a similar technique in the future. One of them said that she had already used a similar approach with real coins to plan future expenses. She explained: “A coin of 1 C equals 100 C [. . . ] I do that when I have big expenses to plan. I make a summary of the last 6 months [. . . ] It helps me to make abstract things concrete [. . . ] When I see the number 125 I absolutely don’t know what it represents. Here we can see the [. . . ] relation between expenses”.
We believe that the tangible properties of our constructive author-ing method afforded a more explicit visual mappauthor-ing process that could emerge as a result of manipulating visual constructs. As opposed to common authoring tools, no early decisions on visualization tech-niques were necessary to get started. However, the pre-defined initial token value definition could have played a role here, and participants might have had more problems developing their visual mapping had they been completely free in their choice of token value.
As mentioned previously, the only barrier we observed and on which participants commented was the initial transformation from the data domain to the tangible and visual domain. We deliberately chose a data value to token mapping that was non-trivial (as opposed to sim-ple mappings such as 1 token∼ 100) and required a little compu-tation. Our interest here was to observe whether participants would transfer such computations as early as possible into the tangible/visual domain, e.g. by counting up in steps of 25 while accumulating tokens, or whether they would perform this transformation mentally (divide data value by 25) and then grasp the corresponding amount of tokens. This study demonstrates the use of complementary strategies [37] as part of constructive processes for visualization purposes.
5.4 The Richness of Visual Mappings
While some participants simply recreated well-known visualizations such as bar charts, others developed unexpected diverse visual map-pings. We observed that some participants – after starting with a stan-dard design – subsequently customized their visual mappings to better fit their particular question, e.g., see the total spending per month, or to perceptually optimize, e.g., use cool colors for essential expenses and warm colors for life style related ones. Others strove for more visu-ally compact representations which even led one participant to create a horizon graph representation [45] (Figure 8–3).
Overall we find that even though most of the visualizations resem-ble common chart types, they were customized by their creators to fit their specific interest. Furthermore, many people made use of the constructive properties – effortless manipulation of constructs – for storytelling purposes to support their argument during the interviews.
5.5 Internalization of Data to Token Mappings
We were interested in how far participants internalized the data to to-ken mapping. During the interview, we observed participants speaking interchangeably about tokens and data while making enclosing or de-limiting gestures, and while pointing to tokens. To inquire further, we systematically asked them two questions: (Q1)“What did you ma-nipulate during your construction process ?”, and, depending on their answer: (Q2) “What was the value (or meaning) of [the declared ob-ject]?”, by replacing “[declared object]” with their reply to Q1.
Most participants were nonplussed by this question and sometimes asked the facilitator to refine the question. Then, most of them replied to Q1 by referencing first the object and then the data (6/12 P.). Two replied with only the data or first the data and then the object. Four other participants (4/12 P.) spoke only about the object for Q1, and then spoke about the data for Q2. Some of them also used other words than “data” such as “numbers”, “unit”, or “expenses”, and for tokens, some used “wooden tiles” or “little colored squares”.
Even though the data collected came from a small population sam-ple, and more research is needed to generalize our findings, we identify a clear awareness of participants for a tight coupling between the data and their tangible proxy, the wooden tiles. This coupling is so tight that the majority stated they manipulated “an object coupled to data” and used words such as “represent”.
6 LIMITATIONS
This study is a first attempt to unpack how people create visual repre-sentations. However, a single study cannot answer all open questions about this process and is necessarily limited by several factors, which require further investigation. We discuss limitations due to (i) proper-ties of the tangible tokens, (ii) our study protocol, and (iii) our method. Tangible tokens. While the aim of this study was to remove possible tool biases introduced by specific authoring tools, our use of tangible tokens possibly introduced biases of its own. First, the physical prop-erties of the tiles we provided as tokens limited the range of possible visual representations. We chose these wooden tiles since their use is already established as a suitable tool to teach simple mathematics to kindergarten children. Their flat design certainly limited the range of possible encodings and possibly suggested the creation of 2D rep-resentations. Still, for this first study we chose fluency of handling over expressiveness of tools. Furthermore, most screen-based visu-alizations are two-dimensional, hence we aimed to avoid introducing biases through construction with tools that suggest the creation of 3D structures. The variety of visual representations (see Figure 4) illus-trates that the available tools were sufficiently expressive to support a range of different visual representations.
Study protocol. Our study protocol could also have introduced some limitations. The initial instructions primed participants that “with numbers, changes are difficult to see over time”. Still, this motiva-tional remark did not uniformly lead to equivalent visual mappings (category to color and time spatially encoded). For instance, partic-ipants 3 & 5 chose not to represent time and aggregated over time throughout the entire study, while participant 4 did so initially but then changed for task B to encode time spatially. Concerning the category
to color mapping, we also observed aggregations, i.e., assigning the same color to different categories, as described in subsection 4.2. Our study design did not allow us to determine whether our instructions or previous exposure to visualizations had a larger influence on the cre-ated designs. Another limitation for the possible mappings was due to the pre-defined token–to–data unit mapping (1 token∼ 25). To avoid awkwardness in data manipulation, we rounded expenses to be multi-ples of 25. Such rounding of data values is not generalizable. More accurate mappings such as 1 token∼ 1 would increase the accuracy of the visualization but also require much larger numbers of tokens. Method. While we report on rich data about the visual mapping pro-cess, where people transform data to visual representations, our under-standing stops short of their internal processing. Our data provided us with verbal reports and videos of their actions. Thus we have evidence of the result of their thinking process and the resulting intermediate steps. It is from the combination of evidence of these individual steps with participants’ self-reports that we have assembled the visual rep-resentational mapping process described in this article.
Generalizability. This study is a qualitative observation of token based visualization construction by non-experts and offers detailed ob-servations that reveal phenomena and behaviors within this process. This first step in the unpacking of visual mapping can be extended with other studies such as examining: (i) different mapping processes, (ii) other types of authoring tools, and (iii) different token type and mate-rials that may well support other types of actions. However our study shows that non infovis experts did create valuable visual mappings without encountering the same barriers previously observed with soft-ware authoring tools [26]. Thus, while our study is limited in its gen-eralizability, our results do suggest that creating environments where people can assemble their visualizations from data-linked tokens may be beneficial and merits further investigation.
7 IMPLICATIONS FORRESEARCH ANDDESIGN
This study’s main contribution to visualization is an initial opening of the black box generally termed visual mapping in the infovis pipeline. The study reveals many processes that are internal to this step and in-vites further explorations that will continue to unpack these processes. It also demonstrates that our participants were readily capable of con-structing visual representations with this particular tangible environ-ment. Our study results also suggest several design implications to further the democratization of infovis authoring tools with associated implications for on-going research.
1. Supporting different construction procedures: Most visualiza-tion authoring software requires first choosing a visualizavisualiza-tion tech-nique and then the data dimensions to visualize. This can be seen as a top-down procedure: the visualization model needs to be selected be-fore any data can be seen visually. In contrast, our study environment provided the opportunity to build visualizations bottom-up by manip-ulating a small part of the dataset and gradually defining an assembly model. With such an approach, data is visible from the very beginning, and the visualization model develops iteratively during construction.
Open research questions: How do different visualization authoring
procedures impact the understanding of data? How does a bottom-up procedure transfer to different data types and tasks? What are the limits of a bottom-up procedure? How can we assure correctness of the result? Does this affect people’s confidence in their constructions? 2. Exploiting processing fluency: Processing fluency is the “the sub-jective experience of ease with which people process information” [6]. The method we used was originally designed 200 years ago to teach mathematics to non-literate kindergarten children [11]. The original intent for such a method was to simplify the way children can cogni-tively process abstract and complex ideas such as mathematics. Our work suggests now that people without skills in infovis can construct useful visual representations for themselves when offered a method with for which they already possess fluency. However, our study does not separate between the constructive and tangible aspects of the tool.
Open research questions: How do our results transfer to systems
which are constructive but lack the tangible aspect? Would a con-structive authoring tool implemented on an interactive touch surface
provide similar benefits? How can we transform more complex info-vis techniques into more fluent ones?
3. Tangible design: The physical affordances of tokens likely af-fected people’s actions and their visual designs. While the wooden tiles used in our study could be piled, participants found them slippery and mostly created 2D designs. Constructs were also easily destroyed during moving actions and required optimization actions afterwards. However, participants frequently moved constructs around using mul-tifinger and bimanual gestures (cf. Figure 14). Such actions could be further simplified through “sticky edges” of tokens. Other materials such as Lego bricks would facilitate stacking and might have led to more 3D encodings. Materials with programmable properties [23, 16] also seem promising for constructive visualization purposes.
Open research questions: Which material properties are most salient
in their effect on constructive strategies? Which properties are most ef-fective? How would the increased complexity of programmable prop-erties affect people’s proficiency with physical objects?
8 CONCLUSIONANDFUTUREWORK
In this paper we presented an observational study designed to help us learn more about the visual mapping process and to explore the suitability of the approach of constructive authoring of visualizations for non-experts. More specifically, we provided our participants with a simple environment in which they could build visualizations out of colored wooden tiles. We asked them, in the context of helping a friend with his budget, to create a visualization, to update it with new data and to explain their visualization to their friend via notes and annotations. By observing their activities, we deconstructed the visual mapping process into three high level activities: construction, computation and storytelling. These were composed of several logical tasks: load data, build constructs, combine constructs, extend, correct, aggregate, cate-gorize, compute new values, and unitize. The storytelling component was composed of highlighting and marking. These logical tasks were achieved by performing finer level actions as detailed in Section 4. From this study our main contributions are:
• An initial exploration of details of the logical tasks and actions pre-viously simply considered as a black box that was called the visual mapping process.
• A model of the visual representation mapping process that de-scribes the actions, their purposes and the interplay between them. • The observation of high diversity in the sequence of process ac-tions, indicating that while people used the same actions they did not adhere to the same sequencing.
• That in this tangible constructive environment non-experts were readily able to construct, update, and explain their own visual rep-resentations in a short period of time.
Our implications for the design of non-expert digital and tangible authoring tools indicate that more research towards supporting both bottom-up and top-down procedures to visualization authoring would be beneficial. We suggest that the ease with which non-experts created visualizations in this tangible environment might be, at least in part, due to the possibility of seeing the visual constructs develop during the assembly process. This opens new research questions such as: (i) providing better tangible visualization construction environments; (ii) creating digital visualization construction environments; and (iii) further studying the visual mapping processes themselves.
9 ADDITIONALMATERIAL
Additional material collected during the study is available on the project web page1. This includes high resolution photographs of all created visualizations, and excerpts from the videos.
10 ACKNOWLEDGMENTS
We would like to thank Jennifer Payne and Kyle Hall, the CRI and Fabelier. This research was supported in part by ANRT CIFRE (2010/1534), AITF, NSERC, GRAND, Surfnet, and SMART Tech-nologies.
REFERENCES
[1] Google Chart Editor.Last access: 10 Dec. 2013. https://support. google.com/drive/answer/63824.
[2] SpotFire.Last access: 10 Dec. 2013.http://www.spotfire.com. [3] Tableau Public. Last access: 23 March 2014. http://www.
tableausoftware.com/public.
[4] Tableau.Last access: 12 July 2013.http://www.tableausoftware. com.
[5] D. F. M. M. Alex Bigelow, Steven Drucker. Reflections on how design-ers design with data. In Proc. of the ACM International Conference on Advanced Visual Interfaces (AVI). ACM, 2014.
[6] A. L. Alter and D. M. Oppenheimer. Uniting the tribes of fluency to form a metacognitive nation. Personality and Social Psychology Review, 13(3):219–235, 2009.
[7] C. Andrews, A. Endert, and C. North. Space to think: large high-resolution displays for sensemaking. In Proceedings of the SIGCHI Con-ference on Human Factors in Computing Systems, pages 55–64. ACM, 2010.
[8] R. Arnheim. Visual thinking. UofC Press, 1969.
[9] J. Bertin. S´emiologie graphique. Mouton; Paris: Gauthier-Villars, 1973. [10] M. Bostock, V. Ogievetsky, and J. Heer. D3 data-driven documents. IEEE
TVCG, 17(12):2301–2309, 2011.
[11] N. Brosterman, K. Togashi, and E. Himmel. Inventing kindergarten. 1997.
[12] S. K. Card, J. D. Mackinlay, and B. Shneiderman. Readings in informa-tion visualizainforma-tion: using vision to think. Morgan Kaufmann, 1999. [13] M. S. T. Carpendale. A framework for elastic presentation space. PhD
thesis, Simon Fraser University, 1999.
[14] W. O. Chao, T. Munzner, and M. van de Panne. Poster: Rapid pen-centric authoring of improvisational visualizations with napkinvis. Posters Com-pendium InfoVis, 2010.
[15] W. Cleveland and R. McGill. Graphical perception: Theory, experimen-tation, and application to the development of graphical methods. Journal of the American Statistical . . ., 1984.
[16] CMU & Intel Research. Claytronics video. tinyurl.com/claytronics, 2006. [accessed 2013-03-30].
[17] L. Cosmides and J. Tooby. Are humans good intuitive statisticians after all? rethinking some conclusions from the literature on judgment under uncertainty. cognition, 58(1):1–73, 1996.
[18] J. W. Creswell. Qualitative inquiry and research design: Choosing among five approaches. Sage, 2012.
[19] S. Douglas, C. Hundhausen, and D. McKeown. Toward empirically-based software visualization languages. In Visual Languages, Proceed-ings., 11th IEEE International, pages 342–349. IEEE, 1995.
[20] J. Fekete. The infovis toolkit. In Information Visualization, 2004. INFO-VIS 2004. IEEE Symposium on, pages 167–174, 2004.
[21] F. W. Froebel. The education of man. New York: D. Appleton & Com-pany (Original work published 1826), 1887/1974.
[22] D. Gabel and R. Sherwood. The effect of student manipulation of molec-ular models on chemistry achievement according to piagetian level. Jour-nal of Research in Science Teaching, 17(1):75–81, 1980.
[23] K. Gilpin, A. Knaian, and D. Rus. Robot pebbles: One centimeter mod-ules for programmable matter through self-disassembly. In IEEE Inter-national Conference on Robotics and Automation (ICRA), pages 2485– 2492. IEEE, 2010.
[24] J. D. Gobert and J. J. Clement. Effects of student-generated diagrams ver-sus student-generated summaries on conceptual understanding of causal and dynamic knowledge in plate tectonics. Journal of research in science teaching, 36(1):39–53, 1999.
[25] L. Grammel, C. Bennett, M. Tory, and M.-a. Storey. A Survey of Visu-alization Construction User Interfaces. In EuroVis-Short Papers, pages 19–23. The Eurographics Association, 2013.
[26] L. Grammel, M. Tory, and M. Storey. How information visualization novices construct visualizations. IEEE TVCG, 16(6):943–952, 2010. [27] T. R. G. Green and M. Petre. Usability analysis of visual programming
environments: a cognitive dimensions framework. Journal of Visual Lan-guages & Computing, 7(2):131–174, 1996.
[28] J. Heer, S. K. Card, and J. A. Landay. Prefuse: A toolkit for interactive information visualization. In Proc. of the SIGCHI, CHI ’05, pages 421– 430, NY, USA, 2005. ACM.
[29] J. Heer and B. Shneiderman. Interactive dynamics for visual analysis. Queue, 10(2):30:30–30:55, 2012.
[30] M. Hegarty. The cognitive science of visual-spatial displays: Implications for design. Topics in Cognitive Science, 3(3):446–474, 2011.
[31] S. Huron, S. Carpendale, A. Thudt, A. Tang, and M. Mauerer. Construc-tive Visualization. In ACM conference on Designing InteracConstruc-tive Systems in 2014, Vancouver, Canada, June 2014.
[32] S. Huron, R. Vuillemot, and J.-D. Fekete. Towards Visual Sedimentation. In IEEE, editor, VisWeek 2012, Seattle, USA, 2012.
[33] S. Huron, R. Vuillemot, and J.-D. Fekete. Visual sedimentation. IEEE TVCG, 19(12):2446–2455, 2013.
[34] Y. Jansen and P. Dragicevic. An Interaction Model for Visualizations Beyond The Desktop. IEEE TVCG, 19(12):2396 – 2405, 2013. [35] H.-C. Jetter, J. Gerken, M. Z¨ollner, H. Reiterer, and N. Milic-Frayling.
Materializing the query with facet-streams: a hybrid surface for collabo-rative search on tabletops. In Proceedings of the SIGCHI Conference on Human Factors in Computing Systems, pages 3013–3022. ACM, 2011. [36] C. Johnson, R. Moorhead, T. Munzner, H. Pfister, P. Rheingans, and T. S.
Yoo. NIH/NSF visualization research challenges report. Los Alamitos, CA: IEEE, 2006.
[37] D. Kirsh. Complementary strategies: Why we use our hands when we think. In Proceedings of the Seventeenth Annual Conference of the Cogni-tive Science Society, pages 212–217. Lawrence Erlbaum Associates Mah-wah, NJ, 1995.
[38] D. Kirsh. The intelligent use of space. Artificial intelligence, 1995. [39] S. Klum, P. Isenberg, R. Langner, J.-D. Fekete, and R. Dachselt.
Stack-ables: combining tangibles for faceted browsing. In Proceedings of the International Working Conference on Advanced Visual Interfaces, pages 241–248. ACM, 2012.
[40] J. Manning. Rediscovering Froebel: A call to re-examine his life & gifts. Early Childhood Education Journal, 2005.
[41] D. Marr. Vision: A computational approach. San Francisco: Free-man & Co, 1982.
[42] L. Micallef, P. Dragicevic, and J.-D. Fekete. Assessing the Effect of Visu-alizations on Bayesian Reasoning Through Crowdsourcing. IEEE TVCG, 18(12):2536 – 2545, 2012.
[43] Z. Pousman, J. Stasko, and M. Mateas. Casual information visualization: Depictions of data in everyday life. IEEE TVCG, 13(6):1145–1152, 2007. [44] C. Reas and B. Fry. Processing: a programming handbook for visual
designers and artists, volume 6812. Mit Press, 2007. [45] H. Reijner et al. The development of the horizon graph. 2008.
[46] J. M. Rzeszotarski and A. Kittur. Kinetica: Naturalistic multi-touch data visualization. 2013.
[47] D. Schmandt-Besserat. How writing came about. University of Texas Press Austin, 1996.
[48] K. J. Sch¨onborn and T. R. Anderson. The importance of visual literacy in the education of biochemists*. Biochemistry and Molecular Biology Education, 34(2):94–102, 2006.
[49] F. M. Shipman III, H. Hsieh, P. Maloor, and J. M. Moore. The visual knowledge builder: a second generation spatial hypertext. In Proceedings of the 12th ACM conference on Hypertext and Hypermedia, pages 113– 122. ACM, 2001.
[50] P. Tarr. Pestalozzian and Froebelian Influences on Contemporary Ele-mentary School Art. Studies in Art Education, 30(2):115–121, 2013. [51] B. Ullmer, H. Ishii, and R. J. K. Jacob. Token+constraint systems for
tangible interaction with digital information. ACM TOCHI, 12(1):81– 118, 2005.
[52] B. Victor. Drawing Dynamic Visualizations Talk.Last
ac-cess: 12 July 2013. http://worrydream.com/#!
/DrawingDynamicVisualizationsTalk.
[53] F. Viegas, M. Wattenberg, F. van Ham, J. Kriss, and M. McKeon. Manyeyes: a site for visualization at internet scale. IEEE TVCG, 13(6):1121–1128, 2007.
[54] J. Walny, S. Carpendale, N. Riche, G. Venolia, and P. Fawcett. Visual thinking in action: Visualizations as used on whiteboards. IEEE TVCG, 17(12):2508–2517, 2011.
[55] J. Walny, B. Lee, P. Johns, N. Riche, and S. Carpendale. Understanding pen and touch interaction for data exploration on interactive whiteboards. IEEE TVCG, 18(12):2779–2788, 2012.
[56] C. Ware. Information visualization: perception for design. Elsevier, 2004.
[57] J. S. Yi, R. Melton, J. Stasko, and J. A. Jacko. Dust & magnet: multivari-ate information visualization using a magnet metaphor. IV, 4(4):239–256, 2005.
![Fig. 2. The extended visualization reference model [34], adapted to our terminology.](https://thumb-eu.123doks.com/thumbv2/123doknet/14578483.540532/3.918.72.438.270.441/fig-extended-visualization-reference-model-adapted-terminology.webp)