Three Essays on the Role of Federalism in the
Swiss Healthcare System
Paola Salari
Faculty of Economics Università della Svizzera Italiana(Lugano, Switzerland)
A thesis submitted for the degree of Doctor of Philosophy in Economics
Lugano, March 2015
Doctoral committee:
Prof. Luca Crivelli, Università della Svizzera Italiana (Lugano), Internal member Prof. Fabrizio Mazzonna, Università della Svizzera Italiana (Lugano), Supervisor Prof. Eddy van Doorslaer, Erasmus University (Rotterdam), External member
Acknowledgements
I would like to express my gratitude and appreciation to the people who made this thesis possible with their guidance and support.
I am grateful to my supervisor, Professor Luca Crivelli, for having offered me the opportunity to do this Ph.D. and to work with him. I particularly thank him for his patience, and for his genuine passion and contagious enthusiasm he shows in everything he does. I would also thank him for introducing me to the world of the health economics – that some years ago was almost unknown to me – and also for his encouragement during the whole Ph.D. and comprehension during the most difficult moments.
I am grateful to my co-supervisor, Professor Fabrizio Mazzonna for his guidance during the last year of Ph.D. I would have not been able to bring my work to a successful completion without his confident support and his precious and helpful suggestions. I particularly appreciated his rigor in doing research and his mentorship in the methodological aspects of the thesis.
I am grateful to Professor Eddy van Doorslaer, for taking the time to read my thesis and to be part of my thesis committee. I appreciated his helpful suggestions and constructive comments.
Finally, a special word goes to all my colleagues at IdEP, for being part of my Ph.D. life. I would like to thank them all – “veterans” and new entries – for sharing together all the successes and failures, ambitions and fears, bad and good times.
Introduction
Switzerland is a country with a strongly decentralized political system, based on federalism and institutions of direct democracy, on a liberal economic culture, and on a well–developed tradition of mutualism and social security (generous social expenditure and welfare system). Switzerland is unique for its high level of decentralization and for the particular distribution of competences and roles between the central State (the Confederation) and the cantonal authorities. This particular setting allows cantons to have significant leeway in the organization of health care and the implementation of specific public policies.
My thesis aims to give a contribution to the health economics literature, assessing some of the internal implications of the Swiss federal setting in the health care sector (chapters 1 and 2) and drawing some more general public policy results, exploiting the Swiss context (chapter 3).
The first two chapters explore two different sides of the equity of the Swiss health care system. In the first chapter, I assess to what extent the political autonomy allocated to cantons leads to differences in the level of regressivity in the financing of the health care system and over time. The second chapter investigates the role of managed care contracts and higher deductible on the equity in health care utilization. Finally, in the third chapter I carry out a policy evaluation analysis to assess the causal effects of smoking bans on acute myocardial infarction. Different from the other two chapters, this work draws conclusions that abstract from the Swiss context. Switzerland is the perfect setting where to employ our empirical strategy, due to the different times of implementation of the policy if interest. However, the results have external validity.
Each work is based on a different database: the first and the third are based on administrative data, while the second one relies on survey data.
The first chapter, “The inequity of the Swiss health care system financing from a federal state perspective” (with Luca Crivelli) focuses on the equity issue in the health care system financing. It aims to detect differences at the cantonal level. In previous studies the Swiss health care financing results as particularly regressive. However, the currently available information does not allow to monitor income-related inequities in financing health care across cantons. This study aims at filling this information gap exploring the differences and the level of regressivity
fiscal federalism. In the first part of the study, I describe the different strategies adopted by the cantons to finance health care, looking at how much financing relies on private resources and how much on public ones. In the second part, I use the Kakwani index as a summary measure of regressivity. I compute it for each canton and for each of the sources that have a role in financing the health care system, i.e. the taxes, both at federal (including VAT) and cantonal level, the net premiums (after subtracting possible subsidies), and other social contributions. I graph concentration curves and perform relative dominance tests, which utilize the full distribution of expenditures. The microdata comes from the “Swiss Household Income and Expenditure Survey” based on a sample of the Swiss population (about 3500 households per year), for the years 1998–2005. The empirical evidence confirms that the Swiss health care system financing has remained quite regressive since the major reform of 1996 and shows that the variations in equity across cantons are quite significant: the difference between the most and the least regressive canton is about the same as between two extremely different financing systems like the US and Sweden. There is no evidence, however, of a clear evolution of regressivity over time. The significant variation in equity across cantons can be explained by fiscal federalism and the related autonomy in the design of tax and social policies. In particular, the results highlight that earmarked subsidies, the policy adopted to smooth the regressivity of the premiums, appear to be not enough.
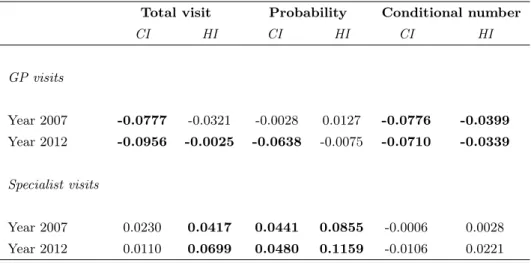
The second chapter, “Equity in the Swiss health care system: the role of managed care and higher deductible”, investigates on a different side of equity: the equity in the access to health care services. The goal of this study is to analyze empirically the impact that alternatives forms of insurance, namely managed care and higher deductible, may have on the equity in health care utilization. I compute concentration indices for the distribution of visits to GP and to the specialist for the years 2007 and 2012. I use the two last waves of the “Swiss Health Survey”, a specific survey addressing health issues on a sample of the Swiss population (about 20000 individuals per wave). I compute the need–standardized level of health care for the total number of visits, for the probability to see a doctor and for the conditional number of visits. The results suggest not only that specialist visits are pro–rich distributed, in line with previous literature, but also that the pro–rich inequity worsened over time. By contrast, no pro–rich inequity emerges in GP visits. I also perform a decomposition analysis (on the total probability of a specialist visit), to disentangle the contribution of each source of inequity. The findings suggest that the choice of a higher deductible acts as an entrance barrier for insured, as expected. Nevertheless, being this option more widespread among the better–off, this barrier prevents from going to the specialist more people belonging to the middle–rich income class. This study reveals that a high deductible seems to have two positive effects. First, it rebalances the concentration of visits towards a smaller pro–rich inequity and second, it discourages moral hazard behaviors. On the
contrary, the analysis does not find any contribution to inequality due to being enrolled in a managed care plan, neither in 2007, or 2012.
In the third chapter, “Short terms effects of public smoking bans oh health” (with Fabrizio Mazzonna) I perform an empirical application aimed at assessing the causal effect of the public smoking bans on a health outcome, namely the acute myocardial infarction (AMI). Since a reduction in the AMI cases should be quantifiable immediately after the introduction of the smoking ban, focusing on AMI allows to measure the short-run effects of the policy on an objective metrics of health. I use a quasi-experiment, consisting in the fact that cantonal authorities implemented the same policies in different times, as allowed by the Swiss federalism. I exploit time and geographical variation in the implementation of the policy to provide evidence of a causal association between the policy and the health outcome of interest. Data come from the “Medical Statistics of Hospitals” a wide dataset that collects information on every patient for every Swiss hospital from 1999 to 2012, provided by the Swiss Federal Statistical Office. The results suggest that the effect of smoking ban globally reduced the number of AMI of about 7.5–10% percentage points. The effect seems to be stronger for men between 50 and 65 years old, showing a reduction in the number of AMI of about 15%, and for women over 66. Results are robust to alternative model specifications. The advantage of focusing on smoking bans is twofold. On one hand, it allows us to assess a causal relation of smoking (both active and second-hand smoke) on short-run health effects. On the other second-hand, assessing the efficacy of this policy measure on health outcomes offers an interesting contribution in the debate on the effectiveness of smoking bans on health.
Contents
1 The inequity of the Swiss health care system financing from a federal state
perspective 1
1.1 Introduction . . . 1
1.2 Literature review . . . 3
1.3 Swiss health system financing . . . 5
1.3.1 General framework . . . 5
1.3.2 Evidence of heterogeneity at the cantonal level . . . 7
1.4 Dataset . . . 9
1.5 Methods: Kakwani index, concentration curves and dominance test . . . 10
1.6 Results . . . 12
1.7 Discussion: lessons for a federal state . . . 19
1.8 Conclusions . . . 21
2 Equity in the Swiss health care system: the role of managed care and higher deductible 26 2.1 Introduction . . . 26
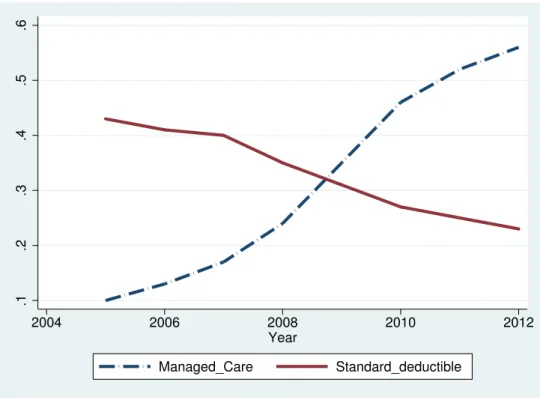
2.2 Recent trends in the Swiss health care system . . . 29
2.3 Methods: the estimation of inequity in health care services utilization . . . 34
2.4 Dataset . . . 38
2.5 Results . . . 39
2.6 Conclusion . . . 46
3 Short term effects of public smoking bans on health 51 3.1 Introduction . . . 51
3.2 Swiss institutional setting . . . 55
3.3 Data . . . 56
3.3.1 Descriptive statistics and graphical evidence . . . 59
3.4.1 Identification issues . . . 64
3.5 Results . . . 66
3.5.1 The effect of smoking ban on AMI . . . 66
3.5.2 How did the smoking ban reduce AMI incidence? . . . 72
3.5.3 Robustness checks . . . 75
List of Figures
1.1 Concentration curves for each financing source, canton Geneva. . . 17 1.2 Average incidence of the socialized health expenditure on income, Zug (left) and
Geneva (right). . . 20
2.1 The trends of managed care contracts and standard deductible, from 2005 to 2012. 31
3.1 Discontinuity in AMI hospital admissions after the smoking ban by sex . . . 61 3.2 Discontinuity in AMI hospital admissions after the smoking ban by sex (residuals) 62
List of Tables
1.1 Main papers about equity in the health-care financing system . . . 3
1.2 Socialized health expenditure – Absolute value (2005) and share of each financing source (average 1998-2005) . . . 8
1.3 Kakwani index over time . . . 13
1.4 Kakwani index across cantons . . . 15
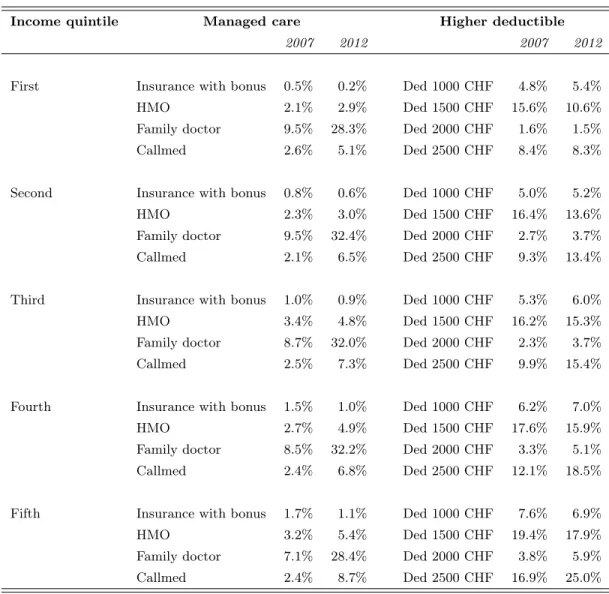
1.5 Cumulative shares of income and health payments by income decile, canton Geneva 18 2.1 Share of managed care and higher deductible for income quintiles. Years 2007 and 2012. . . 32
2.2 Inequality (CI) and inequity (HI) in GP and specialist visits for Switzerland. Years 2007 and 2012. . . 40
2.3 Inequality (CI) and inequity (HI) in GP and specialist visits for the three linguistic areas. Years 2007 and 2012 . . . 42
2.4 Marginal effects from a probit regression on the probability of a specialist visit and results from decomposition analysis. Years 2007 and 2012. . . 44
3.1 Implementation of smoking bans (SB) in the Swiss cantons . . . 57
3.2 Average number of AMI hospitalizations per month at cantonal and regional level and incidence per 100’000 inhabitants, by age and sex . . . 60
3.3 Effect of public smoking ban on AMI incidence, by sex . . . 67
3.4 Strictness of the law: mild vs. severe law . . . 68
3.5 Effect of public smoking ban on AMI incidence, by age and sex . . . 69
3.6 Heterogeneity by income and education . . . 70
3.7 Smoking prevalence, cigarettes consumption and ETS exposure (minutes per day), by age and survey year . . . 73
3.8 Going to bar, pub and restaurant, by age and sex . . . 74 3.9 Smoking prevalence, cigarettes consumption and ETS exposure (minutes per day),
3.10 Unconfoundness test: effect of the ban on the incidence of lung, prostate and
breast cancer . . . 76
3.11 Placebo test . . . 77
3.12 Seasonal heterogeneity . . . 77
Chapter 1
The inequity of the Swiss health care
system financing from a federal state
perspective
Published as:
Crivelli L. and Salari P., 2014. “The inequity of the Swiss health care system financing from a federal State perspective”. International Journal for Equity in Health, 13:17.
Keywords
Switzerland, equity, health care system financing, fiscal federalism.
1.1
Introduction
The idea that health-care services should be paid for according to the ability to pay rather than according to the actual use of the health-care system finds its roots in the egalitarian concept of social justice and is generally adopted in Switzerland, as it is in most of the OECD countries. It is common in the economic literature to indicate this idea using the concept of equity in financing (Wagstaff et al., 1989). This principle implies not only a form of solidarity between the sick and the healthy, which is implicit in any health insurance system, but also solidarity between rich and poor. In this context, two measures of equity exist. The first is “horizontal equity”, which claims equal treatments for equals; i.e., that people with the same income have to contribute the same amount of money to the total expenditures. The second measure is “vertical equity”, which states that people with different income must contribute appropriate amounts to the total
All of the empirical studies on this topic measure the equity of a financing source in terms of progressivity; i.e., the extent to which higher-income people pay more as a proportion of their income than lower- income people.
When the new Health Insurance Act (HIA) came into force in 1996, many things changed in the Swiss health-care system. The main objectives of the act were to guarantee universal coverage, to establish a fair competition among health insurers and to equip the political system with better cost containment tools. Moreover, it also increased the importance of the financing equity aim: one of the objectives of the reform was to provide monetary assistance to low-income households in order to increase equity of financing. In the federal draft bill issued in the year 1991 (and approved some years later after many amendments as HIA) we can read that: The main priority of the project is undoubtedly the strengthening of solidarity. The current law provides for individual premiums to be paid without taking into account the economic situation of the people insured (p.67). In order to make this payment affordable for all citizens, the new law replaced the historically grown system of general state transfers to health insurance with a better endowed and more equitable system of allowances targeted to low-income households.
At present the health insurance in Switzerland is mandatory for every citizen, and it is based on community-rated premiums. The confederation jointly with cantons assigns a budget cap for earmarked subsidies targeting low-income households. Cantons have a great autonomy in deciding the distribution of subsidies; despite their role of mitigating vertical inequity, the heterogeneity of cantonal subsidy policies leads to a different treatment of similar households across cantons (horizontal inequity). As subsidies vary with cantons, people with the same income living in different cantons may pay a different amount of money for health care.
Some studies have demonstrated that the general level of health system financing is regressive in Switzerland, both before and after the reform (Bilger, 2008; Wagstaff et al., 1999). This means that lower-income people pay more as a proportion of their income than higher-income people.
Nevertheless, these studies consider only the whole of Switzerland and no research has mon-itored the situation at the cantonal level. Due to the Swiss federal setting, each canton differs in the economic strategy it has adopted to finance the health care system; this leads to different levels of equity among them. The OECD Review of the Swiss Health System (OECD/WHO, 2011) considers the development of an information system able to monitor this inter-cantonal variation as one of the Swiss policy challenges for the future.
This paper aims to fill this information gap by analyzing the level of equity in the financing of the health-care system in the Swiss cantons. In this study we have used the methodology suggested by Wagstaff and Van Doorslaer (1992) to compute the regressivity level of each canton through the Kakwani index (Kakwani, 1977). The paper is organized as follows. The next section presents a review of the most relevant literature in this field. We have collected and summarized
similar studies conducted for other countries, as well as for all of Switzerland. Section 1.3 provides a brief explanation of Swiss health system financing. Section 1.4 introduces the dataset, section 1.5 explains the methodology used and section 1.6 the results obtained. Section 1.7 discusses the results in more detail and outlines the limitations of the study. Finally, section 1.8 offers some conclusions.
1.2
Literature review
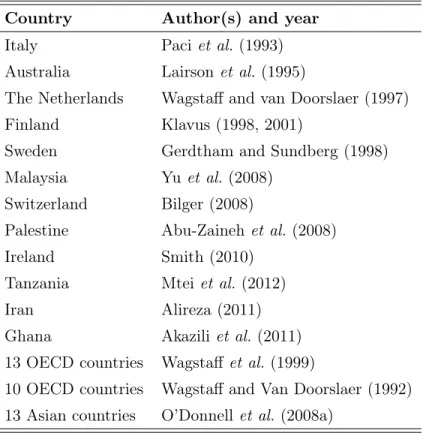
This work finds its place among the studies about the equity of health-care system financing. Table 1.1 includes the main papers that have been published on this topic. Some of them have focused on a single country - namely Australia, Iran, Finland, Italy, the Netherlands, Malaysia, Palestine, Ireland, Tanzania, Ghana, Sweden, and Switzerland. Two papers present an international comparison, based on 13 Asian countries and 13 OECD countries, respectively.
Table 1.1: Main papers about equity in the health-care financing system
Country Author(s) and year
Italy Paci et al. (1993)
Australia Lairson et al. (1995)
The Netherlands Wagstaff and van Doorslaer (1997) Finland Klavus (1998, 2001)
Sweden Gerdtham and Sundberg (1998) Malaysia Yu et al. (2008)
Switzerland Bilger (2008)
Palestine Abu-Zaineh et al. (2008)
Ireland Smith (2010)
Tanzania Mtei et al. (2012)
Iran Alireza (2011)
Ghana Akazili et al. (2011) 13 OECD countries Wagstaff et al. (1999)
10 OECD countries Wagstaff and Van Doorslaer (1992) 13 Asian countries O’Donnell et al. (2008a)
Smith (2010), Klavus (1998), Akazili et al. (2011), and Abu-Zaineh et al. (2008) analyzed the inequity in financing through the Kakwani index as well as through a “disaggregated approach”; the latter provides summary measures over specific income groups, by using the dominance test
Another different method consists of separating the redistributive effect into three parts: vertical, horizontal, and reranking effect. The works by Lairson et al. (1995) for Australia and Gerdtham and Sundberg (1998) for Sweden concentrate on this approach. Bilger (2008) adopted the same methodology in the case of Switzerland.
Many studies have analyzed the equity of health system financing at the national level, while very few studies have explored this issue at the subnational level. Abu-Zaineh et al. (2008) and Alireza (2011) extended the analysis by computing the Kakwani index for two different regions of a given country: the former included in the study the two regions of the Occupied Palestinian territory (i.e. the West Bank and the Gaza Strip) and the latter applied the Kakwani index to urban and rural areas of Iran. As far as Switzerland is concerned, the issue of the health-care system financing has been explored by Wagstaff and Van Doorslaer (1992); Wagstaff et al. (1999) and Bilger (2008). All three papers provide evidence in favor of highly regressive financing.
Wagstaff and Van Doorslaer (1992) presented an international comparison of health-care financing across 10 countries. The score of the Kakwani index for Switzerland was based on 1982 data and was significantly negative (-0.117). Moreover, the Swiss healthcare financing was the second most regressive, after the U.S. (Kakwani index of -0.145).
In 1999, the same authors, along with some others, updated their previous paper with more recent data. In line with their previous work, the analysis for Switzerland shows that the new Kakwani index, based on the data of 1992, is -0.1402. In ten years the inequity level of financing grew even worse.
Bilger (2008) provided another important contribution to the analysis of financing equity in Switzerland. For his analysis, he used the Swiss Household Income and Expenditure Survey (SHIES) of 1998, which contains data from 9295 Swiss households. He found evidence that health system financing in post-reform Switzerland remains very regressive. In particular, the paper concludes that the reform failed to reduce vertical inequity.
Starting from this strand of literature, the current paper aims to go a step further. The goal is to analyze the differences in the regressivity of the financing system at a sub-national level. Apart from the two previously noted exceptions (focusing on two regions of the same country), this is the first attempt to provide a systematic analysis of financing equity at the level of the single entities of a federal state (in this case, Switzerland at the cantonal level). Switzerland is an ideal country in which to add this new piece of evidence, as it can be set in a context of fiscal federalism, where the cantons have large freedom to decide on the financing sources for health care and in the design of the tax system (Kriesi et al., 2005).
1.3
Swiss health system financing
1.3.1 General framework
The Swiss health care system is based on a mixed private-social health insurance, and it is financed through several sources (in brackets the 2009 shares on the total health care costs): public expenditure (28%), mandatory health insurance (29%), general social insurances (6%), complementary health insurance (9%), co-payments and out-of-pocket (27%), other private (1%) expenses.
Public expenditure
Federal, cantonal and local authorities contribute to the health care system mainly in two forms:
• Direct subsidy of specific services (inpatient hospital care, nursing homes, home care), mostly paid by cantons, and payment of public health interventions (like prevention and health promotion).
• Indirect financing through earmarked subsidies for lower-income people who cannot afford mandatory health insurance, funded jointly by the Confederation and the cantons, and other means-tested allowances for specific target groups.
All these activities are financed through tax revenues: they include both direct and indirect taxes for the Confederation, mostly direct taxes for cantons and municipalities. In particular direct taxes consist of income taxes for the Confederation and both income and property taxes for cantons and municipalities.
Mandatory health insurance (MHI)
The health insurance in Switzerland, mandatory since the reform of 1996, consists of a monthly community rated premium that does not depend on the level of income. However, different premiums are set for two age-classes: lower premiums for children (age <19) and higher for adults. Moreover, insurers are free to grant a discount for students between 19 and 25. Health insurance is offered through a variable number of private nonprofit sickness funds (ranging from 118 in 1998, to 85 in 2005 and to the current number of 66 in 2012). It covers a comprehensive benefit basket fixed at the federal level. Coverage starts once the yearly deductible (minimum of 300 CHF, about 330 US$, in the standard contract) has been reached and includes a 10 percent copayment (up to a maximum amount of 700 CHF per year). People can opt for higher deductibles (up to 2500 CHF) and get in exchange a premium discount. Premiums are set at
community, whereas others (including urban and rural areas) are divided in two or three regions (the total number of premium communities declined between 1998 and 2005 from 78 to 43). As a consequence, premiums significantly differ across regions and cantons, reflecting the huge differences in health care expenditures. Significant variation exists also across health insurers (Ortiz, 2011), due in particular to a still ineffective risk adjustment mechanism (Beck et al., 2010). Horizontal equity across geographic communities is not guaranteed at all, since individuals with the same income pay significantly more or less depending on what premium region they are resident in. Moreover, not even horizontal equity within the same premium region can be completely achieved, due to competition in insurance market, switching decisions by consumers, different deductibles and the option to sign managed care contracts.
As mentioned before, for people earning an income under a certain threshold, the Confedera-tion and the cantons jointly fund earmarked subsidies that cover part or the total of the monthly premium (full coverage concerns in particular retired and disabled people receiving means-tested benefits).
General social insurances
This is Bismarckian insurance system designed to cover through in cash benefits other (non-health) risks like longevity, disability and accident. In some circumstances it provides also benefits through in kind health care services. It covers, in particular, spending for rehabilitation in case of disability and the health care costs in case of professional and non-professional accidents of employed persons.
Complementary health insurance
People can choose to pay a risk-rated premium (for individual contracts) or a community-rated premium (for collective contracts) to have a voluntary supplementary private health insurance. It covers some health-care services or inpatient hospital amenities that are not included in the compulsory benefit basket.
Out-of-pocket
The out-of-pocket expenses include the co-participation to costs (namely the deductible and the 10% co-payment) as well as all other health care expenses not covered in the general contract (e.g. nursing homes fees, dental care, OTC drugs, etc.).
Some of the financing strategy rules are decided at the federal level. However, Swiss federalism allows cantons to make their own decision regarding the exact design of the financing policy they want to adopt.
The cantonal scope of action can take several forms. Firstly, a different mixture of the financing sources chosen by each canton1 determines a different level of regressivity: cantons that rely more on the MHI than on public expenditure are more likely to be regressive than those that choose to finance the system more through general taxation. Secondly, cantonal autonomy due to fiscal federalism allows significant leeway in deciding the subsidies policy for the worse-off (Balthasar et al., 2008; Gilardi and Füglister, 2008; Kägi et al., 2012). Cantons are allowed to make their own decisions regarding the eligibility criteria for receiving benefits, which creates heterogeneity in their distribution and which leads to differences in the level of regressivity among cantons. Thirdly, each canton has significant leeway in the definition of the tax rates for income and property taxes, whereas each municipality decides every year the percentage of the cantonal tax liability to be paid as local taxes.
According to cantons’ choices, different equity (or inequity) levels are thus determined.
1.3.2 Evidence of heterogeneity at the cantonal level
Due to data availability problem, in the analysis that follows we are forced to rely only on the first three funding sources in the list, i.e. public financing, MHI and general social insurances. The part of financing that we are considering is called socialized health expenditure (SHE), since it reflects collective spending for the universally accessible basket of health care benefits. It accounts for approximately 60-65% of the total financing in Switzerland.
Hence, in our analysis, we will decompose SHE in four sources: federal taxes (including direct tax and VAT), cantonal and municipal taxes (henceforth we will refer to this second group of tax simply as cantonal tax), mandatory health insurance (computed as net premium, i.e. the difference between the privately paid premium and the earmarked subsidies), and general social insurances2.
The first column in Table 1.2 considers the amount of the SHE for each canton and for Switzerland as a whole in absolute per capita values for 2005. The second column shows the incidence of SHE on average disposable income.
The last four columns of Table 1.2 represent the proportion of the expenditure financed by each source. We computed these weights as an average for the considered period (1998-2005).
The first evidence from the table relates to the absolute level of expenditure which differs
1
E.g. until 2011 cantons had significant leeway in allocating the public financing to private hospitals. This has been changed by the new regulation of hospital financing that started in 2012.
2
The available data does not provide any information about the direct federal health expenditure given to each canton or the amount of health expenditure from the general social insurance spent in each canton. To compute these two values, we took the total amount of expenditure and simply imputed the same average spending for each Swiss inhabitant, regardless of the canton in which she/he lives. In the expenditure of the confederation and
Table 1.2: Socialized health expenditure – Absolute value (2005) and share of each financing source (average 1998-2005) SHE per capita (CHF) SHE as a share of average disposable income Sources of financing Federal taxes Cantonal and municipal taxes General social insurances Mandatory health insurance (net premiums) Zurich (ZH) 4198 6.66% 10.00% 29.00% 13.00% 48.00% Bern (BE) 4297 8.52% 11.00% 30.00% 13.00% 46.00% Lucerne (LU) 3461 7.19% 13.00% 25.00% 16.00% 46.00% Uri (UR) 3379 6.85% 13.00% 26.00% 16.00% 45.00% Schwyz (SZ) 3581 6.14% 13.00% 25.00% 15.00% 47.00% Obwald (OW) 3155 7.40% 14.00% 27.00% 16.00% 43.00% Nidwald (NW) 3385 6.21% 13.00% 27.00% 16.00% 44.00% Glarus (GL) 3541 8.01% 12.00% 30.00% 14.00% 44.00% Zug (ZG) 3885 5.15% 12.00% 30.00% 14.00% 44.00% Fribourg (FR) 3876 8.42% 12.00% 28.00% 14.00% 46.00% Solothurn (SO) 4002 7.78% 11.00% 26.00% 14.00% 49.00% Basel City (BS) 5854 9.31% 8.00% 39.00% 9.00% 44.00% Basel Land (BL) 4197 7.60% 11.00% 27.00% 13.00% 49.00% Schaffausen (SH) 4070 9.06% 11.00% 31.00% 13.00% 45.00% Appenzell O. Rhodes (AR) 3505 6.33% 13.00% 27.00% 16.00% 44.00% Appenzell I. Rhodes (AI) 2988 6.81% 16.00% 20.00% 19.00% 45.00% St. Gall (SG) 3465 6.76% 13.00% 24.00% 15.00% 48.00% Grisons (GR) 3837 7.18% 12.00% 29.00% 14.00% 45.00% Argovia (AG) 3575 6.60% 13.00% 20.00% 15.00% 52.00% Thurgovia (TG) 3204 7.10% 14.00% 19.00% 16.00% 51.00% Ticino (TI) 4852 9.66% 10.00% 29.00% 12.00% 49.00% Vaud (VD) 4858 9.01% 9.00% 30.00% 11.00% 50.00% Valais (VS) 3732 8.32% 12.00% 30.00% 14.00% 44.00% Neuchâtel (NE) 5017 10.44% 9.00% 33.00% 11.00% 47.00% Geneva (GE) 6578 10.10% 7.00% 43.00% 8.00% 42.00% Jura (JU) 4381 10.43% 10.00% 30.00% 12.00% 48.00% Switzerland (CH) 4243 7.85% 11.00% 29.00% 13.00% 47.00%
greatly across cantons. With respect to the Swiss average of 4243 CHF (registered in 2005, the latest year considered in the empirical analysis), canton Geneva and Basel City present the highest value of expenditures, with 6578 and 5854 CHF, respectively. Cantons Appenzell Inner Rhodes and Obwald register the smallest expenditure values (with 2988 CHF and 3155 CHF, respectively). As far as the incidence is concerned, it ranges from 5.15% of disposable income in the rich and low SHE canton of Zug to almost the double in Geneva, Jura and Neuchâtel. Whereas in Geneva it is the high level of SHE that determines the heavy burden for households, in Jura (where SHE is aligned with Swiss average) the high incidence is rather driven by a low average income.
However, the differences do not only concern the total amount of expenditure: another evident difference between cantons is the proportion of each of the single financing sources.
The table also shows that, in cantons where the total expenditure is higher, the share of the cantonal part tends to be also higher. This is because, where health care costs (and consequently premiums) are higher, many households cannot afford anymore the cost of mandatory health insurance, which means that cantons are forced to spend more in terms of subsidies for the worse-off.
The values in the table show that the most important part is financed by health insurers. This accounts, on average, for 47 percent of the SHE. The second source derives from the cantonal taxes that cover 29 percent of the SHE, followed by the social insurances and federal taxes that account for 13 percent and 11 percent, respectively.
Finally, it is worth noting the magnitude of the differences among cantons. There are two cantons for which the part financed by cantonal taxes is considerably larger (Geneva - 43 percent; Basel City - 39 percent), whereas in Appenzell Inner Rhodes the share financed by cantonal taxes corresponds to only 20 percent.
1.4
Dataset
The micro dataset is the Swiss Household Income and Expenditure Survey (SHIES), which allows computation of household income at a very detailed level, including all the taxes and social contributions paid, as well as the health expenditures (premiums and, only to some extent, out-of-pocket expenditures) and indemnities related to health (subsidies from the state and reimbursements from the insurance companies).
This survey is available from 1998 to 2005 (excluding 1999) and is based on a sample of the Swiss population (approximately 3500 households observed for each of the years between 2000 and 2005, and 9295 observations for 1998).
cantons for each year, but only at the level of seven macro-regions, each of which groups cantons together according to their geographical position3. As the focus of this work is to control for the differences due to the federal setting, we were interested in maintaining the cantonal dimension. For this reason, we decided to merge the dataset of each year to obtain a representative sample at the cantonal level. This has been possible because different people were interviewed each year for each canton. In this way we were able to control for the cantonal differences, but we lost the information about the variation over time for each canton.
Ultimately, this study concentrates on the between-variation for each canton and on the within-variation only for the whole Switzerland and the seven macro-regions. There are some differences in the questionnaires, especially for the year 1998 with respect to the other years. Only in the wave of interviews taken in 1998, were people asked to report all the medical expenses (greater than 150 CHF) they had during the whole year preceding the month of the survey and not only all the medical expenses they had during the month of the interview (as it is in the other waves of the survey). Moreover, only for the year 1998 responders had to register the reimbursements received by the insurance companies during the whole year; hence there was a correspondence between the expenditures and their reimbursements. The collection of this data makes it possible to compute the out-of-pocket expenditures for each households and, consequently, to have a robust proxy for the yearly out-of-pocket financing at least for the year 1998.
1.5
Methods: Kakwani index, concentration curves and
domi-nance test
In order to measure the regressivity of each financing source, we used the procedure proposed by Wagstaff et al. (1999), (see also O’Donnell et al. (2008b) for the empirical implementation). We started by computing the Kakwani index for each financing source and then we computed a total Kakwani index aggregating these results with a weighted average, using as weights the proportion of each financing source with respect to the total financing. This procedure has been applied to 23 cantons4, to the seven macro-regions, and to Switzerland as a whole.
This index is computed as the difference between the concentration index of each financing
3
Macro-region 1 includes Vaud, Valais, and Geneva; macro-region 2 includes Bern, Fribourg, Solothurn, Neuchâtel, and Jura; macro-region 3 includes Basel City, Basel Land, and Argovia; macro-region 4 includes Zurich; macro-region 5 includes Glarus, Schaffhausen, Appenzell O. Rh., Appenzell I.. Rh., St. Gall, Grisons, and Thurgovia; macro-region 6 includes Lucerne, Uri, Schwyz, Nidwald, Obwald, and Zug; macro-region 7 includes Ticino.
4Canton Uri, canton Appenzell I. Rhodes, and canton Appenzell O. Rhodes have not been considered because
source and the Gini index calculated on the (equivalent disposable) household income before considering any health-related expenditures (we refer to this as pre-health income). If the two curves coincide, the difference between the CI and the Gini index is zero and the financing source can be considered as proportional to income.
The formula is as follows:
Kip= CIip− Gini_prei Range : [−2 : +1] (1.1)
where i indicates the geographical unit of analysis and p the different financing sources available in the dataset.
CIipis the concentration index of each financing source p. CI is twice the area between the
concentration curve of the source p and the 45-degree line. It indicates whether the variable of interest is more concentrated among the poor (the concentration curve lies above the equality line and the index has a negative value) or among the rich (the curve lies below the equality line and the index has a positive value).
Gini_prei is the Gini index for the pre-health income.
Since the Swiss fiscal system does not rely on earmarked taxes for health care, we simply imputed to the amount of taxes paid by each household the share of total health expenditure financed by that tax. We did this for federal tax, cantonal tax, and also for general social insurances.
Gini_prei is computed according to the following formula:
y_preh = N X k=1 yhk− m X s=1 (1 − µs)schs− p X v=1 (1 − τv)thv (1.2) where: • PN
k=1yhk is the gross income for the household h, which, according to the definition given
in Bilger (2008), consists of the sum of all income earned from work and self-employment, interest, house rental, social insurance benefits, revenues from other insurances, and other indemnities.
• Pm
s=1(1 − µs)schs is the part of the general social insurance paid by the household h and
not directed towards financing health care. In particular, µs is the share of health care
services funded out of the budget of the social insurances. In 2005, µs was 3.3 percent for the pension and the disability insurance, and 24.5 percent for the accident insurance.
• Pp
v=1(1 − τv)thv are the taxes (federal, cantonal and municipal) paid by the household
VAT has been computed from the data on consumptions that household declared in the survey.
As in the case of social contribution, τv is the part used to finance the health care system for each type of tax (v), so 1 − τv is the residual part that is not used within the health sector.
To give an idea of the dimension of these coefficients, in 2005 τv was 5.4 percent for federal tax, 28.5 percent (on average) for cantonal tax and 4.3 percent (on average) for communal tax. Disposable income before health-care financing has been corrected using an equivalence scale in order to make households with a different number of members comparable5.
Moreover, as different years are pooled together, the values have been deflated through the consumer price index (CPI) for Switzerland.
Kakwani is a useful index for providing information about the shift from proportionality. However, it is an extremely summary measure, and its information can be sometimes misleading if the distributions underlying the Kakwani index are not considered alike. When curves cross, a value of Kakwani equal to zero could be the result of a concentration curve that is progressive for half of the population and regressive for the other half. To control for this, we look also at the concentration curves and the relative dominance test, that aims to define statistically whether one curve dominates another. The null hypothesis indicates that there is no significant difference between the two concentration curves considered. The choice criterion used here is the multiple comparison approach. In the comparison between the two curves, the null is rejected if there is at least one significant difference between them in one direction and no significant difference in the other direction. The ordinates are compared in 19 different quintiles, as suggested by O’Donnell et al. (2008b)
1.6
Results
Table 1.3 presents the results of the Kakwani index over time for the whole Switzerland and for the seven macro-regions.
The most notable result is that the total value of the Kakwani index is always negative, which means that the Swiss health-care system financing remains regressive, even after the major reform of 1996; this result is in line with the previous literature. The other notable point is that the results do not seem to vary widely in the years considered, neither for all of Switzerland nor for any of the macro-regions. The most regressive year appears to be 1998, although the data provides no evidence of any clear temporal trend.
5The scale chosen is the OECD modified equivalence scale, which assigns a value of 1 to the household head,
Table 1.3: Kakwani index over time 1998 2000 2001 2002 2003 2004 2005 Macro-region 1 -0.136** -0.091** -0.069** -0.065** -0.099** -0.090** -0.074** [1495] [590] [586] [603] [528] [505] [502] Macro-region 2 -0.106** -0.081** -0.081** -0.109** -0.105** -0.085** -0.109** [2173] [925] [907] [840] [788] [780] [751] Macro-region 3 -0.103** -0.099** -0.044* -0.062** -0.065** -0.076** -0.084** [1287] [504] [516] [529] [482] [441] [400] Macro-region 4 -0.130** -0.138** -0.092** -0.094** -0.104** -0.111** -0.112** [1659] [638] [612] [640] [622] [562] [531] Macro-region 5 -0.130** -0.116** -0.125** -0.119** -0.084** -0.137** -0.147** [1183] [433] [478] [469] [438] [420] [417] Macro-region 6 -0.136** -0.135** -0.080* -0.089** -0.108** -0.125** -0.075** [806] [329] [300] [313] [289] [287] [245] Macro-region 7 -0.087** -0.074** -0.078** -0.034 -0.027** -0.083** -0.016** [692] [223] [341] [332] [328] [275] [241] CH -0.130** -0.110** -0.084** -0.094** -0.098** -0.104** -0.101* [9295] [3642] [3740] [3726] [3475] [3270] [3087] Significance level: *p < 0.05, **p < 0.01. The values in brackets show the sample size.
Macro-region 7 (Ticino) seems to reach the best value in terms of equity, for all the years considered, since the Kakwani is not statistically different from zero in 2002, 2003 and 2005. Macro-region 4 (Zurich) is in line with the Swiss average, and macro-region 3 (Basel City, Basel Land, and Argovia) is, after Ticino, the least regressive group of cantons.
The weighted Kakwani index for the SHE in Switzerland ranged from -0.084, reached in 2001, and -0.13 in 1998.6
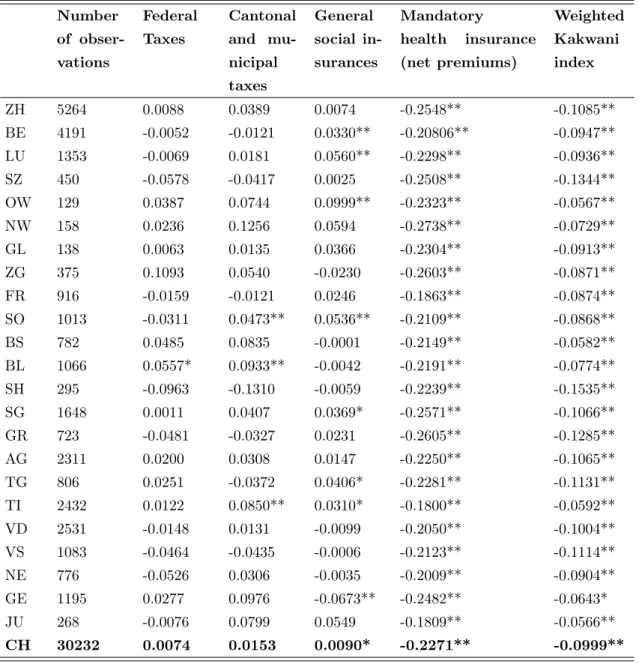
Table 1.4 presents the Kakwani indexes for the Swiss cantons and helps shed light on how fiscal federalism allows cantons to choose their preferred financing policy.
It is evident from the table that there are important differences in the regressivity of the financing system among cantons.
The Kakwani index for federal taxes is not statistically different from zero for all the cantons apart from canton Basel Land (BL), which has a slightly progressive value. This means that federal taxes are concentrated quite proportionally among the population. This result could be easily explained if we think that the tax amount considered here is the sum of a progressive federal direct tax (based on income) and an indirect tax (VAT) based on consumption that is normally regressive. Canton Basel Land is the only one in which the effect of the progressive direct tax more than offsets the effect of the regressive VAT.
The Kakwani indexes for the cantonal and municipal taxes are more difficult to explain. While we would expect a highly progressive value, most of them are not statistically different from zero. Only Solothurn (SO), Ticino (TI), and Basel Land (BL) present a slightly positive value of the Kakwani index, which means a slightly progressive tax. These values are smaller than the results expected, but there are at least two reasons that could explain them.
First of all, this financing source includes both cantonal and municipal tax. Very rich house-holds may choose to live in jurisdictions that have a lower local (municipal) taxation. Therefore, a richer household may have to pay the same cantonal tax, but a different (lower) municipal tax than a poorer household that lives in a municipality with higher taxation. This could bias the progressivity results in favor of a score that cannot reject the hypothesis of proportionality.
A second reason could be the fact that there is a mismatching between household income that refers to the year of the interview and household taxes that are paid on income earned the year prior to the interview. There could be situations in which a person has reduced his or her revenues (perhaps because they have temporarily lost their job or have retired), but reports to pay high taxes because she/he earned a “regular” income in the previous year. This could worsen the situation of regressivity because the Kakwani index is computed as if tax paid and income
6As explained in section 4, data for 1998 was collected in a different manner that makes it possible to compute
the Kakwani index for the total health expenditure, including the out-of-pocket payment and the complementary insurance. We computed this for all of Switzerland and found that the equity results are even worse (Kakwani -0.14).
Table 1.4: Kakwani index across cantons Number of obser-vations Federal Taxes Cantonal and mu-nicipal taxes General social in-surances Mandatory health insurance (net premiums) Weighted Kakwani index ZH 5264 0.0088 0.0389 0.0074 -0.2548** -0.1085** BE 4191 -0.0052 -0.0121 0.0330** -0.20806** -0.0947** LU 1353 -0.0069 0.0181 0.0560** -0.2298** -0.0936** SZ 450 -0.0578 -0.0417 0.0025 -0.2508** -0.1344** OW 129 0.0387 0.0744 0.0999** -0.2323** -0.0567** NW 158 0.0236 0.1256 0.0594 -0.2738** -0.0729** GL 138 0.0063 0.0135 0.0366 -0.2304** -0.0913** ZG 375 0.1093 0.0540 -0.0230 -0.2603** -0.0871** FR 916 -0.0159 -0.0121 0.0246 -0.1863** -0.0874** SO 1013 -0.0311 0.0473** 0.0536** -0.2109** -0.0868** BS 782 0.0485 0.0835 -0.0001 -0.2149** -0.0582** BL 1066 0.0557* 0.0933** -0.0042 -0.2191** -0.0774** SH 295 -0.0963 -0.1310 -0.0059 -0.2239** -0.1535** SG 1648 0.0011 0.0407 0.0369* -0.2571** -0.1066** GR 723 -0.0481 -0.0327 0.0231 -0.2605** -0.1285** AG 2311 0.0200 0.0308 0.0147 -0.2250** -0.1065** TG 806 0.0251 -0.0372 0.0406* -0.2281** -0.1131** TI 2432 0.0122 0.0850** 0.0310* -0.1800** -0.0592** VD 2531 -0.0148 0.0131 -0.0099 -0.2050** -0.1004** VS 1083 -0.0464 -0.0435 -0.0006 -0.2123** -0.1114** NE 776 -0.0526 0.0306 -0.0035 -0.2009** -0.0904** GE 1195 0.0277 0.0976 -0.0673** -0.2482** -0.0643* JU 268 -0.0076 0.0799 0.0549 -0.1809** -0.0566** CH 30232 0.0074 0.0153 0.0090* -0.2271** -0.0999** Significance level: *p < 0.05, **p < 0.01.
earned referred always to the same year7.
As expected, the Kakwani indexes for the general social insurance are not statistically dif-ferent from zero. Since the tax rate is the same for every wage earned, regardless of its level, we expected a Kakwani value near to zero. Nevertheless, there are some exceptions. Four cantons (Bern, Lucerne, Obwald, and Solothurn) present a progressive value, while canton Geneva is the only one that has a regressive index for this financing source. This could be because the share of capital income over the total income in Geneva is higher than in the other cantons (and, consequently the wage income share is lower): the fact that the payment for the social insurance is only based on wage income could induce a regressive effect in the results.
The most interesting results are those for the mandatory health insurance. They are all significant for each canton and range from a value of -0.18 for canton Ticino to -0.27 for canton Nidwald.
It is quite notable that the values can be so different, even in neighboring cantons: the value of the index in canton Grisons (-0.26) is 0.08 less than that of its neighbor, Ticino (-0.18). Based on the Welch’s t-test, we can show that this difference is statistically significant at the 95% level. This outcome probably hides a different choice in the subsidy policy that cantonal authorities are free to set-up. Previous studies (see Balthasar et al. (2008); Ortiz (2011)) have shown that on average the same family (e.g. parents with two children and a revenue of 70’000 CHF) has to devote 4.4% of disposable income if it lives in Obwald, but up to 16.4% if the canton of residence is Vaud. This heterogeneity jointly reflects the premium level and the generosity of the subsidy policy. In general cantons with a very high level of premiums prefer to distribute generous subsidies to a limited group of citizens, whereas those with lower premiums levels choose to reach more people by distributing lower subsidy amounts (OECD/WHO, 2011). There is one clear outlier-canton which distributes higher subsidies than the average to an above-average share of the population, namely Ticino (Crivelli et al. (2007) show that the subsidy policy in Ticino is 34.5 percent more generous in terms of CHF spent per capita than the Swiss average). This might explain why in Ticino the net premiums are less regressive than elsewhere. On the other hand Grisons distributes subsidies that are below the Swiss average and support only a limited number of people. This strategy seems to be in line with the computed Kakwani for MHI, which is in the case of Grisons the most regressive one.
Finally, the results on the total Kakwani indices are all statistically significant8 and all
7There is another factor to consider: the tax reform. From 1990 until 2003 cantons, in turn, had to adapt their
system of taxation to a new one. This passage provoked an asymmetry between the tax paid in one year and the income earned in the same year that may have brought some additional asymmetries also in our computations.
8
The standard error for the total Kakwani index have been obtained summing the standard errors for the single components (i) according to the formula:
se =pPi(wise2i) + 2
P
negative.
The cantons that appear to be the most regressive ones are canton Schaffhausen and Schwyz, with a Kakwani equal to -0.15 and -0.13, respectively. The cantons that reach the best results in terms of equity are Jura, Obwald and Ticino, all of which have a Kakwani value of around -0.05.
It is worth noting that the difference between the least (Jura) and the most regressive canton (Schaffhausen) is considerable (approximately 0.10) and significant at 99% level (according to the Welch’s t-test); it is the same as the difference between the US (-0.13) and Sweden (-0.015) from the Wagstaff et al.’s (1999) study, countries that have two completely different health-care financing systems. Although Shaffausen and the Jura have greater absolute levels of regressivity than the US and Sweden respectively.
We now report the concentration curves and the dominance tests results.
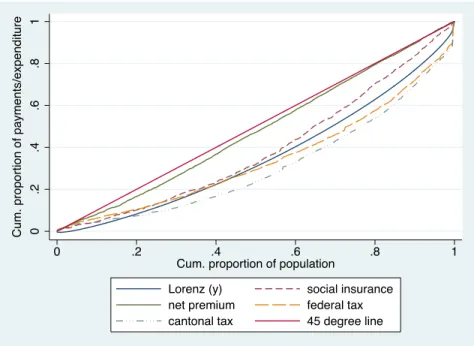
Figure 1.1: Concentration curves for each financing source, canton Geneva.
0 .2 .4 .6 .8 1 0 .2 .4 .6 .8 1
Cum. proportion of population
Lorenz (y) social insurance
net premium federal tax
cantonal tax 45 degree line
Cum. proportion of payments/expenditure
A general summary comment, based only on the visual inspection of the concentration curves, would suggest that their order follows a similar pattern for all the cantons. Firstly, starting from the 45-degree line and going down, the net premium curve is always the first one, very close to the 45-degree line and not crossing with the others. Secondly, the social contribution curve is generally the next one, always very near to the Lorenz curve, which indicates proportionality. Thirdly, the federal tax line is also quite near to the Lorenz curve and, finally, the cantonal tax curve is always the most distant and lies under the Lorenz, indicating progressivity. Nevertheless,
the two curves for taxes and the one relative to the social insurance often cross among them and with the Lorenz, which indicates an alternation between regressivity among the poorer and progressivity among the richer.
We have chosen to show the results only for canton Geneva, which is among the least regres-sive.
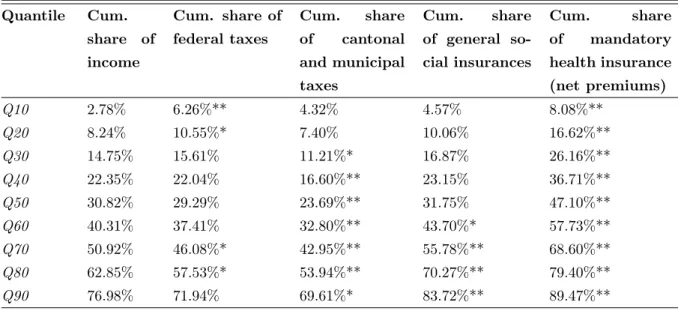
Figure 1.1 represents the concentration curves of each financing source. The concentration curve for the net premium is very close to the 45-degree line, indicating quite strong regressivity, and it dominates the Lorenz curve. In Table 1.5 we read that the poorest 30 percent of the population receives about the 15 percent of the total income and pays 26 percent of the net premium.
Table 1.5: Cumulative shares of income and health payments by income decile, canton Geneva
Quantile Cum. share of income Cum. share of federal taxes Cum. share of cantonal and municipal taxes Cum. share of general so-cial insurances Cum. share of mandatory health insurance (net premiums) Q10 2.78% 6.26%** 4.32% 4.57% 8.08%** Q20 8.24% 10.55%* 7.40% 10.06% 16.62%** Q30 14.75% 15.61% 11.21%* 16.87% 26.16%** Q40 22.35% 22.04% 16.60%** 23.15% 36.71%** Q50 30.82% 29.29% 23.69%** 31.75% 47.10%** Q60 40.31% 37.41% 32.80%** 43.70%* 57.73%** Q70 50.92% 46.08%* 42.95%** 55.78%** 68.60%** Q80 62.85% 57.53%* 53.94%** 70.27%** 79.40%** Q90 76.98% 71.94% 69.61%* 83.72%** 89.47%**
Significance level: *p < 0.05, **p < 0.01. The significance level indicates whether the percentage share of financing source is significantly different from the income_pre.
The tests of dominance (not shown in the table) find evidence of dominance of the social contributions curve on the Lorenz curve and dominance of the Lorenz curve on the cantonal tax curve. These two last results tell us two important things. Firstly, the dominance for the social contribution curve confirms the result of the Kakwani index: the social contributions are regressive in Geneva, while the situation is different for the cantonal tax. This financing source seems to be progressive, but only starting from the second decile of the ranked population (i.e., for the richest 80 percent). For the poorest 20 percent of the ranked population, we cannot reject the hypothesis of proportionality (as the difference between the two curves is not statistically significant).
1.7
Discussion: lessons for a federal state
The most relevant evidence is that the regressivity of the MHI implies that the subsidy policy adopted by the state does not succeed in making the financing of this source progressive or, at least, proportional. Considering that the subsidy is the most important tool that cantons have to mitigate the regressive nature of the community-rated premiums, this is a very strong result for policy makers.
However, the value of Kakwani here includes something more than the effects of the earmarked subsidies chosen by the cantons. Also, the individual choices (premium and deductible) allowed by the competitive setting of the Swiss health insurance have a significant impact on equity. The Swiss system encourages competition between insurance companies, which plays out in the level of the premium and in the quality of service; twice per year, people have the option to switch to another insurance company (with lower premiums, e.g.). Moreover, citizens are allowed to obtain a discount on the monthly premiums by choosing a higher deductible; by assuming some of the financial consequences of getting sick themselves, they can pay a smaller monthly premium9. Finally, people who choose to be part of a managed care plan can also get a discount on premiums. These choice options are not constrained to a certain level of income, but there is evidence that not all citizens can manage the available information to make a rational choice in terms of switching (Ortiz, 2011) or of selecting the appropriate type of contracts. Accordingly, we cannot exclude the existence of a social gradient in the ability to manage information. In this case, the burden of solidarity with the sick implied by community rating may be partially shifted back from the good risk to the bad risk as well as from the better off to the worse off, with negative consequences on the equity level.
Similarly, the Kakwani index of taxation includes also an indirect (or endogenous) effect due to individual choices. For example, very rich people may decide to live in a canton (or municipality) with a less progressive taxation to pay less taxes and this may also have an impact on the regressivity level of the canton. If this effect increases or decreases the regressivity depends on the distribution of income among the population.
Another consideration needs to be specified. The Kakwani index considers only the relative financing burden of households with respect to others, not the absolute burden of the health financing. The poor in a canton with a slightly regressive financing may have to pay absolutely more for health care than people with the same income in a canton with highly regressive financing.
In other words, the Kakwani index is appropriate to measure the level of vertical inequity,
9Financially constrained households may ‘underinsure’ by choosing higher deductibles or switching to a more
but it is not able to capture the extent of horizontal inequity.
To have an idea of the dimension of horizontal inequity, we computed the incidence of health expenditure on the total income for different income classes. We found that there is a similar general trend for all cantons; specifically, the incidence for the lower-income classes is heavy and decreases for the richer classes.
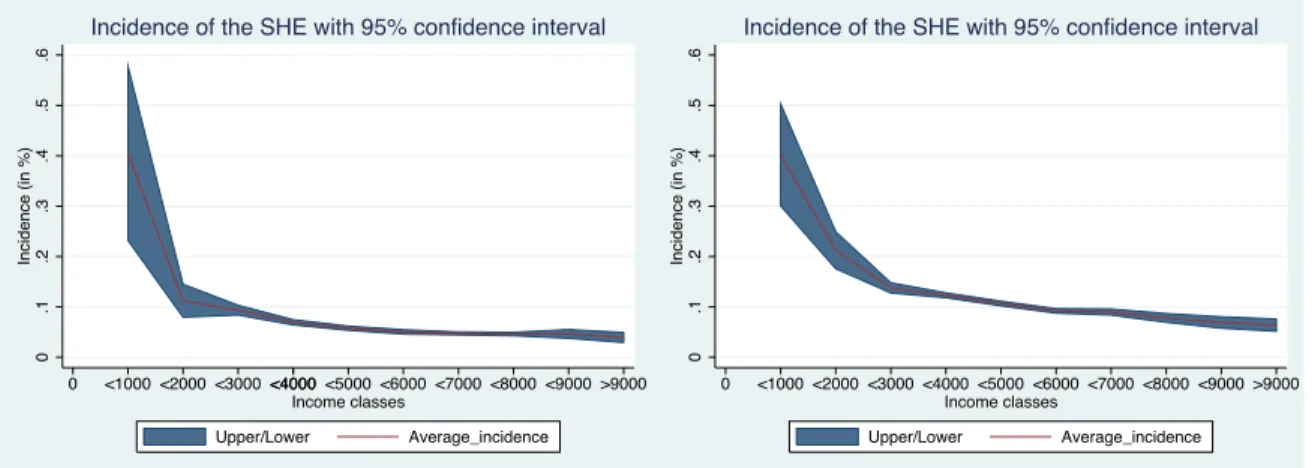
To exemplify this, the graphic representations for the incidence of the financing burden for the cantons of Zug and Geneva are reported below (Figure 1.2).
Figure 1.2: Average incidence of the socialized health expenditure on income, Zug (left) and Geneva (right). 0 .2 .4 .6 .1 .3 .5 Incidence (in %) 0 <1000<2000<3000 <4000 <5000<4000 <6000<7000<8000<9000>9000 Income classes Upper/Lower Average_incidence
Incidence of the SHE with 95% confidence interval
0 .1 .2 .3 .4 .5 .6 Incidence (in %) 0 <1000<2000<3000<4000<5000 <6000<7000<8000<9000>9000 Income classes Upper/Lower Average_incidence
Incidence of the SHE with 95% confidence interval
The red line represents the average incidence for each of the income classes considered, while the blue-shadow area indicates the confidence intervals. Interestingly, the two red lines have a similar shape, although the line for Geneva is shifted upwards with respect to the other.
With an exception for the first income class, the level of incidence is quite different: the share of income that people in Geneva pay is almost double that of citizens earning an equivalent income in Zug. This means that people in Geneva (one of the least inequitable cantons) pay more, not only in absolute value, but also as a percentage on their income than in Zug (one of the most inequitable cantons in terms of the Kakwani analysis).
The reason for such a result can easily be found by simply looking again at the absolute level of expenditure (Table 1.2): Geneva registers one of the highest levels (6578 CHF per capita), while Zug has one of the lowest ones (3885 CHF per capita).
This example clearly shows that the burden of health-care financing may be equally dis-tributed, but may be too heavy to be affordable for lower- and middle-income people. To have a clear understanding of the equity issue, the importance of the absolute expenditure levels cannot be neglected.
suggests the presence of horizontal inequity. We would like to highlight a final remark upon this issue. The Swiss federalism allows some form of autonomy to cantons, especially in deciding the subsidy policy. Therefore, subsidies are an important tool in reducing the vertical inequity within a canton, but, on the other hand, being administered differently in each canton, they may also lead to further horizontal inequity, i.e. to more inequity across cantons.
Finally, we cannot disregard that one possible criticism with respect to the equity issue is the potential trade-off between equity and efficiency, according to what Okun theorized in 1975 (Okun, 1975). To check for this, we considered the efficiency results found in a study by Widmer and Zweifel (2012) in which they performed a data envelopment analysis for the Swiss cantons for six categories of public goods, including health, using data relative to the years 2000-2004. We ranked the cantons first according to our equity results and then according to the efficiency results found by the two authors. We compared the two ranking lists through a Spearman test and a Kendall test of rank correlation, but the results do not reject the null hypothesis of independence. This leads to the conclusion that there is no direct link between equity and efficiency in this particular setting.
1.8
Conclusions
This study represents the first attempt to investigate the impact of federalism on the financing of a universal health insurance system in terms of equity.
We have analyzed the financing of the Swiss health-care system from an equity point of view, with particular attention to the differences across cantons. We used the Kakwani index for each financing source to see how each of them shifts from proportionality. The dominance test for the concentration curves has also been performed to exploit more the available information.
The general results suggest that Swiss health-care system financing is regressive in all cantons, although there are huge differences among them. The reason for this lies in the federal setting, which allows cantons to have some freedom in certain areas, such as how to design subsidy policies for lower-income people, the choice of tax rates, and the choice of how much of the total expenditure has to be financed through taxation and how much through mandatory health insurance. These factors, along with the characteristics of the Swiss health-care system based on competition among insurance companies and on the supply of premium discounts for people opting for higher deductibles and managed care contracts, bring different levels of inequity. The results highlight the fact that the level of regressivity of mandatory health insurance premiums (net of subsidies) varies significantly across cantons, whereas for federal taxes and general social insurance the hypothesis of proportionality cannot be rejected in the majority of cantons. Finally,
The main limitations of our paper are due to the dataset on which we relied; we had to aggregate data of seven different years to get robust estimates at the cantonal level. Moreover, we had to focus on SHE because the information on out-of-pocket expenditure was not reliable for six out of seven years. Since 2008, a new legislation has been enforced in Switzerland that assigns to cantonal authorities even more leeway regarding the subsidy policy (the matching grants transfer has been replaced by a lump-sum payment). It is therefore necessary to monitor the situation in more recent years in order to figure out how inequity developed in Swiss cantons after this reform.
The results contained in this work shed light on some aspects that should be considered in other federal states that are planning to use the regulation of private health insurance and premium subsidies to ensure universal coverage. Although the combination of community rating and premium subsidies might be in theory the best solution in terms of (vertical) equity (Kifmann and Roeder, 2011), in the daily practice of federal states the empirical evidence can point to a different outcome. In fact, tax competition and a “race to the bottom” in social policy (in order to avoid the outflow of good taxpayers and the inflow of people looking for social aid) may jointly lead to a lower level of vertical equity than a sovereign state would choose if the design of social policy would occur at the national level.10
10
In 1991, through the HIA draft bill, the Swiss federal government suggested to fix the maximum incidence level for health insurance premiums at 8% of the taxable income. However, this ‘social target’ was not anchored in the law and cantons were entrusted with large autonomy in the design of their subsidy scheme. In actuality, in several cantons a large part of the population pays for premiums a share that significantly exceeds this threshold (Balthasar et al., 2008; Ortiz, 2011).
Bibliography
Abu-Zaineh, M., Mataria, A., Luchini, S. and Moatti, J.P. (2008). “Equity in health care financ-ing in Palestine: the value-added of the disaggregate approach”. Social science & medicine, 66(11):2308–2320.
Akazili, J., Gyapong, J. and McIntyre, D. (2011). “Who pays for health care in Ghana?” Inter-national Journal for Equity in Health, 10:26.
Alireza, M. (2011). Equity of Health Care Financing: An Application to Iran. Technical report, Munich: Islamic Azad University, Branch of Kermanshah.
Balthasar, A., Bieri, O. and Gysin, B. (2008). Monitoring 2007. Die Sozialpolitische Wirksamkeit der Prämienverbilligung in den Kantonen [The Social-Policy Effectiveness of Health Insurance Premiums Allowances in the Cantons]. Bern: Federal Office of Public Health.
Beck, K., Trottmann, M. and Zweifel, P. (2010). “Risk adjustment in health insurance and its long-term effectiveness”. Journal of Health Economics, 29(4):489–498.
Bilger, M. (2008). “Progressivity, horizontal inequality and reranking caused by health sys-tem financing: A decomposition analysis for Switzerland”. Journal of Health Economics, 27(6):1582–1593.
Crivelli, L., Filippini, M., Mantegazzini-Antonioli, B. and Pallotti, F. (2007). “I costi dell’assicurazione malattia nel cantone Ticino. Sintesi del rapporto finale”.
Gerdtham, U. and Sundberg, G. (1998). “Redistributive effects of Swedish health care finance”. The International journal of health planning and management, 13(4):289–306.
Gilardi, F. and Füglister, K. (2008). “Empirical modeling of policy diffusion in federal states: the dyadic approach”. Swiss Political Science Review, 14(3):413–450.
Kägi, W., Frey, M., S´’auberli, C. and Koch, P. (2012). Wirksamkeit der Prämienverbilligung [Effectiveness of Health Insurance Premiums Allowances], volume Monitoring 2010. Bern: Federal Office of Public Health.
Kakwani, N.C. (1977). “Measurement of tax progressivity: an international comparison”. The Economic Journal, 87(345):71–80.
Kifmann, M. and Roeder, K. (2011). “Premium subsidies and social health insurance: Substitutes or complements?” Journal of Health Economics, 30(6):1207–1218.
Klavus, J. (1998). “Progressivity in health care financing: estimation and statistical inference”. Finn Econ Paper, 11(2):86–95.
Klavus, J. (2001). “Statistical inference of progressivity dominance: an application to health care financing distributions”. Journal of Health Economics, 20(3):363–377.
Kriesi, H., Farago, P., Kohli, M. and Zarin-Nejadan, M. (2005). Contemporary Switzerland. Palgrave Macmillan.
Lairson, D.R., Hindson, P. and Hauquitz, A. (1995). “Equity of health care in Australia”. Social science & medicine, 41(4):475–482.
Mtei, G., Makawia, S., Ally, M., Kuwawenaruwa, A., Meheus, F. and Borghi, J. (2012). “Who pays and who benefits from health care? An assessment of equity in health care financing and benefit distribution in Tanzania”. Health policy and planning, 27(suppl 1):i23–i34.
O’Donnell, O., van Doorslaer, E., Rannan-Eliya, R.P., Somanathan, A., Adhikari, S.R., Akkazieva, B., Harbianto, D., Garg, C.C., Hanvoravongchai, P., Herrin, A.N., Huq, M.N., Ibragimova, S., Karan, A., Kwon, S.m., Leung, G.M., Lu, J.f.R., Ohkusa, Y., Pande, B.R., Racelis, R., Tin, K., Tisayaticom, K., Trisnantoro, L., Wan, Q., Yang, B.M. and Zhao, Y. (2008a). “Who pays for health care in Asia?” Journal of Health Economics, 27(2):460–475.
O’Donnell, O., Van Doorslaer, E., Wagstaff, A. and Lindelow, M. (2008b). Analyzing health equity using household survey data. The World Bank, Washington, DC.
OECD/WHO (2011). “OECD Reviews of Health Systems: Switzerland 2011”. URL http://dx.doi.org/10.1787/9789264120914-en.
Okun, A.M. (1975). Equality and efficiency: The big tradeoff. Brookings Institution Press.
Ortiz, Y. (2011). Prices and choices in the Swiss health care insurance market. Studienzentrum Gerzensee.
Paci, P., Wagstaff, A., van Doorslaer, E. and Rutten, F. (1993). “Italy”. Equity in the finance and Delivery of Health Care An international Perspective:151–165.
Smith, S. (2010). “Equity in Irish health care financing: measurement issues”. Health Economics, Policy and Law, 5(2):149.
Wagstaff, A. and van Doorslaer, E. (1997). “Progressivity, horizontal equity and reranking in health care finance: a decomposition analysis for the Netherlands”. Journal of Health Economics, 16(5):499–516.
Wagstaff, A., van Doorslaer, E. and Paci, P. (1989). “Equity in the finance and delivery of health care: some tentative cross-country comparisons”. Oxford Review of Economic Policy, 5(1):89–112.
Wagstaff, A. and Van Doorslaer, E. (1992). “Equity in the finance of health care: some interna-tional comparisons”. Journal of Health Economics, 11(4):361–387.
Wagstaff, A., Van Doorslaer, E., van der Burg, H., Calonge, S., Christiansen, T., Citoni, G., Gerdtham, U.G., Gerfin, M., Gross, L. and Hakinnen, U. (1999). “Equity in the finance of health care: some further international comparisons”. Journal of Health Economics, 18(3):263– 290.
Widmer, P. and Zweifel, P. (2012). “Fiscal Equalization, Tiebout Competition, and Incentives for Efficiency in a Federalist Country”. Public Finance Review, 40(1):3–29.
Yu, C.P., Whynes, D.K. and Sach, T.H. (2008). “Equity in health care financing: the case of Malaysia”. International Journal for Equity in Health, 7:1–15.
Chapter 2
Equity in the Swiss health care system:
the role of managed care and higher
deductible
Keywords
Equity, inequality, managed care, doctor visits.
2.1
Introduction
Switzerland, as many other OECD countries, has adopted an egalitarian view regarding the organization and the delivery of health care services. This means that the health care system is considered equitable in the utilization if people with the same health care needs are treated equally, irrespective of their socio–economic conditions. In line with the literature that inves-tigates this topic, we refer to the concept of horizontal inequity any time the differences in the health care utilization are amenable to a different socio–economic condition. In this paper, we focus on the equity in utilization taking into account the recent Swiss health care system changes. Equity in access to health care has not emerged as a big issue in Switzerland in the past years. Leu and Schellhorn (2004) analyze equity in access to health care in Switzerland over time. Their analysis is based on data from the “Socio Medical Indicators for the Population of Switzerland” for 1982 and on the “Swiss Health Survey” for the years 1992, 1997 and 2002. They assess the level of horizontal equity for each year and report separate estimates for visits to the general practitioner (GP) and to specialists. Results suggest that there is little or no inequity in GP consultations, whereas specialist visits are pro rich distributed. The authors find little or no variation over time.

![Table 1.3: Kakwani index over time 1998 2000 2001 2002 2003 2004 2005 Macro-region 1 -0.136** -0.091** -0.069** -0.065** -0.099** -0.090** -0.074** [1495] [590] [586] [603] [528] [505] [502] Macro-region 2 -0.106** -0.081** -0.081** -0.109** -0.105** -0.08](https://thumb-eu.123doks.com/thumbv2/123doknet/14989367.672893/24.918.123.806.375.807/table-kakwani-index-over-macro-region-macro-region.webp)