HAL Id: hal-01166512
https://hal.archives-ouvertes.fr/hal-01166512
Submitted on 23 Jun 2015HAL is a multi-disciplinary open access archive for the deposit and dissemination of sci-entific research documents, whether they are pub-lished or not. The documents may come from teaching and research institutions in France or abroad, or from public or private research centers.
L’archive ouverte pluridisciplinaire HAL, est destinée au dépôt et à la diffusion de documents scientifiques de niveau recherche, publiés ou non, émanant des établissements d’enseignement et de recherche français ou étrangers, des laboratoires publics ou privés.
Santosh K.C., Laurent Wendling
To cite this version:
Santosh K.C., Laurent Wendling. Graphical symbol recognition. Wiley, pp.1 - 22, 2015, Encyclopedia of Electrical and Electronics Engineering, �10.1002/047134608X.W8260�. �hal-01166512�
Graphical symbol recognition
† K.C. SANTOSH‡National Library of Medicine, NIH
8600 Rockville Pike, Bethesda, MD 20894, USA
LAURENT WENDLING‡
SIP–LIPADE, Université Paris Descartes (Paris V)
45, rue des Saints-Pres, 75270 Paris Cedex 06, FRANCE
Email: [email protected] & [email protected] ‡Corresponding authors (both can be contacted)
†Citation. Santosh, K.C. and Wendling, L. Graphical Symbol Recognition. Wiley Encyclopedia of Electrical and Electronics Engineering. p. 1 – 22, 2015, DOI:10.1002/047134608X.W8260
Abstract. The chapter focuses on one of the key issues in document image processing i.e., graphical symbol recognition. Graphical symbol recognition is a sub-field of a larger research domain: pattern recognition. The chapter covers several approaches (i.e., statistical, structural and syntactic) and specially designed symbol recognition techniques inspired by real-world industrial problems. It, in general, contains research problems, state-of-the-art methods that convey basic steps as well as prominent concepts or techniques and research standpoints/directions that are associated with graphical symbol recognition.
Keywords.Graphics processing·graphical symbol·recognition, retrieval and spotting·statistical approaches·
structural and syntactic approaches·real-world problems.
1. Introduction
Document analysis or processing is mainly related to texts and graphics. It concerns text and or graphics separation, localization and recognition (1). According to (2), document analysis is related to document image analysis (DIA) since both research works have been concerned with document image interpretation. In a similar manner, (3) categorize document image analysis into two domains:
1) textual processing and 2) graphics processing.
In both articles (2; 3), the basic tasks are image segmentation, layout understanding and graphics recognition. Graphics recognition has been the subject of intensive research activity in the community of pattern recognition and document analysis. Graphical symbol recognition, in particular, has a long history since the 70’s, and it is considered as the core part of graphical document image analysis and recognition systems. In 1998, (4;5) a prominent researcher has made a statement: ‘none of these methods works’ in general. Since then, it has been actively extended (5–9). Very recently, the importance and the usage of graphics recognition have been reported (9).
Graphics or graphical symbols are referred to as visual images or designs, interpreting information about the context. Graphical symbols are generally 2D-graphical shapes, including their composition in the highest level of conceptual information. Overall, it plays a crucial role in a variety of applications such as automatic interpretation and recognition of circuit diagrams (10; 11), engineering drawings and architectural drawings (12–15), line drawings (16), musical notations (17), maps (18), mathematical expressions (19), and optical characters (20–23). Graphics is often combined with text, illustration, and color. Therefore, in document image processing, graphical symbols, for instance, convey crucial cues about the context in comparison to texts. Besides generic approaches, text recognition is distinct from symbol recognition, even though their boundaries are not obvious. Thus, their solutions complement each other (1;24).
In general, the whole symbol recognition process is based on either
1) matching features between a query and dataset symbols or
2) comparing decomposed parts such as lines and arcs as well as the relations between them.
These are commonly referred to as statistical and structural approaches, respectively. An overview of the performance of the most commonly used shape descriptors (refer to the statistical approaches) for symbol representation is provided in (25). In case of structural approaches, to recognize graphical symbols and/or to localize significant or known visual parts of the technical documents or images, graphics processing refers to low level primitives analysis. On the other hand, it is concerned with regions-of-interest analysis and recognition. This means that research scientists take a graphical symbol as a set of primitives, which may be lines or arcs, triangles, rectangles, or more complex primitives like loops (14; 26; 27). Their interpretations, however, depend on the studied application as well as on their specific local context. Therefore, primitive extraction and symbol recognition, on the whole, are the key steps toward understanding and interpreting content within a document. Considering both approaches, researchers addressed the use of their best possible efficient combinations (27;28), which has been recently reported (8):
‘... the recurring wish for methods capable of efficiently combining structural and statistical methods’ and ‘the very structural and spatial nature of the information we work with makes structural methods quite natural in the community.’
The problem can further be extended to symbol spotting, but one can view this as a kind of retrieval (29– 33), which is guided by user queries. Additionally, the recognition/retrieval process can be made with the help of local descriptors like scale invariant feature transform (SIFT) and with the use of techniques like bag-of-features so that either primitive or region extraction (segmentation) can be avoided. The question always remains the same, ‘what approach does what (i.e., performance) in which context?’. As mentioned earlier, graphics recognition has an extremely rich state-of-the-art literature in symbol recognition and localization (6;9;34;35). But the major state-of-the-art methods for symbol recognition,
do not conclude on the existence of a set of generic methods that can yield the best results, even though they are easy to implement (with fewer parameters) and are reproducible. This brings an idea of complexity variations between the samples from one application to another. Another reason could be the industrial project restriction, which requires automated systems with higher accuracy to reduce the cost of human intervention and ensure the effectiveness of the product. As a consequence, generic approaches might be adjusted to process the type of application under consideration. Since industrial partners are focusing on very specific problems, there exists several contracts and collaborations for research scientists. For example, industrial projects are related to information retrieval or document reverse engineering, associated with more powerful computers and the development of enormous storage capacity, providing huge attention from the scientific community for recognizing symbols in technical documents (35–38). The latter context denotes graphics recognition, an active research field, requires constant advances so that scalability problems, for instance, can be handled. This also explains why the best approaches found in the literature refer to a specific application context and are guided by a priori knowledge of the documents processed.
In Section2.1, we provide a detailed review of common steps that are employed in the state-of-the-art methods for graphical symbol recognition. In Section 2.2, we highlight major projects that allows to forecast real-world industrial scenarios. State-of-the-art methods are enumerated in Section2.3.
2. Graphical symbol recognition system and applications
2.1 Basic steps in system design
The recognition of graphical symbols or any meaningful shapes has been the subject of numerous reviewed research articles (13;24;39–43). Most of these proposed systems are roughly described using the following two major units: 1) data acquisition and preprocessing; and 2) data representation and recognition.
2.1.1 Data acquisition and preprocessing
The documents are usually scanned at grayscale with high possibility of noise, distortion and deformation. When considering raster data, acquisition and preprocessing tools are aimed at reducing the amount of data to the most ‘relevant’ information to efficiently locate the regions-of-interest in an image. A binarization step ((44;45), for example) is then performed to extract useful information from the background. This is important since it influences the quality of subsequent processing algorithms that are dedicated to data representation and recognition. Similarly, foreground and background separation can be taken as another important tool (46). Without these, defects such as creases, stains on paper and heterogeneous wear, for example, can lead to inconsistent results. Therefore, they must be corrected with specific operators as a precursor or incorporated into the appropriate data acquisition and preprocessing unit. For correction, it may require human expertise and automatic spectrum of possible damages and their quantification. The definition of criteria and their evaluation for the quality interpretation of documents is also a challenging issue. This means that the data from this unit may undergo further processing consistent with the application under consideration. For example, the application can be either text and graphics separation (47–53) or simply pruning by removing small connected components. In other words, to focus on graphics efficiently, one needs to separate texts from the document images. Text/graphics separation aims at segmenting document into two layers so that one can focus on interest regions directly, where graphical symbols lie. The usefulness of text/graphics separation can be found in (54). Several methods were proposed to extract text parts from background to segment documents (9). Among them, the method proposed by Fletcher and Kasturi (1), has been widely used as it provides promising results in most cases, including wide ranges of applications. The
main problem of their method, however, relies on a priori knowledge about special characters and the size of connected components, since it may omit to put little disconnected symbols (or graphical shapes/elements) in the graphical layer. In (52), authors proposed to advance earlier performance by considering local segmentation. Recent promising advancements consider sparse representation to tackle this problem (55).
To achieve the optimal performance from the subsequent processing algorithms, this unit requires the most a priori knowledge about the document structure and the symbol representation.
2.1.2 Data representation and recognition
In general, data representation and recognition steps are strongly correlated with the preprocessing step. The quality preprocessor yields quality data at the output so that one can efficiently represent it for recognition.
As mentioned in Section1, the graphical symbols are represented either in the form of feature vectors by estimating the overall shape or in more structured forms (i.e., graphs) by using meaningful primitives that are extracted from the whole symbol. In the latter case, primitive selection tools are application dependent. Data quality and the problem complexity determine the data representation, which is again followed by matching techniques to be used in the decision process. A good data representation is assumed to be compact and discriminant, and minimizes the intra-class distance and maximizes the inter-class distance (6). Further, feature computation must have realistic time complexity as well as storage format to ensure data portability. This ultimately makes classification easier. Classification is the problem of identifying to which of a set of classes a new query belongs. This is basically based on a training set of data containing samples whose class membership is known.
Existing approaches, specifically those based on feature based matching, can be split into three categories: statistical, structural and syntactic. Most methods are particularly suited for isolated line symbols, not for composite symbols connected to a complex environment (6;13;35;56). As said before, these are guided by how the symbols are represented. Further, in each category, we have found that the choice of methods often depends on human expertise. To support this statement, we summarize the reasons in the following with examples.
1) The techniques used in statistical approaches fairly computes the differences between two feature vectors (56;57).
2) The techniques based on graph grammar will be more suitable to search symbols in technical documents where information is close to a feature vector description that follows composition rules of primitives (58–64). On the other hand, the graph matching techniques are also effective to handle vector-based representation of primitives (attributed relational graphs (ARG), for example) (13;65). On the whole, following the state-of-the-art methods, we have neither seen any absolute standard on the choice of the best approach, nor detected obvious combinations of techniques for optimal performance. A detailed study is provided in Section2.3.
2.2 Applications: real-world examples
Over the decades, international association of pattern recognition (IAPR) sponsored graphics recognition (GREC) workshops, supported by technical committee 10 (TC-10: http://iapr-tc10. univ-lr.fr/) have been organized together with the contests, where graphical symbol recognition, retrieval and spotting are the prominent tasks. Besides regular papers in the proceedings, these
Fig. 1. Graphical symbols. An example illustrating lineal and fully isolated symbols (66).
(a) Query symbol (b) Symbol recognition and retrieval
Fig. 2. Isolated graphical symbols in the form of bag (31). In this illustration, the task is to recognize (exactly) similar symbol(s) in response to the applied query.
Q1.
Q2. Q3.
(a) Query symbols (b) Symbol spotting
Fig. 3. Graphical symbols, appearing in the circuit diagram (31). The aim of the task is to spot the symbol(s) that is(are) similar to the applied queries. In this example, expected symbol spotting outputs are shown by using bounding boxes in three different colors: one color per query.
GREC contests aim to objectively evaluate the state-of-the-art of graphics recognition techniques and to generate performance evaluation tools and datasets for future research (31;67–69). Fig.1shows a few model symbols (66;70). The dataset also contains other categories such as rotated, scaled, deformed and degraded at different levels, which are then used to recognize by matching with the model symbols. In general, considering isolate symbols, the aim of the contest is to realize how well the symbols are represented: are the representations invariant to rotation and scaling, and robust to deformed and degraded symbols?
Unlike the GREC contests, symbol recognition problems often rely on industrial context. Considering a real-world problem, symbol recognition is not straightforward. Straightforward symbol recognition means that any test symbol is matched with model symbols, and the model symbol with the highest similarity score is selected. Techniques that are used to automate the systems, however, are guided in accordance with the need of the collaborators. In general, common applications are recognition and
Fig. 4. Graphical symbols, appearing in the floor plans (31). An example showing symbol spotting problem in floor plan.
(a) Query symbol (b) Symbol spotting
T1. T2. T3. T4. (a) Query symbol (b) Graphical symbol/element spotting in test images (T1:T4)
Fig. 5. Graphical symbols. An example illustrating the complexity of the FRESH dataset (27;71), starting with an isolated graphical symbol (moving from left to right). This example shows how the known and significant part can be spotted based on the applied query.
localization of graphical symbols in electronic documents, in architectural floor plans, wiring diagrams and network drawings (see Figs. 2, 3, 4 and5) (6; 27; 31). In Fig. 2, one can see the problem, quite different from GREC 2003 and 2005 contests – as test symbols can be queried to recognize similar ones from the bag of symbols. In a single bag, symbols can be repeated and therefore, this can be taken as a retrieval problem. In Fig.3, an example of symbol spotting is shown. Like in Fig.2, a query symbol is applied to detect similar symbols from a complete circuit diagram. A similar problem is provided in Fig.4, where the task is used to detect symbols which are similar to the query. This example shows a architectural floor plan, a completely different application. In Fig.5, the task characterizes differently in comparison to the earlier ones even though the aim remains the same. These samples (entitled as FRESH dataset) are taken from (71). The symbols may either be very similar in shape – and only differ by slight details – or be completely different from a visual point of view. Symbols may also be composed of other known and significant symbols and need not necessarily be connected. For such complex and composite symbols, as before, an isolated query symbol is applied not only to recognize similar symbols from the dataset, but also to detect known and significant parts (graphical elements) which are associated with the query symbol. In the state-of-the-art, the latter issue has been considered as the most challenging problem. Applications can also be extended to extract very specific graphical elements: arrows (i.e., pointers, in general), and dotted lines to highlight regions-of-interest (16;72–74).
Fig. 6. Arrow detection (using a cropped document image), another important task in graphics recognition (16). Arrow detection locates important quotation and of course, meaning parts.
Fig. 7. Logo detection, a precursor to document indexing, classification and content-based image retrieval. The region that contains logo is cropped from a document image, for a better look.
Fig.6shows an example of it.
Like other applications, logos, stamps and/or seals are important graphical features, which are used to index, classify documents within the framework of content-based image retrieval (CBIR) problem (75). This means that searching administrative documents based on any particular logo/seal (as a query) allow quick filtering or routing of the document to the right business process, archive or individual (76–80). These methods are promising in detecting objects in general in terms of accuracy, time and scalability since symbols, such as seals and logos are synthetic entities consisting of uniform regions and these are highly structured. As a consequence, logo/seal detection advances the performance of document retrieval (81;82). An example of logo detection is shown in Figure7. Based on these, we refer to this issue as a generic problem recognition, in either the parts or the whole graphical symbols (6;27; 31; 32; 83; 84). The aforementioned applications require strong knowledge about how we can represent graphical symbols and recognize, detect or spot them.
2.3 Symbol representation and recognition
Automatic recognition, description, classification and grouping of patterns are important issues in many disciplines such as biology, computer vision, artificial intelligence or remote sensing where pattern representation (shape analysis, for example) plays an important role (42; 85). Patterns can be graphical elements like symbols (56) or other visual structures of any kind including cursive characters (86). Broadly, to represent any pattern, any one or the combination of the following three different approaches is used in the state-of-the-art:
1) statistical, 2) structural and
In general, the choice of the approach relies on the complexity of the problem. In Sections3and4, we explain in detail the aforementioned three approaches.
3. Statistical approaches to symbol recognition
3.1 Common methods
In statistical approaches, shape analysis plays a crucial role in graphical symbol recognition (35;56). Shape features are often grouped into two families (85):
1) contour-based descriptors and 2) region-based descriptors.
There are several approaches to describe boundary contours based on a small set of features, and the choice is driven by requirements such as robustness to noise and tolerance to small distortions. In contour-based descriptors, one of the most commonly used techniques is the Fourier descriptor (FD) (87–92). These descriptors can be easily integrated due to their simplicity and robustness in many applications dedicated to character recognition (93). Others are based on polygonal primitives from contour information and have been used for matching via dynamic programming (94; 95). A polygonal approximation of any shape results in a loss of information (for instance, the degree of ellipticity is not well suited for recognition of polygons (94)). In (96), another approach has been presented based on a contour-oriented 2D object where recognition shows robustness towards polygonal approximation inconsistency. The major drawback however, is its high time complexity. The generalized Hough transform (97–99) can be taken as a useful technique but high computational time and storage requirements are its substantial issues. From a practical point of view, the work presented in (99) does not execute faster. But in (100), both time and space complexity are reduced by targeting the regions-of-interest. Curvature approaches (101–104) describe shapes in scale space. In (101; 102), a shape is described in a scale space by the maximum of the curvature feature vector, considering the object’s boundary contours. The similarity between shapes can be measured by the distance between their corresponding scale space representations. For instance, shape context (SC) (105) is robust to small perturbations while it does not guarantee scale-invariance. Skeleton extraction has also been used for pattern matching (106;107) where shapes can be defined as a variant of contour-based approaches. In these approaches, as reported in (107), each instance of an object is represented by a graph built on the medial axis of the shape silhouette. Improved versions of the graph have been proposed (108–110) with the shock graphs, and several works have focused on methods to efficiently match two graphs (101; 107). These methods are highly effective since they are based on global optimizations. However, they have a high complexity and comparative studies show that they are less tolerant to scale variation than polar curvature methods (104). For a more detailed discussion of graph matching, we refer to Section4. In short, all these contour-based descriptors are
1) appropriate for silhouette shapes, and
2) limited to certain applications since they cannot capture interior contents, disconnected shapes or shapes with multiple holes where boundary information is not available.
Region-based descriptors take into account all pattern pixels. Common methods are based on the moment theory including geometric, Legendre, Zernike, and pseudo-Zernike moments (111–119). Invariant moments were introduced in 1960 (120). Comparative studies (111;114) have demonstrated
interest in improving invariance properties (rotation, translation and scaling) (112;119; 121–123) and reducing execution time of the Zernike moments (124). Before that, in (117), the author focused on orthogonal moments, which are computed from either binary or grayscale image. This property facilitates to reconstruct the studied image (118). Zhang and Lu (125) have proposed a region-based generic Fourier descriptor (GFD) to overcome the limitations of contour-based FD. Since this approach uses the 2D Fourier transform (FT) on a polar-raster sampled shape, it can also avoid the problem of rotation in the Fourier spectra. Experimental results show that GFD outperforms common contour-based (classical Fourier and curvature approaches) and region-based (Zernike moments) shape descriptors (125). The main drawback of these approaches is their high processing time despite the possibility of optimization and complexity reduction (124;126). On the whole, region-based descriptors can be summarized as follows:
1) A normalization procedure (representing global shape by a single vector, for instance), in region-based descriptors is used to satisfy common geometric invariance properties by using centroid position, re-sampling and re-quantization, for instance.
2) Such a single feature vector, on the other hand, may not always capture all shape information, and eventually becomes less discriminant. However, discrimination power and robustness strongly depend on the selection of an optimal set of features as well as proper fusion of classifiers (127–130). For instance, in the field of symbol recognition, to increase performance, descriptors have been combined with several classifiers according to (131).
On the whole, it is not trivial to make a strict categorization of state-of-the-art into contour- and region-based methods since their mathematical/theoretical background can be similar to each other. But the choice depends on the need and the complexity of the studied problem.
3.2 Symbol recognition related methods
In statistical approaches, two aspects are primarily involved: feature selection and model selection for recognition. Usually each pattern is represented as an n-dimensional feature vector i.e. x = (x1, x2, . . . , xn) ∈ Rn and recognition is carried out by partitioning the feature space into different known classes.
In symbol recognition, geometric features such as centroids, axes of inertia, circularity, area, line intersections, holes and projection profiles, geometric moments and image transformations are used to recognize different patterns such as graphical symbols and characters. Within this framework, shape descriptors take into account the global appearance of a pattern. A comprehensive explanation can be found in (132). However, the stand-alone geometric features such as the degree of ellipticity (corresponding to the ratio of major to minor axis) (117), the maximum orientation axis (133) and fuzzy topological attributes (134–136) may not be suitable for covering broad graphics recognition problem. But they are still useful for separating symbols having distinct shapes (56). The angular radial transform (ART) (137), a part of MPEG7 – a powerful method (computed by projecting image on an orthogonal basis) – allows the user to obtain optimal performance for graphical symbol recognition (138).
Global shape representation is widely used because of its implementation simplicity since it does not require extra pre-processing and segmentation, in contrast to local pattern representation (85). In (37), global shape descriptors are studied for symbol recognition to reduce processing time, where the reported results (using multi-oriented and multi-scale character dataset) are generally better than Zernike moments and circular features (139). The Radon transform (RT) has also been widely used to globally describe an object by using all possible projections (140), which is a particular case of the
Trace transform (141) to represent patterns. In this application, the RT is combined with the distance transform to take the description of angular objects into account or by integrating the distance between the parts of objects in the regular scans of the space in a spectrum management (142–144).
In (144), the feature vector representing shape distribution of the studied pattern are computed after normalizing all possible projection profiles in the range: (0, π[. As a consequence, it provides fast matching at the cost of not offering complete shape information. Motivated by this, the histogram of the RT has been used instead of compressing them (i.e., profiles) into a single vector (145), assuming that the studied patterns are equal in size. We remind the readers that the Radon transforms are essentially a set of parametrized histograms. In contrast, in (146;147), authors used dynamic time warping (DTW) to align every histogram for each projecting angle to absorb varying histogram sizes resulting from image signal variations. Thanks to DTW, it avoids compressing the feature matrix into a single vector which would otherwise miss information. The latter method provides better results in comparison to the results reported earlier. DTW is a commonly used approach (148).
As said before, graphical symbol recognition requires the use of robust descriptors to obtain rich information. Developing a good descriptor is still an open issue. This is because of the high variability of appearance such as rotation, partial occlusions, elastic deformations, intra-class and inter-class variations, or high variability among symbols due to different writing styles. In (149), the authors introduce a shape descriptor, which is able to deal with the changes in appearance from which these types of symbols suffer. The shape of the symbol is aligned based on principal components to make the recognition invariant to rotation and reflection, in addition to the use of the blurred shape model descriptor (BSM), where new features encode the probability of appearance of each pixel that outlines the shape of the symbol. Later, the algorithm has been extended for mutliclass symbol recognition. In (150), authors describe another framework to learn a model of shape variability in a set of patterns. The framework is based on the active appearance model (AAM) and permits to combine shape deformations with appearance variability. They have combined two modifications of the BSM descriptor as basic shape and appearance features to learn the model. These modifications allow to overcome the rigidity of the original BSM, and adapt it to the shape deformations. They reported that the results of the proposed methodology outperform the original BSM approach.
In (151), authors proposed a new descriptor by constructing a histogram for every pixel to figure out the distribution of constraints among the other pixels. These histograms are then statistically integrated to form a feature vector. This descriptor is well suited for symbol recognition in technical drawings since its shape is often close to the skeleton. But, it may not be accurate for filled shapes where topological attributes are important. Further, the computational cost is very high. In (152), authors proposed a novel approach to similarity assessment of graphical symbols based on Kullback-Leibler divergence, where symbols are represented as 2D kernel densities. Based on the reported results, it offers high accuracy compared with the state-of-the-art. Unfortunately, both methods (151;152) may not provide an accurate solution for complex and composite symbols.
Very recently, in (55), author developed the bridge between the literature of sparse representation and the visual vocabulary construction. More specifically, they apply the learned dictionary algorithm for learning a visual vocabulary based on local descriptors of symbols. Next, they construct a vector model for every symbol based on its sparse representation in the vocabulary, and adapt the tdf-if approach to the sparse representation. For isolated symbols (even deformed and degraded samples), their method performed better than well-known state-of-the-art shape descriptors such as Zernike moments (121) and R-signature (144). The method, however, may not be directly applied to complex and composite symbols (27) (see Fig.5).
For more details about shape and symbol recognition, we refer to the works presented in (35;56;153), where usefulness of the shape descriptors for document analysis and a collection of techniques employed for graphical symbols recognition have been reported. Most methods are particularly suited for isolated line symbols, not for composed symbols connected to a complex environment (6;35). In (56), shape analysis for symbol representation has been comprehensively addressed. It mainly refers to simple isolated 2D binary shapes. In statistical approaches, global signal-based descriptors (20; 85; 105; 121; 125; 144) are usually quite fault tolerant to image distortions, since they tend to filter out small change in details. This is unfortunately inappropriate in case where symbols are composed of other known and significant symbols (need not necessarily be connected) as well as texts (see Fig. 5). More precisely, the major drawbacks are due to deformation, composition with other symbols (which, in (20) leads to unstable centroid detection, and thus errors in the ring projection) and occlusion over the boundary (leading to unstable tangents in shape context (105)). Despite those drawbacks, researchers have been integrating descriptors (154–156) as well as combining several classifiers (157) to increase their performance, partially based on the idea presented in (131) that off-the-shelf methods are primarily designed for applications where line symbols are isolated. As an example, in (154), the authors combined several features (such as compactness, ellipticity, angular features and GFD), which would make graphical symbol recognition efficient. In a similar manner, in (158; 159), the authors reported the use of statistical features grouping to partition line drawings into shapes, those shapes represent meaningful parts of the symbols. The method applies to accurate and consistent detection of regions-of-interest (i.e., conversion of a complete line drawing into a set of isolated shapes). But, to form clusters of symbols, the method suffers from high computational cost.
On the whole, in these statistical approaches, signatures are simple with low computational cost (except for a few methods that are especially designed to advance graphical symbol recognition). However, discrimination power and robustness strongly depend on the selection of optimal set of features for each specific application.
4. Structural and syntactic approaches to symbol recognition
Besides statistical approaches, another idea is to decompose the symbols into either vector based primitives such as points, segments, lines and arcs or into meaningful parts such as circles, triangles and rectangles. Such peculiar structure of technical documents, which is in the form of a simple set of primitives, naturally induces the use of both structural and syntactic approaches (6; 61; 160; 161) to recognize graphical symbols, for instance. The choice depends on how well (i.e., robust) the representation can be made as well as on the skills to make algorithm faster (considering real-world projects).
Since both approaches use primitives (as basic building blocks), in what follows, we first discuss about primitive extraction. This is then followed by structural and syntactic approaches for graphical symbol recognition, retrieval and spotting.
4.1 Primitives Extraction
Considering a raster data, a symbol is naturally represented by the number of pixels. As a consequence, use of key points using local descriptor can be an issue to be discussed. But, it is still unclear which local descriptors are more appropriate and how their performances depend on the selection of key points or regions, since the use of descriptors varies from one application to another. Comprehensive explanations can be found in (162) for general image understanding problem. Vectorization (39) is another preliminary task for extracting primitives like simple lines (163; 164) and arcs (165–167) including geometric primitives such as loops and contours or simple shapes like circles and rectangles.
Fig. 8. An example showing over segmentation. It illustrates two identical shapes (symbols) in different scales produces different number of segments.
In technical documents, these primitives are considered as key elements since they can represent a complete graphical symbol (168–170). These primitives serve a common basis for both structural and syntactic approaches. It is important to notice that such a set of primitive (meaningful) extraction is not trivial since problems (studied image samples) vary from one application to another.
For line extraction, the Hough transform (171; 172) has been widely used. But, applications are reasonably limited in case of degraded scanned document due to its high computational cost. Several approaches are based on the extraction of strings from the skeleton (173; 174) having well-known distortion problems but they require a correct localization of junctions (points) (175–178) by matching opposite edges (179). These solutions are limited since the concept is sensitive to the complexity of processed shapes. Motivated by this, the orthogonal zig-zag (OZZ) algorithm (180) and adaptations (172;181) were proposed to make line extraction efficient.
Curves are taken as another subject of research interest. Digital curves have been extracted based on the polygonal approximation in the form of skeleton strings (using the Haar transform, for instance) (182–185). The method leads naturally to a loss of information (or accuracy) with respect to the initial structure but, it offers implementations simplicity for the subsequent algorithms. Other approaches that follow the initial curve are more accurate (186–188). Methods based on dynamic programming are time-consuming but in such a case, code optimizations can help (189–191). Other methods focus on key points that are inserted in the segmentation step (192–195). Most of these approaches require threshold initialization and therefore, they may differ in accordance with the type of the application. As a consequence, developing generic algorithms is not trivial. It is also difficult to combine several different approaches to detect both arcs and segments that are fundamental to ensure accurate symbol recognition. So, it is necessity to avoid over-segmentation (see Fig. 8, for example) since it may generate several small components that will be taken account for matching (196).
Typically these approaches are divided into three categories (197;198). In arc-fitting methods (166;178; 192;199), the main drawbacks are coming from potential noise and distortions that lead to local errors (i.e., over-segmentation). Other approaches are built from the Hough transform (200;201). They often produce accurate results in the presence of distortion. But, they require manual threshold initialization, which are sensitive to noise. Further, they are generally expensive in terms of computational cost. Similarly, methods based on stepwise arc extension represent the latest category. They can improve segmentation by studying specific arcs (165;197;202), and remain more stable in most cases.
At this point, vector data require the use of robust extraction operators to ensure analysis and correct understanding of documents (35;203;204). Most of these approaches have been compared in GREC contests: 2001 and 2003 (198; 199; 205; 206), for example. The generic method RANVEC (178; 205) overcomes other methods in most of the problems. One of the drawbacks of this method is that it may omit small parts since it selects points randomly, aiming to reduce the computational time.
symbol thick circle corner
1.
2.
3.
Fig. 9. Three different examples showing visual primitive extraction. Visual primitives are thick (or filled) components, circles and corners (27). The samples are taken from FRESH dataset (71).
Similar primitives such as thick (or filled) components, circles, corners and extremities (i.e., loose end points) have been extracted by using classical image analysis operators (12;14; 26;167). Fig.9shows a few examples. For thick components, it uses standard skeletonization using chamfer distance and computes the histogram of line thicknesses; and an optimal cut value is computed from the histogram to distinguish between thick zones and thin zones. In (167), the random sample consensus minimization (RANSAC) scheme is used to detect circles and arcs. The performance of the method was demonstrated (as the winner) in the arc segmentation contest on GREC in 2011 (207). Using gradient-direction-based segmentation and direct least-square fitting, a fast and accurate circle detection algorithm, reported in (208) outperform the circular Hough transform (209), the randomized circle Hough transform (210), and the fast circle detection (211) in both processing speed and detection precision. Moreover, very recently, as reported in (212), their method also outperforms RANSAC (167) in arc detection precision and speed. In (213), very recent arc detection contest was reported.
On the whole, considering technical documents (rich in graphics), a common drawback is error-prone raster to vector conversion. For example, primitive types such as arc and corner are not extracted (as expected) as the degradation or noise level increases. However, robust vectorization exists in line drawing images (engineering drawings, for instance) (177; 178; 214). The use of such low-level primitives varies widely in accordance with the complexity of the symbol.
4.2 Structural approaches
Structural approaches are based on symbolic data structures such as strings, trees and graphs. Graphs are most commonly used while strings and trees are always included as special cases. In document analysis, the most recent advancement in graph-based pattern recognition is presented in (215). The formal concept of graphs can be found in (216).
Unlike statistical approaches, structural approaches provide a powerful representation, conveying how parts are connected to each other, while also preserving generality and extensibility (217–220). Graph-based or graph-like representation provides an abstract concept of the studied image. Let us elaborate this with some examples. In (221), authors introduced the notion of interest points by considering corners and junctions. Later, it has been represented by using local descriptors such as SIFT features (222). In (223), for example, local descriptor (Harris-Laplace detector (224)) is used to build a proximity graph for any studied symbol. Fig. 10 shows an example of it. In (225) adjacency relations between the segmented regions have been described. Skeletal graph for shape representation is another example. It uses skeleton points, which are categorized into three families: junction, end
Fig. 10. An example showing proximity graph representation using interest points using local descriptor.
(a) Symbol with interest points (b) Proximity graph and branch points. Considering graphical symbol recognition, in (226), a skeletal graph is used to represent the symbol from electrical diagrams. For graph matching, bounded search is used to select the pose of the graph such as rotation, translation and scale for a minimum error transformation. It is entirely based on probabilistic models. In (227), graphs are used for building a model-based scheme for recognizing hand-drawn symbols in schematic diagrams. To construct the graph, as said before, endpoints, junctions and crossings are represented by vertices attributed with the number of neighbours and the angles between incident edges. The edges represent connecting lines in the drawing attributed with the length and curvature of the respective line. Such graph-based representation schemes are not limited; they vary widely such as ARG (228–230), region adjacency graphs (RAG) (13;231), constraint networks (232), deformable templates (15) and proximity graph (223). Similarly, other forms of graph like ARG (specifically designed for symbol representation) (68) provide fundamental parameters related to structural approaches. Fig.11 shows an example of a line graph. On the whole, they vary from one application to another i.e., a single representation does not fit for all (233;234).
Structural approaches are particularly well suited for recognizing complex symbols (235). Recognizing region-of-interest (graphical symbol, for instance) in a technical document refers to the identification/detection of a part of the graph. The process is known by the name subgraph isomorphism, which is crucial in any real-world context (236; 237). This, on the other hand, as said before, leads to a very high computational cost (NP hard problem: polynomial time) (216;238), which is often the case when complex and composite symbols are taken for evaluation. Further, variability of the size of graphs that can be due to presence of noise and possible distortions leads to computational complexity in matching. Besides, their common drawback comes from error-prone raster-to-vector conversion. This makes symbol representation weak but, varies with the application.
In the framework of stroke-based hand-drawn symbol recognition, prominent studies have been presented in (239; 240). The first study is related to template-based matching and another one uses ARGs where the vertices represent geometric primitives like lines and arcs (based on their shapes) and the edges represent the geometric relationships between them. For matching, it is primarily based on graph matching or graph isomorphism detection presented in (241). The work is conceptually similar to (242), which was extended from previous works reported in (243;244). These approaches perform well as long as vertices are well separated since they are taken from on-line strokes. On the whole, this presents an idea of how vectorization difficulties are avoided.
In (65;245), their interest is to map an inaccurate isomorphic structures to address noise artefacts and distorted data by incorporating cost functions for deletion, insertion and node/edge modification. We know that the methods are still sensitive to noise and are suffering from heavy time computational cost even after the integration of the statistical assumptions by using error-tolerant features when searching subgraphs (13;246), for instance. For the same problem, various heuristics are still employed but, they do not guarantee to show significant difference. They however, aim to have a closer to a so-called optimal solution as long as the problem is defined with some constraints.
Considering the time complexity issue, several works are more focused on computing symbol signatures by taking regions-of-interest (ROIs) in the document image (247–249). These methods aim to provide faster matching in comparison to general graph matching. The performance of such methods is based on how accurate the ROIs are extracted. This means that the methods fail when ROIs do not carry symbols. Further, in (83), author aimed to address how efficiently computational cost can be reduced through the use of graph-based structural pattern recognition approaches. The work has been developed to represent an image by a graph by using the state-of-the-art methods but, a new technique named fuzzy multilevel graph embedding (FMGE) is used to transform that graph to numeric feature vectors (250). As a consequence, it empowers the structural pattern recognition approaches by utilizing statistical pattern recognition tools. Such a graph is used to perform symbol (line drawing) recognition and spotting. While transforming the graphs to numeric feature vectors, there may a loss of information. As a consequence, the FMGE method can be compared with inexact methods, but it may be less accurate than exact methods.
In (251), authors proposed a symbol spotting technique by using graph serialization to reduce the usual computational complexity of graph matching. As said before, graphs are used to represent the documents and a (sub)graph matching technique is used to detect the symbols in them. Serialization of graphs is performed by computing acyclic graph paths between each pair of connected nodes. Graph paths are one-dimensional structures of graphs which are less expensive in terms of computation. At the same time they enable robust localization even in the presence of noise and distortion. For large graph databases, they propose a graph factorization approach to index, which is intended to create a unified indexed structure. Once graph paths are extracted, the entire database of graphical documents is indexed in hash tables by locality sensitive hashing (LSH) of shape descriptors of the paths. The hashing data structure aims to execute an approximate k-NN search in a sub-linear time.
Other methods are based on the relaxation principle based on constraint propagation for matching nodes. Besides high computational cost, another main drawback is that it does not guarantee robustness for correct local matching. These discrete approaches, where a label is associated with each primitive allow a local focusing on inconsistent matching. Such a principle has been used to carry electrical symbol recognition (252; 253). Later, Wilson and Handcock have extended the discrete relaxation by introducing a Bayesian model (254). The probabilistic relaxation assigns each node a probability measure according to the constraints. They are then iteratively updated to maximize a measure of consistency on the whole (255–257). Fuzzy concept has also been in use on the relaxation mechanism for handling uncertain data (258;259). Graph-based method allows invariants and is independent of labels (260).
Very recently, in (261;262), authors introduced an interesting approach where a Galois lattice is used to
1 2 3 4 5 1 2 3 4 5
(a) Symbol (b) Vectorization (line extraction) (c) Relational graph
A+
B-relation
(a) Symbol (b) Thick & Circle (c) Inside(Thick, Circle)
Fig. 12. An example showing use of spatial relation in the context of symbol recognition. To make it simple, we use spatial predicate (inside, a topological relation) to define the connectivity between the pair of primitives: thick (or filled component) and circle that compose a symbol.
W E S N SW NW SE NE (a) 4-directions SW NW SE NE S N E W (b) 8-directions Taken 1st quadrant (c) 16-directions
Fig. 13. Star calculus via bi-centre model using angle-based theory. It shows a cone-based method to compute relations between the studied objects (primitives).
classify structural signatures that are extracted using the Hough transform. These structural signatures are based on a topological graph, where there are only five topological relations computed between the segments (based on connected and disconnected topological configurations). As reported in the paper, the Galois lattice-based classification is robust to noise. However, the performance is inconsistent when symbols are found to be connected with other graphical elements or texts in the whole document image. Later, the advancement has been reported in (263;264).
In (265), authors addressed the problem of symbol spotting in scanned and vectorized line drawings. A set of primitives index the structure of the symbol it is composed of. Such an indexing is used to retrieve similar primitives from the database. Primitives are encoded in terms of attributed strings representing closed regions. Similar strings are clustered in a lookup table so that the set of median strings act as indexing keys. A voting scheme formulates hypothesis in certain locations of the line drawing image where there is a high presence of regions similar to the queried ones, and therefore, a high probability to find the queried graphical symbol. As reported in the paper, the method is found to be robust to noise and distortion, which are introduced by the scanning and raster-to-vector processes. A comprehensive study has been reported in (32).
To handle image recognition, partial recognition of primitives is used to guide the recognition of remaining parts within it (266). In this context, for a complete image recognition, the effect of spatial relations between the primitives on recognition performance has to be determined (267; 268). In graph-based pattern representation, connectivity that exists between the nodes must have meaningful information. Spatial reasoning has been considered as a central skill since it is a common and natural way to share spatial information through the use of spatial predicates (269) that ultimately derive relationship between the primitives. To illustrate such a concept, we refer to Fig.12, where it shows how connectivity between the primitives must be meaningful for recognition. To compute spatial relations, a common angle-based theory based on star-calculus is shown in Fig 13. In document image analysis, precise relations are required to analyze/understand scanned architectural and color map documents (270), recognize models (271), and to define efficient retrieval methods (272–275).
℘1 ℘2 x y Rpc 30 60 90 120 0 0.1 0.2 0.3 s = 120 at θ j,j+1=3° proportion 30 60 90 120 0 0.1 0.2 0.3 s = 120 at θ j,j+1=3° proportion
(a) Radial line model (b) Histograms for both visual primitives: ℘1 (left) and ℘2 (right).
Fig. 14. Two disconnected pairs of primitives ℘1(circle) and ℘2(corner) and directional relational histograms using the radial line model (RLM) with respect to the unique reference point Rpc. RLM is applied for both primitives and the unique reference point is derived using their topological relations.
0.9 0.4
0.3
0.7 (a) Node features
0.5 0.3 0.4 0.7 (b) Relational features 0.5 0.3 0.4 0.7 0.9 0.4 0.3 0.7 (c) Integrating both
Fig. 15. An example illustrating features using (a) node, (b) relations and (c) integrating both, to make a complete graph.
Similarly, authors have shown the usefulness of relational indexing of vectorial primitives for line drawing images (276). Considering the problem of symbol localization in real documents, composed of individual parts and constrained by spatial relations, as said before, global signal-based descriptors cannot be applied since they are, unfortunately, primarily designed for applications where symbols are isolated. Thus, the problem is related to the segmentation/recognition paradigm (277), for instance, where an accurate segmentation of meaningful parts is expected. In this context (as shown in Fig. 5), we are required to formalize the possible links that exist between them to build a graph-like structure (28; 278; 279). Considering the real-world problem (see Fig. 5), these methods outperform the state-of-the-art methods used in graphical symbol recognition. Based on this, in (279), the authors tested the use of relational signatures between the possible pairs of labeled vocabulary types such as circles and corners. These relations are computed in terms of histograms as shown in Fig.14, where the surrounding space is covered by rotating a radial line over a cycle (with a fixed angular step). While rotating, in each sector (made by two consecutive radial lines), histograms are computed for both primitives (i.e., counting the percentage of pixels of the studied primitives lying in it). Both primitives and relational signatures are then used to build an ARG that fully describes the symbol. Since attribute types are fully labeled, corresponding relation alignments are possible between the two graphs. Further, the general NP-hard graph matching problem has been avoided. Very recently, a new concept named Bag-of-Relations (BoRs) for symbol recognition, retrieval and spotting has been introduced (33). The key characteristic of the overall process is to use topological relation information to categorise them in terms of bags and to guide directional relations. The method has been extended to varieties of datasets (symbols) in the domain. Further, usefulness of the method for symbol spotting and for user-friendly symbol retrieval applications has been addressed (33).
information about their shape. Therefore, integrating both features (at nodes and edges) is essential. An example is shown in Fig.15. Keeping the ARG based symbol description as reported in (279), shape signatures are integrated in two different ways to improve the performance. First, shape signatures are for labelling vertices (278). Second, shape features are applied only to the vocabulary which show significant shape variations, and are grouped via unsupervised clustering (28). In both cases, a major set of well-known state-of-the-shape descriptors are integrated with spatial relations. Overall, this addresses the use of a hybrid approach in symbol recognition since it combines both worlds: structural and statistical, and try to avoid the shortcomings of each of them. Another interesting example integrating shape descriptions with relations to form RAGs is found in (280). The vector-based RAG is based on segmented regions which are labeled as vertices and geometric properties of adjacency relations are used to label edges. However, the approach is limited once segmented regions change with image transformations. Besides, it uses few model classes to localize symbols in technical documents.
4.3 Syntactic approaches
Syntactic descriptions of theories and models are at least as powerful for philosophical analysis as descriptions in semantic approaches. Syntactic descriptions are at least as language independent as semantic descriptions. Non-standard models do not pose a severe problem for syntactic descriptions. Syntactic descriptions can be as simple as semantic descriptions, and as close to actual scientific theories (281). Considering graphical symbol recognition, the syntactic approaches are based on formal notions of composition associated with a grammar. The two-dimensional description of the symbols induces the use of graph grammars (61; 282). The symbols are recognized by checking whether the representation can be generated by grammar. These methods are powerful tools but they required few noisy data and are especially useful in applications symbols where the shape of the symbols can be accurately described by a rule-set (grammar). Rosenfeld provided a detailed explanation about array, tree and graph grammars (283). In (284), graph grammars can be extended to interpret complex diagrams. Graph grammars were first derived to diagram recognition and limited to rather simple analysis of local symbol configurations. In this paper, the build-weed-incorporate (BWI) programming style for graph grammars was introduced. This shows an idea about interaction among physically distant symbols, which is semantically important. A quick survey about graph grammars is found in (285).
Computer aided design (CAD) projects are based on a human design with well-established rules of composition for a descriptive semantics. The quotation of industrial designs, for example, follows specific rules and therefore can be completely described by a two-dimensional grammar (59;286) or by plex grammars (287). In (59), the authors represent syntactic analysis of the dimensions by representing undirected, labeled graphs called webs. Based on the conventions of web grammar, a set of rules is established. These rules specify how all the possible dimension-sets can be generated and detected. Plex grammars are quite powerful and general in nature since they combine the power of string-, tree-, and web-grammars as sub-cases. The only possible relation between primitives in a string produced by a grammar is the concatenation of relations. A more effective approach is to incorporate relations into string representations which are more general than concatenation. However, the schema is very restricted if higher dimensional patterns are to be described (288).
Using grammar, diagram interpretation and full syntactic analysis of engineering drawings have attracted the interest of the researchers (289;290). In (289), attributed programmed graph grammars were introduced in this paper and their application to the interpretation of schematic diagrams was proposed. In this work, the grammar is used as a generative tool to extract a description of an input diagram. Author studied two classes of diagrams: circuit diagrams and flowcharts. In (290), the authors proposed a methodology to interpret engineering drawings, which is based on the combination
226 2 ⇒
circle1 corner1 corner2
****************************start 226_2. type(primitive1, circle1); type(primitive2, corner1); type(primitive3, corner2); East(primitive1, primitive2); East(primitive1, primitive3); North(primitive2, primitive3); ****************************end 226_2. (a) A symbol and its visual primitives (b) First order logic description
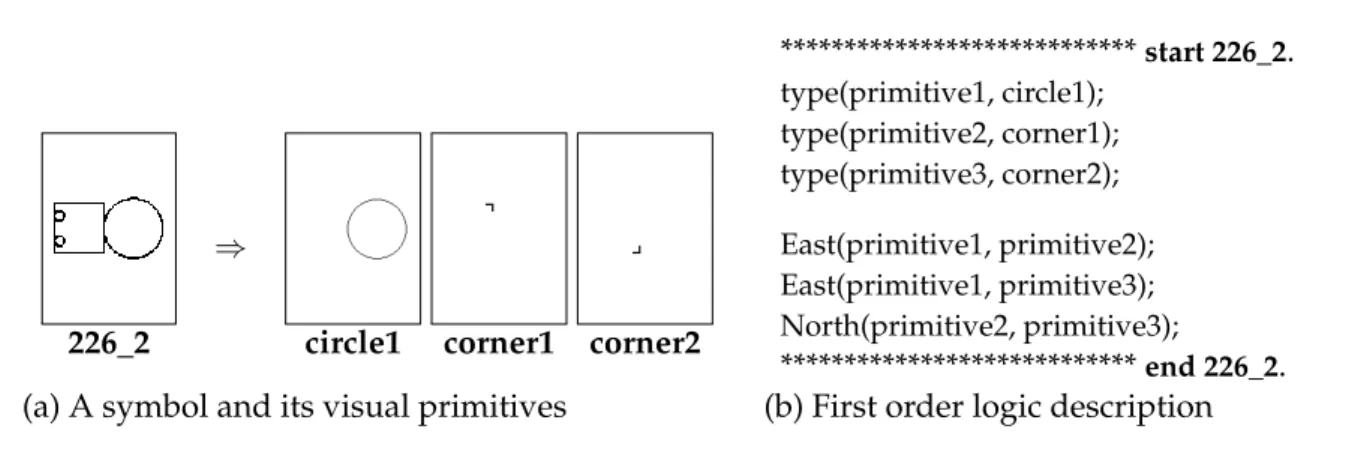
Fig. 16. An example of a formal description (64). It uses spatial relations to define the how the primitives are connected.
of schemata describing prototypical drawing. They constructed it with a library of low-level image analysis routines and a set of explicit control rules by using parser.
Texture recognition in architectural plans can be taken as another support for building graph grammars (291). In their work, a graph grammar is constructed to model textured symbols by inferring a graph grammar from a structured texture, and the subsequent parser to decide whether a symbol is accepted by the grammar. They defined a textured symbol as a symbol consisting of repetitive structured patterns. The grammar is based on a region adjacency graph representation of the vectorized document and the productions are based on the neighboring relations of the patterns forming the textured symbol. Later, in (292), the work has been extended to compute a representative among a class of shapes (i.e., a clustering procedure) in the graphics recognition domain. Few approaches were integrated in the process of vectorization (214) to allow a gradual simplification of data by extraction of the basic shapes to be used in the second step. Other approaches combine structural and syntactic appearance to improve the recognition of specific symbols in documents rich in graphics (217).
Yajie et al. 2007 proposed a novel syntactic symbol recognition approach to the vector based symbol recognition problem (293). In contrast to existing syntactic approaches, which usually describe the geometric relations among primitives, their method formulates a new model to describe the geometric information of a primitive with respect to the whole symbol object based on mathematical analysis. The mathematical model is theoretically rotation and scale invariant and experiments show its accuracy for vector based symbol recognition.
Very recently, in (64), the authors reported the use of formal learning techniques to characterize symbols. The method uses an inductive learning programming (ILP) tool to automatically learn non-trivial descriptions of symbols, based on a formal description. The overall goal of the approach is to express graphical symbols by a number of primitives that may be of any complexity (i.e. not necessarily just lines or points) and connecting relationships that can be deduced from straightforward state-of-the art image treatment and analysis tools. An example of a formal description is shown in Fig. 16. This representation is then used as an input to an ILP solver, in order to deduce non obvious characteristics that may lead to a more semantic related recognition process. For evaluation, it uses a subset of composite symbols from FRESH dataset, as reported earlier.
On the whole, based on the literature, we have found that the syntactic approaches are limited and are varied from one application to another. One of the primary reasons is that it is not trivial to transform statistical signatures into spatial predicates such as disconnected, inside, left and right. The transformation is also inaccurate and thus the image description does not carry complete information.
5. Summary
In this article, we have revised a very challenging research topic: graphical symbol recognition – a sub-field of a larger research domain i.e., pattern recognition – which has been considered as a key problem toward content understanding and interpretation of technical document. In general, starting with its definition, we have discussed basic steps used in state-of-the-art methods, major applications, research standpoints based on several dedicated methods for symbol recognition.
In the 60s and 70s, the resource constrained machines did not allow the use of complex recognition techniques (294) and few data were processed. Since then, the development of more powerful computer machines, interactions between disciplines and the introduction of new applications (data mining, creating taxonomy of documents) led the development of several concepts (41). Graphics recognition has had an extremely rich state-of-the-art literature in symbol recognition and localization since the 70’s (9; 34). In the literature, state-of-art methods are categorized into three approaches: statistical, structural and syntactic.
Based on our comprehensive review, statistical approaches are best suited to recognize isolated symbols since they are robust to noise and occlusions. As a consequence, deformed and degraded symbols are recognized well. Statistical signatures are simple (1D vector) to compute with low computational cost. However, as said before, discrimination power and robustness strongly depend on the selection of an optimal set of features as well as proper fusion of classifiers. In contrast, structural approaches are particularly well suited for recognizing complex symbols. For example, they are designed to recognize region-of-interest (graphical symbol, for instance) in a technical document. Structural approaches are based on symbolic data structures such as strings, trees and graphs. Graph matching has been found as a prominent tool in the state-of-the-art methods even though it suffers from high computational cost. As a reminder, graph matching cost often increases when complex and composite symbols are taken for studied due to the well known subgraph isomorphism problem. Further, graph size variability (due to presence of noise and possible distortions) is another cause to increase graph matching cost. Unlike statistical approaches, structural approaches provide a powerful representation, conveying how parts are connected to each other, while also preserving generality and extensibility. The latter term ’extensibility’ lets the method can be integrated to other methods from other approaches. Besides, error-prone raster-to-vector conversion is another common drawback. This refers to the primitive extraction step, which is application dependent and therefore, one can focus on unique primitives that are useful for discriminating symbols in that particular application. Therefore, graphs vary from one application to another: proximity graph and line graph, for instance. Note that proximity graph uses interest points (using local descriptors) while, line graph uses lines extracted from the whole document. The latter graph is well suited for technical line drawing images. Syntactic approaches describe symbols (or technical documents) by using well mastered grammars (or rule-set). Needless to say, they use similar primitives as in structural approaches. Interestingly, the syntactic description is close to the language used for human understanding (first order logic description as shown in Fig.16). But, statistical signatures to spatial predicates transformation may not carry precise metrical details. As a consequence, syntactic approaches do not possess in depth details for recognizing complex documents. Hybrid approaches are basically designed to improve the performance of the system since not a single method (either from statistical, structural or from syntactic) provides a satisfactory performance. Hybrid approaches try to integrate best of the two worlds: structural and statistical, for instance. These are often dedicated to the localization of a particular symbol according to specific rules or to target a set of arbitrary symbols. Note that the concept used in hybrid approach is different than concept of integrating descriptors and classifiers.
The methods or concepts have been tested in accordance with the context i.e., defined problem and the provided dataset. The recognition problem is fairly straightforward. It is a process where two (test and model) symbols are matched to check their similarity. The test symbol is said to be recognized as the model from which the highest similarity score is produced. This process can be extended to retrieval if a test query retrieves similar symbols and short lists them based on the decreasing order of similarity. Other works are positioned in different context, where they address the recognition of graphical elements and the localization of significant or known visual parts of a document image. The latter problem has been considered as a symbol spotting, which is basically guided by user queries. Query can be a isolated test symbol or just a graphical element that signifies the common property of a group of train symbols. To evaluate the proposed methods, common performance measurement tools are recognition rate (accuracy), precision and recall, F-measure, ROC curve, and confusion matrices (295). Computing these evaluation metrics (precision and recall) is not obvious when ground-truths are uncertain and missed (296). Further, retrieval efficiency is considered as a retrieval quality measure in case of datasets where the number of similar symbols (i.e., ground-truth) varies a lot from one query to another (imbalanced but labelled ground-truths) (297). The context often happens in real-world problem and has been recently studied (27).
Even though state-of-the-art methods are not generic in nature, applications in graphical symbol recognition are not limited. For example, arrow detection, which is basically designed for technical documents (16), has recently been considered as an important step in biomedical images to advance the CBIR problem (298). In both cases, they aim to address regions-of-interest. This is an example that attests the fact that graphical symbol recognition problem can attract a large audience.
Acknowledgements
The authors would like to thank the NIH Fellows Editorial Board for their editorial assistance.
6. References
[1] L. A. Fletcher and R. Kasturi. A robust algorithm for text string separation from mixed text/graphics images. IEEE Transactions on Pattern Analysis and Machine Intelligence, 10(6):910–918, 1988.
[2] G. Nagy. Twenty Years of Document Image Analysis in PAMI. IEEE Transactions on Pattern Analysis and Machine Intelligence, 22(1):38–62, January 2000.
[3] Rangachar Kasturi, Lawrence O’Gorman, and Venu Govindaraju. Document image analysis: A primer. Character Recognition, 27(1):3–22, 2002.
[4] K. Tombre. Analysis of Engineering Drawings: State of the Art and Challenges. In Tombre and Chhabra (299), pages 257–264.
[5] K. Tombre. Ten Years of Research in the Analysis of Graphics Documents: Achievements and Open Problems. In Proceedings of 10th Portuguese Conference on Pattern Recognition, Lisbon, Portugal, pages 11–17, March 1998.
[6] J. Lladós, E. Valveny, G. Sánchez, and E. Martí. Symbol Recognition: Current Advances and Perspectives. In D. Blostein and Y.-B. Kwon, editors, Graphics Recognition – Algorithms and Applications, volume 2390 of Lecture Notes in Computer Science, pages 104–127. Springer-Verlag, 2002.
[7] Karl Tombre. Graphics recognition: The last ten years and the next ten years. In Proceedings of 6th IAPR International Workshop on Graphics Recognition, Hong Kong, pages 422–426, 2005.