HAL Id: insu-00671964
https://hal-insu.archives-ouvertes.fr/insu-00671964
Submitted on 2 Apr 2012HAL is a multi-disciplinary open access archive for the deposit and dissemination of sci-entific research documents, whether they are pub-lished or not. The documents may come from teaching and research institutions in France or abroad, or from public or private research centers.
L’archive ouverte pluridisciplinaire HAL, est destinée au dépôt et à la diffusion de documents scientifiques de niveau recherche, publiés ou non, émanant des établissements d’enseignement et de recherche français ou étrangers, des laboratoires publics ou privés.
Gold Solubility in Arc Magmas: Experimental
Determination of the Effect of Sulfur at 1000°C and 0.4
GPa
Sébastien Jégo, Michel Pichavant
To cite this version:
Sébastien Jégo, Michel Pichavant. Gold Solubility in Arc Magmas: Experimental Determination of the Effect of Sulfur at 1000°C and 0.4 GPa. Geochimica et Cosmochimica Acta, Elsevier, 2012, 84, pp.560-592. �10.1016/j.gca.2012.01.027�. �insu-00671964�
Gold solubility in arc magmas: Experimental determination of the
effect of sulfur at 1000 °C and 0.4 GPa
Sébastien Jégo ab c Michel Pichavantc
a
Department of Earth Science, Rice University, 6100 Main Street, MS-126, Houston, TX 77005, USA
b
Institute of Earth Sciences, Academia Sinica, 128 Academia Road, Sec. 2, Nankang, Taipei 11529, Taiwan, ROC
c
Institut des Sciences de la Terre d‟Orléans (ISTO) – CNRS: UMR6113 – INSU – Université d‟Orléans, France
Abstract
To investigate the behaviour of gold in sulfur-bearing hydrous intermediate calc-alkaline melts under different redox states typical of subduction-zone settings, we have determined the solubility of Au at 0.4 GPa and 1000 °C for three dacitic magmas (two adakites and one calc-alkaline composition) from the North-Luzon Arc (Philippines). The experiments were performed over an oxygen fugacity (fO2) range corresponding to reducing (∼NNO−1), moderately oxidizing (∼NNO+1.5) and strongly oxidizing (⩾NNO+3) conditions as
measured by solid Ni–Pd–O sensors. They were carried out in gold containers, serving also as the source of gold, in presence of variable amounts of H2O and ∼1 wt.% of elemental sulfur (S). Concentrations of Au in glasses were determined by laser-ablation inductively-coupled plasma mass spectrometry (LA-ICPMS). Gold solubility in S-bearing melts is drastically enhanced compared to S-free melts, by up to two orders of magnitude. In addition, very high gold solubilities are reached under reducing conditions (<NNO−1) in Fe-poor, S-rich, sulfide-saturated melts probably as a result of an increase of fH2S, and a strong increase of gold solubility is observed at the sulfide/sulfate transition (from ∼NNO+1.25 to NNO+1.6) due to the destabilization of sulfides and the increase of melt S2− concentration. Thermodynamic modelling of the experimental results suggest that the dissolution of gold in silicate melt is the result of a combination of various gold species (Au0, Au2O, Au2O3, Au2S3, Au2(SO4)3, and Au2FeS2) present in the melt in variable proportions, depending on the three parameters considered in the model – log fO2, log fS2 and log XFeS – which are the main variables controlling the dissolution of gold in melt under our experimental PTX conditions. Our modelling shows that Au2FeS2 is the main gold species dissolved under reducing conditions (i.e., S6+/Stotal ∼ 0), whereas at sulfate saturation gold is mainly dissolved as Au metal and Au2O. The present study shows that sulfide undersaturation of primary mantle magmas or/and highly oxidizing conditions are not required for metal mobilization from the source, since gold enrichment in evolving arc magmas and exsolving fluid phases is likely to occur over a wide range of fO2 at sulfide saturation, from ΔNNO<−1 to the sulfide–sulfate transition (i.e., NNO+0.5–2.0); nevertheless it is critically controlled by variations of fS2 and fH2S. The role of Au-enriched slab partial melts and slab-derived aqueous fluids, and the importance of the abundance of sulfur in the source for an early gold enrichment in the melt, are emphasized.
1. Introduction
On a worldwide scale, Au–Ag–Cu–Mo epithermal and porphyry-type deposits are spatially and temporally associated with intrusive arc magmatism ( [Sillitoe, 1989], [Sillitoe and Bonham, 1990], [Sillitoe, 1997], [Ulrich et al., 1999] and [Halter et al., 2002]), and it is generally accepted that such deposits result from a combination of magmatic and hydrothermal processes ( [White and Hedenquist, 1990], [Hedenquist and Lowenstern, 1994] and [White and Hedenquist, 1995]). Magma bodies may chemically contribute to the mineralizing systems by supplying elements which, upon volatile exsolution, are transferred into the magmatic-hydrothermal fluid phase. However, the origin of metals (Au, Ag, Cu, Mo) in epithermal and porphyry-type deposits has long been a subject of debate, with metallogenic models dividing in essentially two groups, one group suggesting that metals originate in country rocks (e.g., [Keays and Skinner, 1989] and [Mathur et al., 2000]), and a second group of models considering that magmatic intrusions constitute the source of metals. These can be pre-concentrated through igneous differentiation processes, before being transferred to the magmatic-hydrothermal fluid phase ( [Ulrich et al., 1999], [Halter et al., 2002] and [Harris et al., 2003]). Certain components of hydrothermal fluids such as halogens and sulfur originate from magmatic sources (Hattori and Keith, 2001). The observation that primary ore minerals are predominantly sulfides (e.g., Kesler et al., 2002) has led to the suggestion that sulfur may play an important role in metal enrichment processes at the magmatic stage ( [Sillitoe, 1997] and [Mungall, 2002a]). More specifically in the Philippines, [Imai, 2002] and [Imai, 2004] reports that sulfur is systematically present in all Au–Cu deposits of the North Luzon arc, either as sulfide minerals (chalcopyrite, pyrite, bornite, pyrrhotite) or as sulfate
(anhydrite) – reflecting an evolution of the redox state within single deposits.
Previously, the solubility of noble metals, including gold, was studied in basaltic liquids saturated with sulfides (ΔFMQ < −1) and sulfates (ΔFMQ ⩾ +1.9) at 1300 °C and 1 GPa (Jugo et al., 2005a), although these data were not given in detail. Several other experimental studies have focused on the quantitative evaluation of Au partitioning between Au metal, rhyolitic or basaltic melts, coexisting fluids (vapour/brine) and sulfides (crystal/melt) in S-bearing magmatic assemblages ( [Bezmen et al., 1994], [Fleet et al., 1996], [Fleet et al., 1999], [Crocket et al., 1997], [Jana and Walker, 1997], [Jugo et al., 1999], [Simon et al., 2007], [Simon et al., 2008] and [Bell et al., 2009]). Recently, Botcharnikov et al. (2010) presented the first experimental Au solubility data in S-bearing hydrous intermediate (i.e., andesitic) silicate melts at 1050 °C and 0.2 GPa under fO2 close to the Ni–NiO (NNO) buffer. However, none of those studies considered the effect of a variable oxidation state on the behaviour of gold in sulfur-saturated melts. In contrast, Jégo et al. (2010) investigated the dissolution mechanism of gold in S-free hydrous intermediate (i.e., dacitic) silicate melts at
1000 °C and 0.4 GPa over a wide fO2 range (from ∼NNO−1.5 to ∼NNO+2.6), and showed
that the addition of sulfur under reducing conditions (∼NNO−1) dramatically enhanced the solubility of gold (by a factor of 25–85) in comparison with S-free melts at the same fO2. Their data, together with those of Botcharnikov et al. (2010), suggest a positive correlation between the concentrations of Au and S dissolved in the melt under reducing conditions (i.e., sulfur occurring mainly as S2− species). In addition, Botcharnikov et al. (2011) explored the effect of variable redox conditions (from FMQ−0.4 to FMQ+3.3) on gold solubility in hydrous basaltic and andesitic melts at 1050 °C and 0.2 GPa, and found that Au solubility in silicate melts is highest within a narrow window of fO2 characterized by the transformation of sulfide to sulfate species in the magma.
In this study, we use an experimental approach to explore the hypothesis that S-bearing magmas have the ability to pre-concentrate Au at the magmatic stage and, therefore, represent Au-enriched magmas over a wide range of ƒO2. A comprehensive experimental dataset is provided that allows to clarify the influence of S and its interplay with the effect of fO2 on the solubility of gold in dacitic silicate melts. The experimental results allow the transport
properties for Au in S-free and S-bearing magmas to be compared. They also place constraints on mechanisms of Au complexation in hydrous magmatic liquids of dacitic composition, typical of arc settings. The critical importance of both fO2 and fS2 on Au transport in S-bearing magmas is emphasized.
2. Starting materials and experimental strategy 2.1. Starting materials
Our experiments were performed in parallel on three natural samples, all from the North Luzon arc (Philippines), respectively representative of a typical adakite (Bal2), an
intermediate adakite (Pin Dac) and a typical calc-alkaline magma (PhM5) after the definition of Jégo et al. (2005) (a summary of this adakite classification is given in Jégo et al. (2010)). Recent (<20 Ma) magmatism in the North Luzon arc is linked to the current subduction of the South China Sea plate along the Manila Trench, and produces a range of arc rocks ( [Sajona and Maury, 1998], [Prouteau et al., 2000], [Yumul et al., 2000], [Bellon and Yumul,
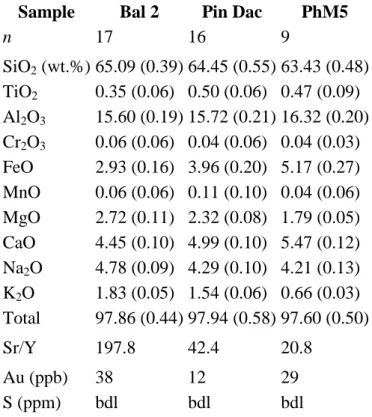
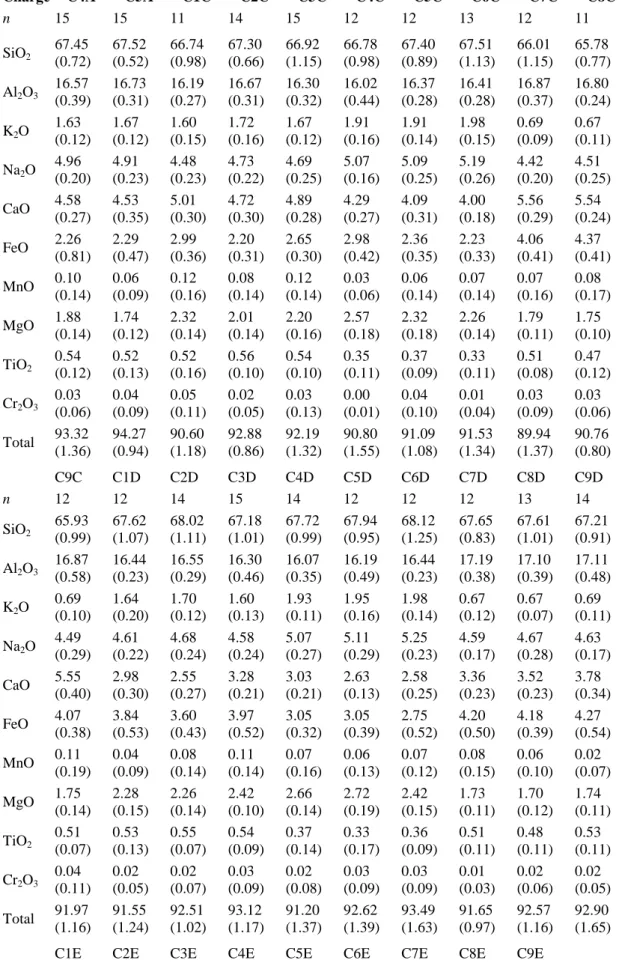
2001] and [Jégo et al., 2005]). World-class Cu–Au deposits are spatially and temporally associated with this recent magmatic activity, as shown by the chain of porphyry copper deposits extending from Dizon in the south to Lepanto in the north, and the epithermal Au deposits of the Baguio district ( [Bellon and Yumul, 2000], [Imai, 2001] and [Imai, 2002]). In the Baguio district, there is an intimate association between intrusive rocks and mineralization (Santo Tomas II Cu–Au porphyry and Antamok and Acupan epithermal Au deposits, [Imai, 2001], [Imai, 2002] and [Polvé et al., 2007]). The three starting rocks selected are all samples of this recent magmatic episode in North Luzon. Their respective sampling location and geochemical characteristics (major and trace elements) are described in detail by Jégo et al. (2010). It is worth stressing here, though, that the three starting samples have intermediate SiO2 contents, within a narrow range (63.4–65.1 wt.%, Table 1).
Sulfur contents in starting materials (double-melting glass) are below the detection limits of the electron-probe micro-analysis (EPMA) apparatus (Table 1; Section 3.4.1), i.e., less than 30 ppm. Besides the fact that we avoided starting samples containing anhydrite crystals, such low S contents are likely be due to volatilization and loss of sulfur during the preparation by double melting of the starting rock glass powder at 1400 °C in air. The bulk gold contents of our samples are quite low (12–38 ppb; Table 1), close to the detection limit (⩽10 ppb for ICP-MS, Toulouse, France); these Au concentrations are in the same range as those measured by Borisova et al. (2006) in the rhyolitic matrix glass of the Pinatubo 1991 white dacite
(22 ± 8 ppb). Note that the typical adakite Bal2 is the most Au-enriched.
2.2. Experimental strategy
The aim of this study is to investigate the effect of both sulfur and fO2 on the solubility of Au in hydrous intermediate silicate melts, in order to quantitatively evaluate their transport properties for gold at the magmatic stage (i.e., as opposed to the hydrothermal stage). The experiments complement and extend the study of Jégo et al. (2010) since they have been
performed on the same starting materials and in the same conditions of pressure and temperature.
To simulate conditions of evolution of intermediate arc melts as closely as possible in the experiments, a pressure of 0.4 GPa was chosen, and an elevated temperature (1000 °C), close to the liquidus of dacitic compositions such as the three starting rocks (e.g., Prouteau and Scaillet, 2003), was adopted. Hydrous conditions were imposed, the run temperature and pressure allowing the concentration of H2O in melt to be varied without inducing significant crystallization of silicate phases. The experimental fO2 was varied from relatively reducing (∼NNO−1), moderately oxidizing (∼NNO+1.5) to highly oxidizing (NNO ⩾ 3) conditions, in a range encompassing the fO2 of most of natural arc magmas. In order to explore the effect of sulfur saturation on Au solubility, all experiments reported in this study were performed with addition of elemental S.
3. Experimental and analytical methods 3.1. Experimental charges
Each of the three natural samples was ground in an agate mortar, then placed in a Pt crucible and fused at 1400 °C, 1 atm, in air for 4 h. Two cycles of melting were performed to produce chemically homogeneous glasses which were then crushed. About 30 mg of glass powder was loaded into pure gold capsules (2.5 mm ID, 2.9 mm OD, 15 mm length) after homogeneous mixing with ∼1 wt.% of pure elemental sulfur (S), together with variable amounts of deionized water (between 5 and 10 wt.% of the total charge), depending on the desired melt water content. The experimental capsules were welded shut with a graphite arc-welder, and then stored in an oven at 110 °C to ensure homogeneous water distribution and also to check for leaks.
In this study, the source of Au was the container capsule. Au is relatively inert with respect to Fe-bearing charges. The equilibration of charges with respect to the imposed fH2 is limited by the in-diffusion of H2 through the capsule and by the redox reactions inside the capsule. Au is known experimentally to be quite permeable to H2 at elevated temperatures (e.g., [Chou, 1986], [Gunter et al., 1987], [Linnen et al., 1995] and [Truckenbrodt and Johannes, 1999]; see also Jégo et al., 2010). For our experimental conditions (in particular temperature and Au capsule wall thickness), charges equilibrate with the fH2 imposed inside the pressure vessel in timescales of the order of 10 min ( [Scaillet et al., 1992] and [Schmidt et al., 1997]). This is much less than our experimental durations (∼100 h), and it shows that redox control was effectively achieved in our experiments (Jégo et al., 2010).
3.2. Oxygen fugacity sensors
Experimental redox conditions were determined by the solid sensor technique ( [Taylor et al., 1992] and [Pownceby and O‟Neill, 1994]). The sensor assemblage consisted of a mixture of metal M + Pd metal powders in variable proportions, plus metal oxide (MO). For experiments above the NNO buffer, Ni–Pd metallic alloys + NiO metal-oxide were used (i.e., M = Ni), and for experiments below NNO buffer, Co–Pd + CoO mixtures (M = Co). For each experiment, two pellets of the appropriate sensor assemblage were prepared, with a high and low M/Pd ratio, respectively. These were loaded into a 20 mm length Pt capsule containing ∼10 mg of deionized water, lined with ZrO2 powder to prevent alloying between the pellets and the capsule walls. The sensor Pt capsule was welded shut and stored for 24 h in an oven at 110 °C
to check for leaks, before being placed together with the experimental Au capsules inside a thin alumina tube sample holder.
3.3. Experimental equipment and procedure
All experiments were performed at 400 MPa and 1000 °C in a vertical internally heated pressure vessel (IHPV). Either a molybdenum or kanthal double-resistance furnace was used, allowing the 4–6 cm hot spot zone to be focused at the level of the sample holder, with a thermal gradient less than 2 °C across (Roux and Lefèvre, 1992). Temperature was measured by two sheathed chromel–alumel thermocouples, calibrated at 1 atm against the melting point of NaCl (800.5 °C), and is considered known to within ±5 °C. Total pressure was monitored by a factory-calibrated Heise gauge, accurate to within 20 bars. Redox conditions were imposed and controlled by the fH2 prevailing in the pressure vessel. The IHPV was
pressurized with either pure Ar gas or a mixture of Ar and H2 gases. In the case of pure Ar pressure medium, the intrinsic fH2 of the vessel is extremely low and imposes a very high fO2 (log fO2 ∼ NNO+3.4) when calculated under water-saturated conditions (i.e., aH2O = 1). To impose more reducing experimental conditions, Ar–H2 mixtures generated by sequential loading of H2 and Ar were used (see Scaillet et al. (1995) for additional details). Experimental redox conditions corresponding to log fO2 of the order of NNO+1 and NNO−1 were obtained by loading respectively about 1.5 bar and 15 bars of H2 gas in the vessel before Ar
pressurization and heating (i.e., at ambient P and T). The fH2 values reported in Table 2 correspond to values calculated from the fO2 of the sensors, i.e., to the experimental fH2. The experiments were rapidly quenched by electrically melting the Pt wire that suspended the sample holder in the vessel hot spot zone (Roux and Lefèvre, 1992; Di Carlo et al., 2006). This caused the sample holder to drop to the cold end of the vessel with quench rate of the order of 300 °C/s (Roux and Lefèvre, 1992). The duration of the runs was generally between 100 and 120 h. We show below that such durations are sufficient to produce experimental glasses with homogeneous Au concentrations believed to represent equilibrium values.
3.4. Analytical methods
After each experiment, the capsules were checked for leaks by weighing, then opened, and the experimental products were prepared for analysis.
3.4.1. Major and minor elements
Glass fragments were mounted in epoxy, polished successively to a final diamond grit of 1 μm, and coated with a ∼0.03 μm carbon film by using a standard thermal evaporation technique. Experimental glasses were analyzed for major elements with a Cameca SX50 electron microprobe (BRGM-CNRS facility, Orléans) equipped with five spectrometers. All data were obtained using 15 kV acceleration voltage, 6 nA beam current, a defocused electron beam (10 μm diameter) and peak counting times of 10 s. Multiple measurements were made for each sample (∼10 spot analyses) to increase analytical accuracy and check for the chemical homogeneity of the glasses. Natural reference minerals were used as standards. To minimize the effect of migration of the alkalis (Na, K) under the beam in hydrous glasses, the alkali concentrations measured in the glass were adjusted by applying a correction factor, function of the glass H2O content, determined as follows: the Na2O and K2O concentrations measured in the hydrous experimental glasses of a given starting composition (i.e., Bal2, Pin Dac or PhM5) and acquired during the same electron microprobe analytical session (to minimize the time-dependent instrumental drift) were plotted in a diagram [Na2O]glass or
[K2O]glass normalized to 100 wt.% vs. [H2O]glass (cf. Section 3.4.2 for the determination of [H2O]glass), together with the [Na2O]glass or [K2O]glass of the corresponding anhydrous starting composition taken as secondary reference for [H2O]glass = 0; in such a diagram, the data describe a well defined straight line with a negative slope, the absolute value of this slope representing the Na2O or K2O correction factor for hydrous glasses of a given starting composition and for a given analytical session. The [H2O]glass of a given charge is then multiplied by the corresponding correction factor, and the product is added to the non-normalized value of the [Na2O]glass or [K2O]glass of the charge; the result represents the corrected glass Na2O or K2O content of the charge.
The composition of silicate mineral phases present in some experimental charges (mostly clinopyroxene) was determined as above (15 kV acceleration voltage, 6 nA beam current, peak counting times of 10 s) and using a focused electron beam (∼1 μm diameter). The major element composition of oxide (magnetite) and sulfide (pyrrhotite) mineral phases was
determined using 15 kV acceleration voltage, 20 nA beam current, a focused electron beam (∼1 μm diameter) and peak counting times of 10 s. Hematite, pyrrhotite, anhydrite and pure metals were used as standards. We also intended to detect Au as a minor component in those oxides and sulfides. A counting time of 30 s and a beam current as high as 250 nA were used to reduce the limit of detection for Au. However, although a detection limit as low as 330 ppm (calculations after Ancey et al. (1978)) was obtained, no trace of Au was found. Attempts were also made to analyze the Au-nuggets (see below) despite their tiny size; the results confirmed that Au is the main component of these particles.
Sulfur in the starting glasses was measured by electron microprobe (JEOL JXA-8500F) in Taipei, Taiwan (IES-AS facility). Sulfur contents were always found to be below the
detection limit (Table 1), even when using 15 kV acceleration voltage, 50 nA beam current, a defocused electron beam (10 μm diameter) and peak counting times as long as 500 s. Such analytical parameters lower the limit of detection to less than 30 ppm S (calculated as three times the standard deviation of replicate measurements). Pyrite was used for calibration. Sulfur in experimental glasses was analyzed with a Cameca Camebax electron microprobe (BRGM-CNRS facility, Orléans) equipped with four spectrometers. This equipment, contrary to the SX50 probe, allows us to determine the concentration of a given element with each of the four spectrometers, simultaneously, leading to more accurate results. The data were obtained using 15 kV acceleration voltage, 50 nA beam current, a defocused electron beam (10 μm diameter) and peak counting times of 10 s. The detection limit corresponding to such analytical parameters is of the order of 80 ppm S (Clemente et al., 2004). The reduced to moderately oxidized experimental charges (runs No. 1, 3, 5 and 6;
NNO−1 < log fO2 < NNO+2; see Table 2 and Fig. 1) contain only sulfides (pyrrhotite). However, depending on the P–T–fO2–fS2 conditions and the silicate melt composition, saturation with a solid sulfide does not imply absence of an oxidized S species dissolved in the melt. Therefore, since the position of the Kα line is dependent on the valency of sulfur, both peaks corresponding to S2− and S6+ species were checked in those charges. The proportion of sulfur occurring as S6+ species appeared to be negligible, and so only the position corresponding to S2− was chosen for analysing the reduced and moderately oxidized charges. In contrast, the run No. 4 conducted under highly oxidizing conditions
(fO2 > NNO+3) contains sulfate (anhydrite) associated with magnetite at equilibrium, and the Kα position corresponding to S6+ was chosen for this charge. Three dacitic standard glasses were used for calibration, with respective sulfur contents of 750, 1400 and 1900 ppm S. The
analysis of these glass standards during each analytical session allowed calibration of the sulfur concentration as a function of the measured X-ray counts.
The Cameca Camebax electron microprobe was also used for determining the composition of the solid sensors. The metals analyzed were Ni, Co and Pd, together with Pt, Fe and S to check for contamination from the capsule. The data were obtained using 15 kV acceleration voltage, 21.5 nA beam current, a defocused electron beam (10 μm diameter) and peak counting times of 10 s. Pyrrhotite and pure metals were used for calibration.
3.4.2. H2O concentrations in experimental glasses
H2O contents of experimental glasses were determined by a Karl–Fischer coulometric titration method (Westrich, 1987). The apparatus employed was a Mettler Toledo KF DL 32
coulometer. For each experimental charge, multiple (at least three) measurements were made successively; the average of these multiple measurements and the corresponding standard deviation (±1σ) are reported in Table 2. For each measurement, a 5–10 mg fragment of silicate glass was placed in a Pt crucible before being melted at 1300 °C in 5 min in an induction furnace. The amount of water vapour released from the silicate melt was then measured in the titration cell of the coulometer. The analytical error of this method, even for very low water contents, is less than 0.1 wt.%, but a residual amount of ∼0.1 wt.% H2O has been shown to remain in the molten glass at 1100 °C ( [Westrich, 1987], [Holtz et al., 1992], [Holtz et al., 1995], [Behrens, 1995] and [Behrens et al., 1996]). Therefore, a correction was applied to the raw data by systematically adding 0.1 wt.% H2O to the measured water concentration for all charges. For crystal-bearing charges, the glass H2O concentration was calculated from the corrected value by subtracting the amount of crystals present, estimated by mass balance (see below).
3.4.3. Gold concentrations
Gold contents in experimental glasses were determined using laser ablation ICP-MS system at the Research School of Earth Sciences (RSES) of the Australian National University (ANU, Canberra). This system consists of a Lambda Physik LPX 1201 pulsed ArF excimer laser coupled to a Agilent 7500 ICP-MS (Sun et al., 2004). NIST 612 was used as the external standard, and the isotope 29 of Si (29Si) was used as an internal standard with Si being calibrated against concentrations measured by EPMA.
Each signal (cf. Fig. 2a) consists of a first part corresponding to background (laser off) and a second part corresponding to the actual measurement (laser on). The ablation was performed by laser drilling; thus the hole drilled becomes progressively deeper with time. The data were obtained using 22 kV acceleration potential, 120 mJ energy and a variable laser power from 0.6 to 1.3 W. The diameter of the laser beam and the pulsation frequency were optimized to 40 μm and 5 Hz, respectively, during 60 s, leading to a 20–25 μm deep hole. A background time of half the ablation time (i.e., 20 or 30 s) was chosen. At least three analyses were made for each experimental charge to check for homogeneity. The NIST 612 standard
(Au = 4.58 ppm; Sun et al., 2004) was used for calibration and the calculation of Au
concentrations. Besides gold and other noble metals, tantalum (Ta) was analyzed because this element may interfere with Au, following:
181
This interference was corrected for based on the Ta concentrations; nevertheless, the difference between uncorrected and corrected results ranges from −1% (some uncorrected values lying slightly below the corresponding corrected concentration) to 10%, within the analytical errors (see supplementary information in Sun et al. (2004)).
The detection limit (DL) for Au are shown in Table 2 for each experimental charge. Each analytical point of every charge has its own DL, although all analyses were conducted with the same laser beam diameter (40 μm). Here, the detection limits were calculated as three times the standard deviation of three replicate measurements of the background noise
(representative of the analytical blank). Therefore, for a given analytical point, DL may vary inversely with the duration of the flat (i.e., spike-free) part of the ablation signal used for the calculation of Au concentrations (cf. Fig. 2), relative to both standards and background. However, DL are always significantly lower than measured glass gold concentrations. The highest DL/[Au] ratio ([Au] being the gold concentration in glass) of our dataset is about 0.74 for one analytical point in charge C5A. Nevertheless, most charges have very low DL/[Au], in the range 2.10−4 to <0.07. Only the highly oxidized run (No. 4) shows higher ratios (max. 0.25–0.59 depending on the charge) resulting from both lower Au melt contents and higher DL values (due to a larger proportion of Au-nuggets in those charges than in more reduced ones). Moreover, the σ/[Au] values (σ being the statistic standard deviation of n replicate measurements of glass gold content in one charge) are generally low, most of the
experimental charges showing σ/[Au] values lower than or equal to 0.10. This demonstrates the high sensitivity of our gold concentration measurements and strongly suggests that gold is homogeneously distributed in our experimental glasses, a condition necessary for the
attainment of equilibrium in the experiments. In run No. 4, though, σ/[Au] ratios show higher values – up to 0.44 (charge C6D) – due to the abundance of Au-nuggets disseminated in the very oxidized melts, as shown in Fig. 2b, which adversely affect the LA-ICP-MS signal, and thus increase significantly the DL.
3.4.4. Analytical data processing
For each charge, water activity (aH2O) was calculated from the H2O content and the major element (excluding S) composition of glass, using the model of Burnham (1979). Oxygen fugacity (fO2, referenced to the NNO equilibrium at 0.4 GPa standard pressure and 1000 °C standard temperature, Pownceby and O‟Neill, 1994) was calculated from both experimental
fH2 and fH2O (the latter obtained from aH2O), following the water dissociation equilibrium:
fO2=(KW·fH2O/fH2) 2
with Kw taken from Robie et al. (1978). Experimental fH2 was determined from the sensor capsule
since fO2 is known from the composition of the alloy phase ( [Taylor et al., 1992] and [Pownceby and
O‟Neill, 1994]) and H2O is present in excess (hence fH2O = fH2O°). The fO2 is known to better than
0.25 log units ( [Scaillet et al., 1995] and [Martel et al., 1999]).
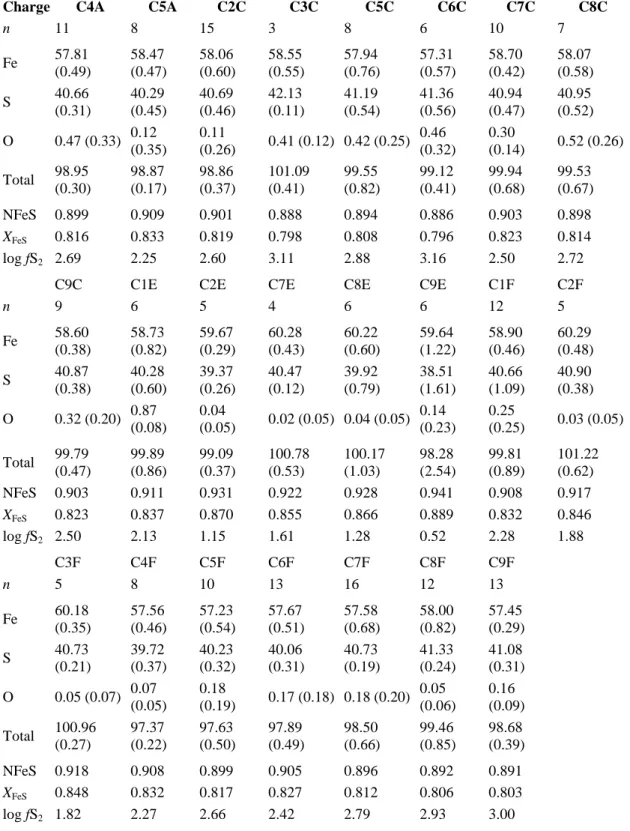
The fS2 in reduced/moderately oxidized charges was calculated at 0.4 GPa/1000 °C from the composition of pyrrhotite (i.e., XFeS; Froese and Gunter, 1976). The accuracy of the pyrrhotite analyses (see Table 5) allows this method of calculation to be used with our data.
The fS2 in highly oxidized charges was determined from mineral–melt equilibria involving the anhydrite + magnetite assemblage (cf.Appendix A.1).
The fSO2 and fH2S were obtained by assuming ideal mixing between all volatile species at equilibrium at the experimental pressure and temperature (i.e., 0.4 GPa/1000 °C). They were calculated from the following equilibrium reactions:
Thus, with the corresponding equilibrium constants K, it comes:
Values of fO2, fS2 and fH2O are known at 0.4 GPa standard pressure, and the equilibrium constants K3 and K4 are expressed as a function of the experimental temperature T (in K), according to Ohmoto and Kerrick (1977):
logK1=(18929/T)-3.783
logK2=(-8117/T)+(0.188logT)-0.352
The crystallinity of experimental charges was determined by mass balance, using the electron microprobe compositions of the starting glass and of all condensed phases present. The calculations were performed using a least-squares technique adapted from Albarède (1995) based on 8 major oxides, excluding MnO and H2O, the total being constrained to unity. Phase proportions were calculated together with model bulk composition.
4. Results
Results for a total of 38 S-doped charges (including six S-doped charges already presented in Jégo et al., 2010: C1E-C3E, C1F-C3F) are reported together with experimental conditions in Table 2.
4.1. Intensive variables (aH2O, fO2, fS2)
H2O contents in glass range from 3.44 to 8.03 wt.% (Table 2), with corresponding aH2O values ranging from 0.36 to saturation (i.e., aH2O = 1), the latter condition being attained in one charge only (C1F). The H2O concentration in Pin Dac melt at saturation is close to 8 wt.% (as shown by charges C1E and C1F, both at 8.03 wt.%). It differs little from the two other investigated melts, owing to their similar major element compositions (C4F (Bal2):
aH2O = 0.97 at 7.72 wt.% H2O; C8E (PhM5): aH2O = 0.95 at 7.94 wt.% H2O). Some H2 O-rich charges reported in Table 2 (e.g., C1E, C1F, C3F) have uncertainties (i.e., standard deviation of multiple H2O measurements) of about 1 wt.%, suggesting that water is less homogeneously distributed in these glasses than in the other charges; it is actually most probably due to the presence of trapped fluids (i.e., tiny bubbles) in those fluid-saturated
glasses, which may have led to slightly different bulk H2O contents after multiple measurements by KFT titration.
Oxygen fugacity values range from NNO−1.19 to NNO+3.55 (Table 2). A wide fO2 range has
thus been investigated, encompassing different redox conditions (Fig. 1; see Appendix A.2 for the calculation of stability fields): reducing (runs 5 and 6), moderately oxidizing (runs 1 and 3) and highly oxidizing (run 4). The calculated fS2 values vary by almost seven orders of magnitude (−3.76 < log fS2 < 3.16), while melt sulfur concentrations range from 256 to 2422 ppm.
4.2. Experimental products and compositions
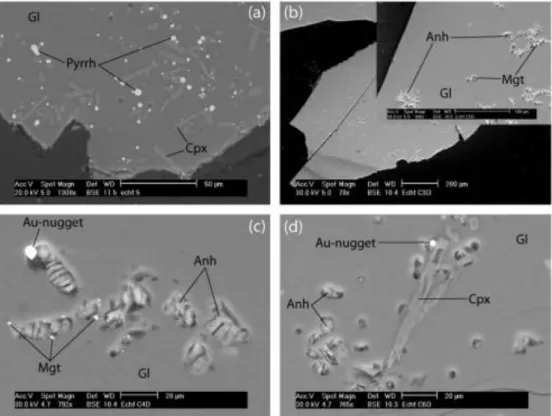
All experimental charges mostly comprise silicate glass, and some of them contain a small proportion (<5 wt.%) of crystalline phases (silicates, sulfides, oxides, sulfates, metallic phases, Table 2; see Fig. 3 for textures typical of most of our run products), in accordance with the (sub-)liquidus experimental conditions. Due to the relatively low solubility of S in silicate melts, which systematically induces the formation of a S-rich fluid phase at
equilibrium (mainly composed of H2S + SO2 + S2 + H2O), a vapour phase is considered to be systematically present (i.e., the system is fluid-saturated), even if the melt is strictly-speaking H2O-undersaturated (aH2O < 1) under the experimental conditions (see Section 3.4.4). Then, the presence of a vapour phase leads to significant partitioning of all components from silicate melt to vapour, notably gold (e.g., [Ulrich et al., 1999], [Sun et al., 2004] and [Simon et al., 2007]). Given the amounts of H2O initially loaded into the capsules, this vapour phase is present in very low amounts (<2–3 wt.% of the total charge). Additionally, most of the exsolved fluid phase is external to the glass bead, i.e., it is not trapped as bubbles or fluid inclusions. Therefore, gold concentrations obtained by ablating the glass are believed to truly reflect those in the melt, and not the combined melt + fluid gold contents. We did not examine here the partitioning of gold between melt and fluid since the main goal of the present study was to examine the effect of sulfur on the solubility and transport of gold in melt at the magmatic stage. Gold partitioning between fluid and melt has been investigated in a few previous studies ( [Frank et al., 2002], [Simon et al., 2005] and [Simon et al., 2007]).
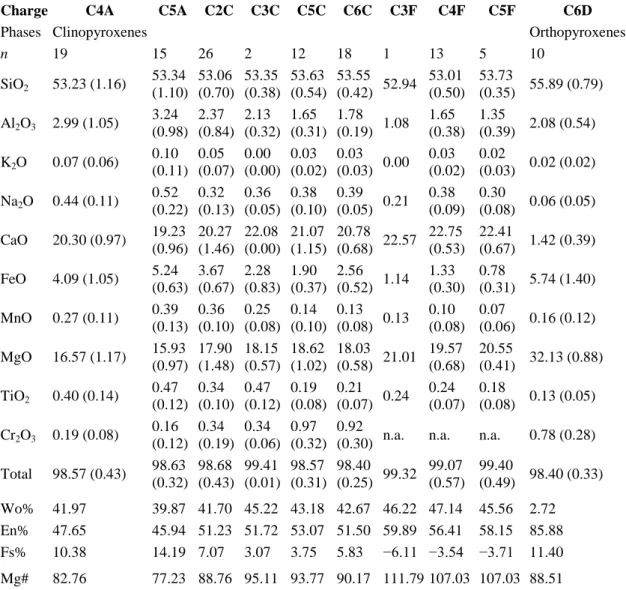
Diopside-rich clinopyroxene (cpx; Table 3), mostly less than 20 μm in size (Fig. 3a), appears as the silicate liquidus phase in several experiments. Nevertheless many charges from this study are silicate crystal-free. None of the PhM5 charges crystallized any silicate phase, suggesting a slightly lower liquidus temperature for this composition than for the two others. Enstatite-rich orthopyroxene (opx) occurs in small amounts in charge C6D, and constitutes the only silicate phase crystallized in run 4 (Table 2). The very oxidizing conditions of this experiment are certainly responsible for the
crystallization of opx, due to the fractionation of calcium by anhydrite (CaSO4) crystallization and to
the availability of iron because of sulfide instability. Oxides are found only in the most oxidizing experiment (run 4), often texturally associated with anhydrite; most have a size from <1 to a few μm (Fig. 3b and c). Satisfactory electron microprobe analyses were obtained for oxides from charges C3D and C7D–C9D (Table 4) and showed that these oxide phases are magnetites (mgt). Sulfides are present in every charge of the reduced/moderately oxidizing runs (Fig. 3a). They all have similar Fe/S atomic ratios, close to 1, implying that these sulfides are pyrrhotites (Fe1−xS, with 0 < x < 0.2; see
Table 5). No evidence was found (from the composition of sulfides) for the presence of an immiscible Fe–S–O sulfide liquid under our experimental conditions. About 2 wt.% of sulfate mineral phases (anhydrite) are found in every assemblage of the most oxidizing experiment (Table 2), commonly associated to mgt and Au–nuggets (Fig. 3c). Samples run at moderately oxidizing conditions
(∼NNO+1.5) contain sulfide phases. However, as shown in Fig. 1, these moderately oxidized charges plot very close to the anhydrite stability field.
Major element compositions of experimental glasses are given in Table 6. They are quite similar to their respective starting glass compositions, since the proportion of condensed phases is always very small in the run products and there was no substantial partitioning of major elements to the fluid phase. However significant depletions in FeO and/or CaO, and to a lesser extent in MgO, associated with slight enrichments in Na2O and Al2O3 occur in most glasses when compared to the respective
starting compositions, but still in accordance with mass balance calculations (see Table 1). These chemical changes are consistent with significant crystallization of pyrrhotite ± clinopyroxene in the reduced/moderately oxidized charges, whereas they are related to the crystallization of
anhydrite + magnetite in the most oxidized charges (run 4).
Tiny spherical gold-rich blebs (generally about 1 μm in size, hereafter designated as Au-nuggets) were systematically found spatially associated with magnetite in all charges of the most oxidizing experiment (run 4). Several Au-nuggets slightly larger in size were also found in close textural association with pyrrhotite, anhydrite and fluid bubbles (Table 2 and Fig. 3c and d). According to their common spherical shape, these gold-rich particles are thought to have passed through a liquid state during the experiment. They indeed contain variable (though low) amounts of additional metals (mainly Pt, Pd, Cr, Ni). Simon et al. (2007) also reported the presence of Au nuggets in their experimental charges from the analysis of their LA-ICP-MS ablation signals. However, the authors did not observe such gold particles in their run products, probably due to their sub-micron size, and Simon et al. (2007) considered these Au nuggets to be quench phases. In contrast, our SEM observations (Fig. 3c and d) suggest that the Au nuggets in this study are phases stable under our experimental P and T. In fact, the Au nuggets are systematically associated with magnetite and pyrrhotite crystals and fluid bubbles, suggesting that their appearance is related to the oxide/sulfide crystallization mechanism on the one hand and to the precipitation of Au from the fluid phase during fluid dissolution in the melting rock powder, as proposed by Botcharnikov et al. (2010), on the other hand. Heterogeneous nucleation at experimental conditions might also be at the origin of Au nuggets since the presence of gold particles in contact with other solid phases proves that there is substantial transport of gold through melt; but even in this case, the nucleation process requires gold saturation of the silicate melt. Therefore the gold melt concentrations truly represent the solubility of gold at run conditions. As illustrated by Fig. 3, Au-nuggets in our experimental products can be as large as ∼10 μm in diameter when in spatial association with sulfide crystals. Such grain sizes are unlikely for quench mineral phases, especially considering the characteristics of the quench in this study (isobaric and very fast, lasting <5 s). Therefore, we interpret the nuggets as having precipitated at experimental P and T, either from the fluid phase in the case of association with bubbles (Botcharnikov et al., 2010), or from a locally S–Fe–O-depleted, Au-saturated, 1–10 μm wide melt boundary layer
generated during growth of sulfides and oxides. This interpretation provides the justification for not considering the Au spikes in the ICP-MS ablation signals for the calculation of the gold melt concentrations since the nuggets were probably not formed during quench (cf. [Botcharnikov et al., 2010] and [Jégo et al., 2010]). Attempts have been made to calculate the gold melt contents with considering the Au spikes related to the Au nuggets, but the results were inconsistent with each others and aberrant (in some charges, at least three orders of magnitude higher than the contents reported here), whereas gold contents calculated by filtering the Au spikes out are very consistent with those calculated from Au spike-free ablation signals of a given experimental glass. In addition, our gold concentrations are in the
same order of magnitude than those of Botcharnikov et al. (2010) who also filtered the Au spikes out of the ablation signals of their experimental glasses.
4.3. Sulfur concentrations in glasses
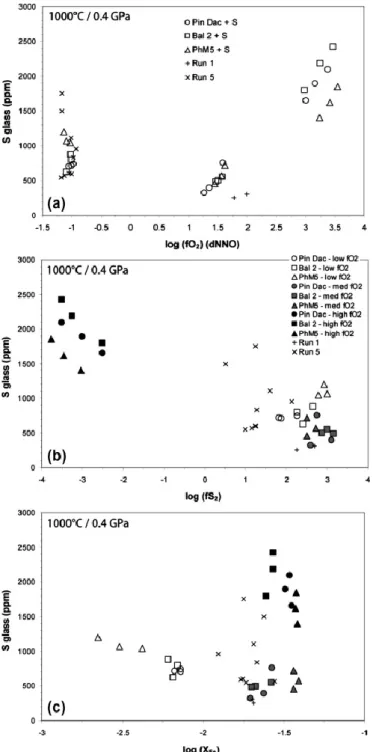
Sulfur concentrations in experimental glasses are detailed in Table 2. The distribution of sulfur contents as a function of fO2, fS2 and XFe for the three compositions is presented in Fig. 4.
In Fig. 4a, glass sulfur contents globally reproduce the classical inverted bell-shaped pattern of S solubility with varying fO2 (e.g., Clemente et al., 2004). Under oxidizing conditions (above ∼NNO+1), the S concentrations increase dramatically with increasing fO2, from ∼300 up to almost 2500 ppm, i.e., an increase of about one order of magnitude between
∼NNO+1.25 and ∼NNO+3.5. The high melt S solubility values under very oxidizing
conditions strongly suggest dissolution of sulfur in the form of sulfate species (i.e., ). In contrast, the strong increase of melt S contents between NNO+1.25 and NNO+1.75 is likely due to the fact that, under oxidizing conditions, the highest S2− concentrations in melt are reached in the narrow range of fO2 at the sulfide–sulfate transition as a result of the
progressive destabilization of sulfides, as shown by Botcharnikov et al. (2011). Indeed, the two charges from run 1 (Pin Dac composition) do not plot along this trend and show very low S contents at NNO+1.75–2.0; as discussed below (cf. Section 5.3.2), these significantly lower sulfur solubility values are interpreted to be the result of the rapid decrease of the melt S2−/S6+ ratio from ∼NNO+1.7. Under reducing conditions, glass S contents range from ∼600 to 1200 ppm (or ∼550 to 1750 ppm including data from run 5) at a nearly constant fO2 around NNO−1. This wide range of S concentrations for a nearly constant fO2 suggests that other parameters – such as fS2, fH2S, or the mole fraction of Fe2+ in melt – control S solubility. For instance, Clemente et al. (2004) report that the dependence of S solubility on fO2 changes markedly with fS2, which also may be the case in the present study. Also, the large variation of S concentrations in our reduced charges (run 6) may be related to the combined effects of decreasing melt FeO contents (Table 6) and increasing fH2S (Table 2), as reported by Clemente et al. (2004) for sulfide-bearing charges.
In Fig. 4b, highly oxidized charges show very low fS2 values and their melt S contents decrease with increasing fS2, which confirms that in these glasses the main sulfur species is
and S dissolution is mostly controlled by fO2. Both reduced and moderately oxidized charges show much higher fS2 values (by more than four orders of magnitude). Moreover, the sulfur concentrations in the reduced ones seem to be positively correlated to fS2, which is consistent with the hypothesis that S is principally dissolved as sulfide in these melts. Also, the observations made about the moderately oxidized glasses (i.e., S contents positively correlated with fO2, but very high fS2) confirm that sulfur in these charges is close to the transition sulfide/sulfate. Fig 4c shows that iron is only slightly fractionated from the melt in experiments performed above NNO+1 (the initial log(XFe) of the starting compositions range between −1.57 and −1.44), to form either minor magnetite or sulfide mineral phases. In contrast, the reduced charges show significantly lower XFe values indicating a strong fractionation of iron to form pyrrhotite crystals, as confirmed by mass balance calculations (Table 2). The fact that melt S contents tend to increase with decreasing XFe in reducing conditions suggest that iron becomes too depleted in the silicate melt to crystallise additional sulfides, which facilitates the incorporation of sulfur into the melt. This observation has also been made by Clemente et al. (2004) in reduced rhyolitic experimental glasses.
No major difference in sulfur solubility was noted between the three compositions under reducing and moderately oxidizing conditions. As discussed above, only the non-adakitic charges (i.e., PhM5) are significantly S-enriched compared to the adakitic charges at
∼NNO−1, most likely due to their higher fH2S and very low FeO contents. Above ∼NNO+3,
S concentrations seem to correlate with the degree of adakitic imprint (i.e., value of bulk rock Sr/Y ratio; Table 1; cf. [Jégo et al., 2005] and [Jégo et al., 2010]) of the starting materials for a given fO2 (i.e., [S]Bal2 > [S]Pin Dac > [S]PhM5). However, in these anhydrite-bearing charges, the NK/A ratio (i.e., molar (Na + K)/Al) of Bal2 melts is the highest (∼0.70), followed by Pin Dac melts (∼0.60) and then PhM5 melts (∼0.50). Thus it appears that the degree of alkalinity of these melts is correlated to their degree of adakitic imprint. According to the experimental results of Scaillet and MacDonald (2006), melt sulfur contents are strongly dependent on the alkalinity of silicate melts; they report that peralkaline melts can, at all fO2, dissolve 5–20 times more sulfur than their metaluminous equivalents. These observations therefore suggest that the differences in S solubility in our highly oxidized charges are related to their respective degree of alkalinity, rather than their adakitic imprint.
4.4. Gold concentrations in glasses
Gold contents in experimental glasses are presented in Table 2. Concentrations have been recalculated as mole fractions of Au dissolved in melt (XAu) by using glass major element concentrations together with water and sulfur contents from Table 2 and Table 6 (mole fractions were calculated considering ten oxides – SiO2, Al2O3, K2O, Na2O, CaO, FeO, MnO, MgO, TiO2, Cr2O3 – plus elemental monoatomic sulfur, S, and Au, excluding H2O).
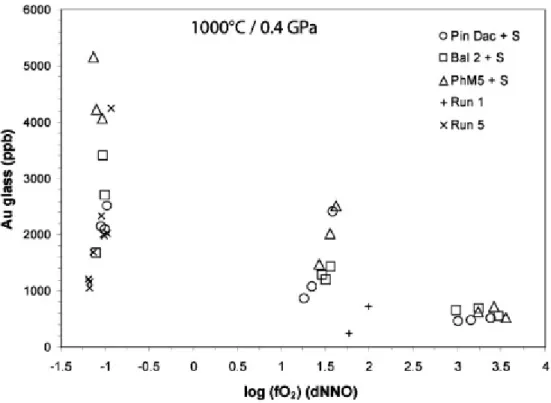
The distribution of gold contents as a function of fO2 for the three compositions is shown in Fig. 5. The first intuitive but important observation is that, in sulfur-bearing systems, gold behaves differently according to the redox state considered. Under reducing conditions (∼NNO−1), gold contents vary greatly at sub-equal fO2, ranging from ∼1700 to ∼5200 ppb (or from ∼1000 ppb considering „run 5‟ charges), i.e., by more than a factor of 3. Under moderately oxidizing conditions (∼NNO+1.5), a very strong positive correlation is observed between melt Au contents and fO2, with concentrations ranging from 865 to ∼2500 ppb Au (i.e., by almost a factor of 3 too) over 0.35 log fO2 unit only. Such a trend may suggest a mechanism of gold dissolution based on oxidized species (e.g., Au3+ or Au1+) along this fO2 range. As for sulfur (Fig. 4a), the two charges from run 1 show much lower gold contents, comparable to those observed under very oxidizing conditions (ΔNNO > 3) where gold concentrations (460–720 ppb) are the lowest of the experimental set and do not display any significant variation with increasing fO2. Comparing the three starting compositions, no major difference in Au solubility is observed at given fO2 under oxidizing conditions (ΔNNO > +1); only the PhM5 reduced charges (∼4000–5200 ppb Au) are significantly more gold-enriched than the two other compositions (1700–3400 ppb Au), as also noted above for sulfur (Fig. 4). Thus, from the preceding observations, it is worth stressing that (1) gold solubility in sulfur-bearing melts shows a larger scatter and reaches much higher values in reducing conditions than at fO2 > ∼NNO+1.75 and, (2) gold and sulfur behave similarly with varying fO2 in reducing/moderately oxidizing conditions (i.e., ΔNNO < 2), but seem independent from each other under very high fO2.
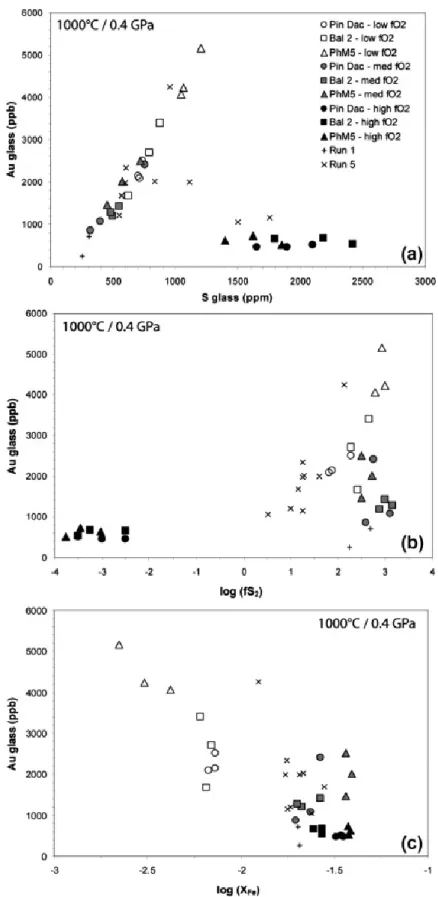
These important results are confirmed by the distribution of gold contents as a function of melt sulfur contents (Fig. 6a). A very well defined positive correlation is indeed observed between Au and S both in the reduced and moderately oxidized charges, with contents
ranging from ∼250 to 5200 ppb and ∼250 to 1200 ppm respectively. Such a trend strongly suggests an effective complexation between both elements in the melt over a wide range of
fO2 (at least −1.5 < ΔNNO < +2). In contrast, melt gold concentrations display no variations with increasing sulfur content in highly oxidizing conditions. Fig. 6b shows a clear
dependency of melt Au contents on fS2 under reducing conditions, suggesting that gold dissolution is mainly controlled by fS2, but no particular trend is observed in moderately and highly oxidizing conditions. Intermediate-fO2 charges show fS2 as high as the reduced ones, though, despite significantly lower melt Au contents; this likely confirms the presence of both oxidized gold species and Au–S complexes in this fO2 range. The very low fS2 values of the highly oxidized charges imply that at ΔNNO > 3 Au dissolves either as oxidized gold species or/and as gold–sulfate complexes, but their low melt Au contents suggest that the mechanism of dissolution is much less efficient than in more reducing conditions. In Fig. 6c, the absence of correlation between XFe and melt Au contents in moderately and highly oxidized charges suggest that gold dissolution is not significantly influenced by the concentration of total iron. In contrast, the strong increase of gold solubility associated with decreasing XFe – and
increasing melt S contents – in the reduced charges is consistent with complexation of gold with melt sulfide species while iron is sequestered into pyrrhotite crystals (cf. Section 4.3). Furthermore, this trend is inconsistent with a strong alloying of Fe with the Au capsule, which would lead to a decrease of the activity of metallic gold and would negatively affect its
solubility in melt. 5. Discussion
5.1. Attainment of equilibrium
Electron microprobe analyses of experimental glasses and clinopyroxenes have standard deviations in most cases lower than analytical uncertainties (Table 3 and Table 6), indicating that these phases are homogeneous in terms of their major elements. All glasses, except some from „run 5‟, also show homogeneous sulphur concentrations. For gold, the statistics of the Au analyses, detailed above, imply that gold is homogeneously distributed in our
experimental glasses. Time-series runs performed by Bezmen et al. (1994) showed that gold equilibrates between sulfide and mafic/intermediate silicate melts after 30 h at 1250 °C and 4 kbar, for a silicate charge weighing 300–350 mg; even if our experimental temperature is significantly lower, the attainment of equilibrium in our charges is strongly supported by these results considering a run duration of 100 h and a silicate mass more than 10 times less. For H2O in glasses, only bulk analytical data are available. However, multiple Karl–Fischer measurements were performed on each glass sample; absolute standard deviations (±2σ) are generally <1 wt.%, indicating homogeneity. Considering that glass powders were used as starting materials, the experimental durations in this study (>100 h) and the diffusivity data for of H2O in silicate melts of intermediate composition (Liu et al., 2004), water is expected to be homogeneously distributed in the experimental charges.
Nevertheless, it should be emphasized that all experimental glasses in this study attained their final gold concentrations from the low concentration side and that gold solubility was in no case approached from the high concentration side, since our Au concentration data have not been reversed. However, various lines of evidence, detailed below, suggest that the Au concentrations measured in the glasses can be considered as equilibrium solubilities at high P and T:
(1) Gold concentrations in experimental glasses from this study vary by more than a factor of 20, ranging from 253 to 5159 ppb (Table 2). Gold concentrations in glasses correlate with the
experimental parameters (Fig. 4), so that the variations in gold concentrations between samples can be ascribed to differences either in fO2, fS2, or S and FeO contents in the melt. This would be unexpected
if Au concentrations in glasses were significantly influenced by kinetic factors. The ability of the melt to homogenize with respect to Au can be tested by considering the amount of time required for Au to diffuse through the melt at run conditions. To our knowledge, there are no experimental data for Au diffusivity in silicate liquids, but Mungall (2002b) report modeled Au diffusivities estimated in several magmatic systems, with values going from 2.7 × 10⁻⁷ to 1.5 × 10⁻⁵ cm2 s−1 over a wide range of temperature (i.e., 1100–1600 °C). In our case, the section surface of our experimental charges is about 4.9 mm2 (Au capsule inner diameter = 2.5 mm) and the run duration is on average of 3.6 × 10⁵ s, which leads to a minimum Au diffusivity value of ∼1.36 × 10⁻⁷ cm2
s−1 for gold to diffuse throughout the whole silicate charge, i.e., twice lesser than the lowest Au diffusivity estimated by Mungall (2002b). These calculations strongly suggest that gold reached equilibrium in our experiments. (2) „Run 5‟ underwent an unusually slow quench, with a quench rate of the order of 50– 100 °C s−1. So, a “duplicate” experiment of same duration (run 6) was performed to check for reproducibility. Au contents in „run 5‟ charges are on average slightly lower than in „run 6‟ charges, but gold solubilities in these two experiments are mutually consistent and the results stress the direct dependence of gold solubilities either on glass S concentrations or fO2. We interpret these statistically
lower Au contents and the significant heterogeneity of S contents in some glasses of „run 5‟ (Table 2) as a result of the slow quench, isobaric fluid exsolution leading to the formation of micro-bubbles (observable in SEM pictures) and to a partitioning of gold and sulfur from the melt to the fluid phase. Thus, gold analyses gave lower results because the Au spikes corresponding to the Au-enriched micro-bubbles were filtered out of the ablation signals (the calculated Au concentrations corresponding therefore to the locally Au-depleted residual melt), and sulfur analyses show some heterogeneity because the amount of S-enriched micro-bubbles hit by the electron beam was different for each analysis.
(3) A fast quench device was used systematically. The Au nuggets present in some charges are interpreted to be stable phases present under our experimental P–T conditions and not precipitated during quench (the previous paragraph (2) shows that a slower quench rate does not lead to the formation of Au nuggets, but rather to fluid exsolution). Therefore, the gold concentration of the melt has not been modified during quench (except for „run 5‟), and we consider the Au concentration data to represent gold concentrations in the melts at high P and T.
5.2. Influence of sulfur on the solubility of gold: comparison with S-free data
Most previous S-free studies focused on the determination of the partitioning of gold between H2O-saturated rhyolitic silicate melt, sulfide, oxide, and magmatic aqueous phases ( [Frank et al., 2002], [Simon et al., 2003], [Simon et al., 2005] and [Simon et al., 2007]) rather than investigating its solubility in the melt. Besides, the experimental conditions or melt
compositions of the few studies reporting gold solubility data always differ significantly from ours, making any comparison difficult (see Jégo et al., 2010). For example, the solubility of gold in S-free, Cl-bearing, H2O-saturated haplogranitic melt at 800 °C, 1–1.5 kbar and fO2 around NNO is estimated at ∼500 ppb ( [Simon et al., 2003] and [Simon et al., 2005]), ∼1 ppm (Frank et al., 2002) and ∼2.5 ppm (Simon et al., 2007). Despite a significant
heterogeneity, also noted by Botcharnikov et al. (2010), all these values do fit quite well with our Au concentration range in the presence of sulfur.
However, the S-bearing dataset of the present study is directly comparable to our recently published S-free data (Jégo et al., 2010), since the starting material compositions and the experimental conditions were the same. Melt gold contents are significantly enhanced by the presence of sulfur along the whole fO2 range investigated in the two studies. However, it is worth stressing that the difference of gold contents between S-free and S-bearing glasses decreases with increasing fO2. Under reducing conditions (∼NNO−1 to 1.5), Au contents are substantially increased in bearing melts, by 1.5 up to 2 orders of magnitude compared to S-free melts. For more oxidizing conditions (∼NNO+1.5 to 2.5), this difference becomes smaller, about 1.5 to 0.5 orders of magnitude. At ΔNNO > 3, gold contents in S-bearing melts are not distinguishable from the extrapolated gold contents in S-free charges (cf. Jégo et al., 2010), suggesting that the presence of sulfur dissolved mainly as sulfate species SO42− does not influence significantly the solubility of gold in melt. Botcharnikov et al. (2011) also proposed that there is little difference in Au speciation between S-bearing and S-free systems under strongly oxidizing conditions.
Previous results of sulfur-bearing experiments in the literature are discussed below (Section 5.4).
5.3. Gold solubility and speciation in S-bearing silicate melts
5.3.1. Thermodynamic analysis of the solubility of Au in S-bearing silicate melts
Our gold solubility results were obtained at three discrete oxygen fugacities (Fig. 5), quite apart from each other (at least two log ƒO2 units). Each set of data exhibits different absolute concentrations, scatter and dependence on ƒO2, ƒS2 and XFe. Since natural magmas may lie anywhere between, we aim to propose one unifying model for gold dissolution in intermediate magmatic melts in presence of S. Regarding the speciation of gold in silicate melt, little work has been done to date. Only Borisov and Palme (1996) suggest Au1+ as the stable species in their very oxidized (10−7 < log fO2 < 10−3) S-free experimental silicate melts. They specify, though, that Au2O3 is known to be much more stable and is a common gold oxide. So, given the three valence states of gold observed in nature (i.e., Au0, Au1+, Au3+) and the preceding observations on the behaviour of gold and sulfur with ƒO2/ƒS2/XFe (cf. Sections 4.3 and 4.4),
an appropriate set of dissolved species may include Au0 (metal), and
, all together with sulfate complexes and , and iron sulfide
complexes and AuIIIFeS2.5. Each species concentration is then related to the gold activity (saturating metal), system fugacities and FeS mole fraction in melt (XFeS) as follows:
Au(metal)=[Au](melt)
2Au(metal)+1/2O2(gas)=[Au2O](melt)
2Au(metal)+3/2O2(gas)=[Au2O3](melt)
2Au(metal)+1/2S2(gas)=[Au2S](melt)
2Au(metal)+2O2(gas)+1/2S2(gas)=[Au2SO4](melt)
2Au(metal)+FeS(melt)+1/2S2(gas)=[Au2FeS2](melt)
Au(metal)+FeS(melt)+3/4S2(gas)=[AuFeS2.5](melt)
The measured gold solubilities in all experiments are a sum of abundances of all species present (on the right hand side), which are products of respective equilibrium constants and system variables – ƒS2, ƒO2 and XFeS. In our experiments, melts were equilibrated with pure gold metal (since no alloying of Fe with Au from the capsule was observed). Therefore, the activity and the mole fraction of gold in the metal can be taken equal to unity, and the equilibrium constants K‟s corresponding to each equation at constant temperature and pressure can be written as follows:
where Xjmelt and are the mole fraction and the activity coefficient of gold species j dissolved in the silicate melt, and and are the mole fraction and the activity coefficient of FeS in silicate melt. At given temperature T and pressure P, log K is constant. If we assume that log is independent of the concentration of species j dissolved in the melt, and of ƒS2, ƒO2 and T (but not
where (thus Cj is constant for a given melt composition),
, and .
Note that the hypothesis of being independent of the species j concentration in the melt is equivalent to assume that gold dissolution follows Henry‟s law for our investigated ranges of gold concentration, T, ƒO2 and ƒS2.
Eqs. (27), (28), (29), (30), (31), (32), (33), (34) and (35) have been fitted simultaneously to all our experimental gold solubility data (except run 5). We assumed that XFeS ≈ XS (Table 2), i.e., the reduced sulfur is linked exclusively to iron (and to negligible amounts of gold) in the silicate melt, which is a reasonable hypothesis for our melt compositions. The constants Cj
(Appendix A.3, Table S1 and S2) were determined by linear regression from our solubility data at different ƒO2, ƒS2 and XFeS i.e., their respective values were estimated by least-square
minimization of the difference between measured and calculated (e.g., Albarède, 1995).
Then, the bulk gold solubility ( ) is the sum of abundances of all dissolved gold species j present in the silicate melt i:
(36)
5.3.2. Results of the thermodynamic model
Results of the model are illustrated in Fig. 7, Fig. 8 and Fig. 9. Fig. 7 shows that calculated gold contents are in excellent agreement (R2 = 0.97) with the measured concentrations. All experimental data are satisfactorily reproduced by the model within less than a 0.14 log XAu unit difference, with 80% of the charges showing a difference ⩽0.06 log XAu unit. This almost perfect agreement data-model is also illustrated in Fig. 8 as a function of the three key
parameters log fO2 (a), log fS2 (b) and log XFe (c). It appears that all different trends described by the data and discussed above are very well reproduced by the model. The largest
differences are observed for very oxidizing conditions, eventually suggesting that some oxidized gold species were omitted from our thermodynamic analysis.
Table S2 (matrix of solutions C; Appendix A.3) shows that the calculated 10^C12, 10^C14 and 10^C17 have negative values, implying that the constants C can not be determined. The geochemical interpretation of these results is that the corresponding gold species (Au2S, Au2SO4 and AuFeS2.5, respectively) are not present in the experimental silicate melts. All other species considered in the thermodynamic analysis (i.e., Au (metal), Au2O, Au2O3, Au2S3, Au2(SO4)3 and Au2FeS2) have positive 10^Cj, therefore they are supposedly present in
our experimental glasses in variable proportions. The quality of the agreement suggests that the three parameters considered in the model – log fO2, log fS2 and log XFeS – are the main variables controlling the dissolution of gold in melt under our experimental PTX conditions.
Several other modelling attempts have been made with more basic sets of gold species, notably by avoiding the sulfide and sulfate gold complexes (from Eqs. (14), (15), (16) and (17)), but this led to much less efficient agreements between measured and calculated Au concentrations. This stresses the importance of such complexes in the mechanism of gold dissolution, as discussed below.
The absence of Au2SO4 and AuFeS2.5 species in the experimental silicate melts, as mentioned above, seems quite intuitive since it is likely due to the relative poor thermodynamic stability of ambivalent Au–S–(Fe) complexes involving reduced gold Au1+ and sulfate species on the one hand, and oxidized gold Au3+ and sulfide species on the other hand. In contrast, the absence of Au2S may appear more surprising since this species is intuitively expected to account for a major part of gold dissolution in reduced S-bearing silicate melts. However in Fig. 9, which shows the relative proportion of the different gold species dissolved in the melt as a function of log fO2 (calculated from Eq. (36); see Appendix A.3), a very large part (∼76– 92%) of gold is dissolved as Au2FeS2 under reducing to moderately oxidizing conditions (∼log fO2 < −8.6). The absence of Au2S associated to this predominance of Au2FeS2 strongly suggests that in sulfide-saturated, Fe-bearing silicate melts gold is principally attached to Fe– S complexes rather than to S alone. In other words, sulfur S2− complexes firstly with Fe2+ then accepts Au1+, but does not complex with gold alone to form Au2S if Fe2+ is present and
available in the melt. Besides, the strong increase of Au2FeS2 from log fO2 ∼ −9.1 to −8.6 (Fig. 9) is consistent with the increase of S2- solubility in melt at the sulfide–sulfate transition (resulting from the progressive destabilization of sulfides) as shown by Botcharnikov et al. (2011) and suggested above to account for the increase of our melt S solubility data under moderately oxidizing conditions (cf. Section 4.3).
In addition to the dominant Au2FeS2 species, gold dissolution under reducing to moderately oxidizing conditions is accounted for by relatively small percentages of Au metal (<22% of total Au) and Au2S3 species (<16% of total Au) (Fig. 9). Importantly, however, the proportion of Au2S3 at ∼NNO−1 (log fO2 ∼ −11.3) is much lower (<6%), i.e., the proportion of Au2S3 species increases with fO2, implying a decrease of Au1+/Au3+ ratio with increasing fO2. Also, the strong increase of S2- concentrations in melt at intermediate fO2 likely favours the
formation of Au2S3, and explains why a fraction of S2− complexes with gold alone while the proportion of Au2FeS2 rapidly increases.
At log fO2 > −8.6, the melt S2−/S6+ ratio rapidly decreases at the expense of Au2FeS2 species whose proportion drops to ∼52% at log fO2 ∼ −8.25 (Fig. 9). This leads to a very significant decrease of the melt Au solubility over a narrow fO2 range (see run 1 in Fig. 5). Fig. 9 shows however that this Au solubility drop is partly compensated by the formation of Au2(SO4)3 species up to ∼30% of total Au, and by minor amounts of Au metal, Au2S3 and Au2O. This corresponds to a decrease of Au1+/Au3+ ratio in melt from >22 to 1.5 between log fO2 ∼ −8.6 and −8.25.
Under very oxidizing conditions (log fO2 > −7.4), the main part of gold is dissolved as Au metal in silicate melt (Fig. 9), stressing the inefficiency of the mechanism of gold dissolution in sulfate-saturated silicate melts. However the proportion of Au0 decreases rapidly from ∼70% to 42% with increasing fO2 to the benefit of Au3+ species, i.e., Au2(SO4)3 and Au2O3 (up to ∼17% and 13%, respectively, at log fO2 ∼ −6.75). Under such oxidizing conditions, Au1+ species are almost totally represented by Au2O which accounts for ∼22–28% of total Au (Fig. 9). A small proportion (<5%) of Au2FeS2 still remains at log fO2 ∼ −7.4 but no longer exists at log fO2 ∼ −6.75. The evolution of the relative proportions of Au1+ species (i.e.,
Au2O + Au2FeS2) and Au3+ species (i.e., Au2(SO4)3 + Au2O3) between log fO2 ∼ −7.4 and −6.75 leads to a decreasing melt Au1+
/Au3+ ratio from ∼0.9 to 0.45. At the same time, the ratio (Au1+ + Au3+)/Au metal of total gold dissolved in melt evolves from 0.3 to almost 0.6, while the melt Au solubility remains quasi-constant.
Interestingly, the consideration of AuOxSy species (i.e., gold thiosulfates) in the
thermodynamic analysis does not improve or significantly alter the quality of the data-model agreement; models involving thiosulfate species lead to very similar results than those described above, both quantitatively and qualitatively, with determination coefficients
R2 = 0.92–0.97 depending on the species considered ( , and ). For
instance, the Au4OS species may be considered in the model according to the equation:
the thiosulfate species is only present in moderately oxidizing conditions, between 5 and 10 wt.% (not shown), which notably induces a light decrease of the proportion of Au2FeS2. Also, the consideration
of Au4OS modifies to some extent the relative proportions of the gold species present in very
oxidizing conditions, in particular Au2O proportion goes down to 14–17% while Au2O3 and Au2(SO4)3
proportions significantly increase up to 30% and 19%, respectively, at log fO2 ∼ −6.75.
Results with thiosulfate clearly stress the need for spectroscopic data on the speciation of Au in silicate melts.
5.4. Comparison with previous S-bearing solubility data
As already mentioned, most previous studies focused on the determination of the partitioning of gold between Au metal, rhyolitic or basaltic melts, coexisting magmatic aqueous phases and sulfides (either crystalline or molten) in S-bearing magmatic assemblages ( [Bezmen et al., 1994], [Fleet et al., 1996], [Fleet et al., 1999], [Crocket et al., 1997], [Jana and Walker, 1997], [Jugo et al., 1999], [Simon et al., 2007], [Simon et al., 2008] and [Bell et al., 2009]) rather than providing Au solubility data. Though, Simon et al. (2007) reported Au solubility of about 600 ppb in H2O-saturated rhyolitic melt at ∼NNO, and Jugo et al. (2005a) measured a solubility on the order of ∼500 ppb Au in anhydrous basaltic melt (1300 °C, 10 kbar) under reducing conditions. Bezmen et al. (1994) reported a gold concentration of ∼800 ppb in a Bushweld Complex melt (∼56 wt.% SiO2) saturated with H–C–O–S fluids (1300 °C, 4 kbar, ∼NNO), but Au activity was not equal to unity in their experiments. Those three values are noticeably lower than our own results at NNO−1 (∼FMQ−0.4), but the two first ones are similar to our most oxidized data and the third one is comparable to the lowest value of our moderately oxidized dataset (865 ppb Au). On the other hand, Jugo et al. (1999) reported a gold solubility of about 4 ± 2 ppm in hydrous haplogranitic melt (850 °C, 1 kbar) under reducing conditions that fits very well with our highest solubility values (∼4–5 ppm). Recently, Botcharnikov et al. (2010) presented the first experimental Au solubility data in S-bearing hydrous intermediate (i.e., andesitic) silicate melts near NNO. Similarly to our study, their data suggest a positive correlation between the concentrations of Au and S dissolved in the melt under reducing/moderately oxidizing conditions. They reported lower Au and S solubilities in the melt, from 300 to 2500 ppb Au and 0–400 ppm S, but such values are consistent with the lower end of the trend described by our reduced/moderately oxidized data in Fig. 6a and suggest fS2 values lower in Botcharnikov et al. (2010) than in the present experiments.