HAL Id: hal-00298118
https://hal.archives-ouvertes.fr/hal-00298118
Submitted on 7 Nov 2005HAL is a multi-disciplinary open access
archive for the deposit and dissemination of sci-entific research documents, whether they are pub-lished or not. The documents may come from teaching and research institutions in France or abroad, or from public or private research centers.
L’archive ouverte pluridisciplinaire HAL, est destinée au dépôt et à la diffusion de documents scientifiques de niveau recherche, publiés ou non, émanant des établissements d’enseignement et de recherche français ou étrangers, des laboratoires publics ou privés.
A studying of solar-ENSO correlation with southern
Brazil tree-ring index (1955?1994)
N. R. Rigozo, D. J. R. Nordemann, M. Pereira de Souza Echer, E. Echer, A.
Prestes
To cite this version:
N. R. Rigozo, D. J. R. Nordemann, M. Pereira de Souza Echer, E. Echer, A. Prestes. A studying of solar-ENSO correlation with southern Brazil tree-ring index (1955?1994). Climate of the Past Discussions, European Geosciences Union (EGU), 2005, 1 (3), pp.215-230. �hal-00298118�
CPD
1, 215–230, 2005 Solar-ENSO corelation from tree-ring index N. R. Rigozo et al. Title Page Abstract Introduction Conclusions References Tables Figures J I J I Back CloseFull Screen / Esc
Print Version Interactive Discussion
EGU
Climate of the Past Discussions, 1, 215–230, 2005 www.climate-of-the-past.net/cpd/1/215/
SRef-ID: 1814-9359/cpd/2005-1-215 European Geosciences Union
Climate of the Past Discussions
Climate of the Past Discussions is the access reviewed discussion forum of Climate of the Past
A studying of solar-ENSO correlation
with southern Brazil tree-ring index
(1955–1994)
N. R. Rigozo1,2,3, D. J. R. Nordemann3, M. Pereira de Souza Echer1, E. Echer3, and A. Prestes3
1
Faculdade de Tecnologia Thereza Porto Marques – FAETEC, CEP 12308-320, Jacare´ı, Brazil
2
LARAMG – Laborat ´orio de Radioecologia e Mudanc¸as Globais/Departamento de Biof´ısica e Biometria da Universidade do Estado do Rio de Janeiro (UERJ), Rio de Janeiro - RJ, Brazil
3
Instituto Nacional de Pesquisas Espaciais – INPE, CP 515, 12201-970 S ˜ao Jos ´e dos Campos, Brazil
Received: 24 August 2005 – Accepted: 3 October 2005 – Published: 7 November 2005 Correspondence to: N. R. Rigozo (rodolfo@dge.inpe.br)
CPD
1, 215–230, 2005 Solar-ENSO corelation from tree-ring index N. R. Rigozo et al. Title Page Abstract Introduction Conclusions References Tables Figures J I J I Back CloseFull Screen / Esc
Print Version Interactive Discussion
EGU
Abstract
Solar activity, volcanic aerosol, El Ni ˜no-Southern Oscillation and global temperature anomalies effects on Southern Brazil tree growth rings are presented through multiple linear analysis. Linear correlations were made on annual, 10 year running averages and band pass filter. For annual averages, the correlation coefficients were low, and the
5
10 years running average correlations the coefficient correlations were much higher. The multiple regression of 2 to 5 year band pass filter indicates that 60% of the variance in tree ring index was explained by volcanic eruptions, Southern Oscillation Index and temperature anomalies. The multiple regression of 10 year running averages indicates that 84% of the variance in tree ring index was explained by solar activity and another
10
time series. These results indicate that the effects of solar activity, volcanic eruptions, ENSO and temperature anomalies on tree rings are better seen on long timescales than volcanic eruption, ENSO and temperature anomaly.
1. Introduction
Around 76% of the surface of the Southern Hemisphere is covered by water. The
inter-15
action between ocean and atmosphere and specially the mechanisms of heat transport determine the patterns of present and past climates (Hamon and Godfrey, 1978). Due to this disparity in land area, the Southern Hemisphere climate is predominantly mar-itime than continental.
Much has been written about Northern Hemisphere climatic variations, but
compar-20
atively little is available on the Southern Hemisphere. A complete understanding of the climatic behavior of one hemisphere, however, is not possible without the knowl-edge of what happens in the other one (Pittock, 1978). A true understanding of climate change requires field experiments, empirical studies, and theoretical models. Theoret-ical models provide a guide for empirTheoret-ical studies. The models may predict previously
25
CPD
1, 215–230, 2005 Solar-ENSO corelation from tree-ring index N. R. Rigozo et al. Title Page Abstract Introduction Conclusions References Tables Figures J I J I Back CloseFull Screen / Esc
Print Version Interactive Discussion
EGU
or disprove. Advancement requires the interaction between theory, experiment, and empirical models (Hoyt and Schatten, 1997).
The instrumental meteorological records available in the Southern Hemisphere are shorter, and more spatially concentrated than in the Northern Hemisphere. Very few Southern Hemisphere temperature records extended back into the nineteen century
5
(Jones et al., 1996). Working with such short timescales, trends lasting decades to centuries are difficult to evaluate with statistical confidence. One way to study climatic variations and solar variations before the previous century is to utilize indirect sources or “proxy data” such as tree-rings. Tree ring vary in width each year depending on variations in local temperature and local precipitation. Some tree-ring growths are
10
mostly controlled by temperature and others by precipitation, but generally the growth control a mixture of the two (Fritts, 1976).
In this work we make a comparison between modeled and observed tree-ring index by accounting for additional natural forcings. That is important to evaluate the use of the tree-rings data as proxy data for climate and solar effects in Southern America.
15
2. Methodology of data analysis
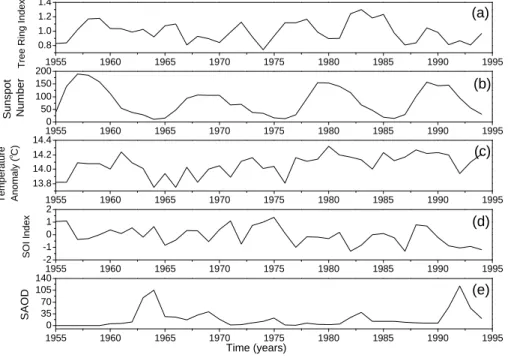
Our study makes use of five observational data sets: Tree-ring index (Fig. 1a), Z ¨urich Sunspot Number (Rz) (Fig. 1b), global temperature anomalies (Fig. 1c), Southern Os-cillation Index (SOI) (Fig. 1d) with representative of the El Ni ˜no and La Ni ˜na events, and stratospheric aerosol optical depth measurements (Fig. 1e).
20
The trees used in this study were sampled from four locations in Rio Grande do Sul State, in Southern Brazil: nine samples from Canela (29o18’S, 50◦510W, 790 m a.s.l.), one sample from Nova Petr ´opolis (29o20’S, 51◦100W, 579 m a.s.l.), nine samples from S ˜ao Francisco de Paula (29◦250S, 50o 24’W, 930 m a.s.l.) and two samples from S ˜ao Martinho da Serra (29◦300S, 53◦530W, 484 m a.s.l.) (Rigozo, 1998). A total of 21
sam-25
ples were used in this study. Trees were native Araucaria trees (Araucaria angustifolia) of ages ranging from 30 to 39 years. Trees of this species with longer lifetime exist but
CPD
1, 215–230, 2005 Solar-ENSO corelation from tree-ring index N. R. Rigozo et al. Title Page Abstract Introduction Conclusions References Tables Figures J I J I Back CloseFull Screen / Esc
Print Version Interactive Discussion
EGU
because of the enforcement of laws on native species, it was not possible to sample older trees at the time of sampling. The methodology of polishing and treatment of the samples, as well as the digital image analysis of the scanned samples are described in Rigozo and Nordemann (1999) and Rigozo et al. (2001).
Every time series was detrended using an exponential function to eliminate growth
5
trends and periods longer than 25 years. A growth index for each radius time series and then means by location and a global index for the region concerned were obtained. Because long term climatic data for the collected samples are not available, our hypothesis about the climate response in the tree-ring data for this region is based on the global temperature anomalies. The annual global temperature anomalies come
10
from about 4000 meteorological stations around the world. These data are an update of the analysis described by Hansen and Lebedeff (1987, 1988). These data are available in Goddard Institute for Space Studies (GISS).
The SOI is calculated from the monthly or seasonal fluctuations in the air pressure difference between Tahiti (20◦S, 150◦W) and Darwin (Australia, 10◦S, 130◦E). Positive
15
values of SOI indicate La Ni ˜na events and negative values of SOI indicate El Ni ˜no events (Enfield, 1989; Neelin and Latif, 1997).
Sunspot data where obtain from The Sunspot Index Data Center – Brussels (World Data Center for the Sunspot Index). Sunspot number is the longest solar activity in-dex available and it is a representative of the general state of solar activity (Hoyt and
20
Schatten, 1997).
Volcanic eruption effect on the climate is represented by the stratospheric aerosol op-tical depth (SAOD) data set of Sato et al. (1993 and updates). The opop-tical depth of the aerosol layer is considered to be the primary stratospheric aerosol climate forcing factor (Lacis et al., 1992; Sato et al., 1993). Major volcanic eruptions inject sulfur dioxide into
25
the stratosphere, where, within a few weeks, it is converted to sulfate aerosol. This sul-fate aerosol affects incoming solar radiation, reducing the amount reaching the earth’s surface and thereby leading to a temperature reduction at the surface and through-out the lower troposphere (Mass and Portman, 1989; Dutton and Christy, 1992). The
CPD
1, 215–230, 2005 Solar-ENSO corelation from tree-ring index N. R. Rigozo et al. Title Page Abstract Introduction Conclusions References Tables Figures J I J I Back CloseFull Screen / Esc
Print Version Interactive Discussion
EGU
SAOD data set used in our analysis contains yearly average south hemisphere SAOD values covering the period from 1955 through 1994 (Sato et al., 1993 and updates). 2.1. Analysis and results
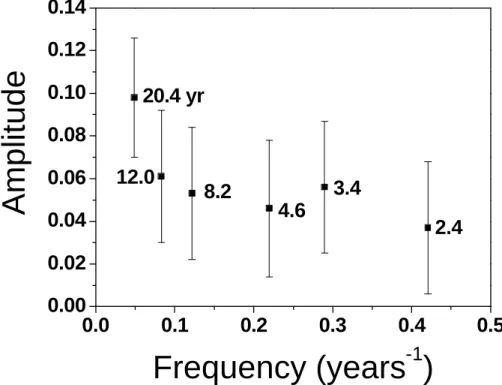
In order to determine the effect of solar activity, temperature, ENSO and SAOD on tree-ring index, a multivariate linear regression approach is used. Initially spectral analysis
5
in tree ring index time series is performed to determine the frequencies contained in the data. The spectral analysis results in tree ring time series are described. Figure 2 shows the amplitude as a function of frequency as determined by iterative regression analysis. It may be observed in the spectrum that there is no domination of long peri-ods (>10 years) over the short ones (<10 years), or, in other terms, the long periperi-ods
10
do not hide the low periods in the spectrum. The nature of this distribution suggests a favorable response on tree growth rate in South Brazil, to environmental factors for short and long periods. The tree-ring index from 1955 through 1994 is fit using the 10 years running average and 2–5 year band pass filter. These 10 year running averages and band pass filtered data were also applied to Rz, temperature anomaly, SOI and
15
SAOD. The 8.2 yr periodicity was not included in the analyses because it is not caused by any natural phenomenon but it is caused man, because to every 8 years the reser-vations of tree from San Francisco of Paula and Canela in Brazil suffer cut of the forest to eliminate the sick trees in favor of the healthy ones (Rigozo, 1998).
The regression results are presented in Table 1 to original series, Table 2 for the 2 to
20
5 years band pass filter and Table 3 for the ten-year running averages. We found that the Rz in combination with temperature anomaly, ENSO and with SAOD original series explained only 17,8% of the variation in the tree ring index data, but using the band pass filter of 2 to 5 years on that data the combined influence of those phenomenon’s for low periods on the tree ring index increases for 60,3% (Table 1). The influence of
25
those phenomena in the variation of the tree ring index for longer periods than 10 years is very large. Using the 10 years running average on the data 84.2% of the variation in the tree ring index data is explained (Table 2).
CPD
1, 215–230, 2005 Solar-ENSO corelation from tree-ring index N. R. Rigozo et al. Title Page Abstract Introduction Conclusions References Tables Figures J I J I Back CloseFull Screen / Esc
Print Version Interactive Discussion
EGU
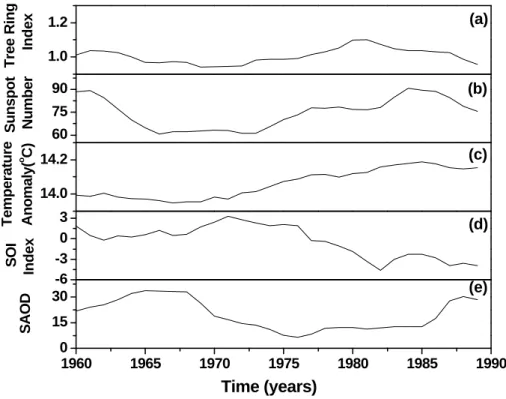
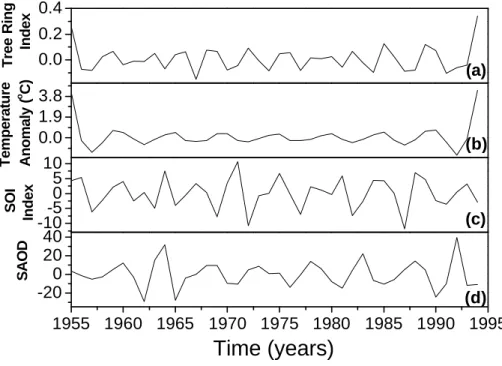
The cross-correlation coefficients between tree ring index and the time series, for the average 10 years running average were: 0.70 to tree-ring index x Rz with a lag of 1 year, 0.65 tree-ring index temperature anomaly with a lag of 1 year, −0.82 tree-ring index x SOI index with a lag of 2 years and −0.77 tree ring index x SAOD with a lag of −4 years. The cross-correlation tree ring index and the time series for the band pass
5
filter of 2 to 5 years the were: 0.74 tree-ring index temperature anomaly with a lag of zero year, −0.45 tree-ring index x SOI index with a lag of −3 years and 0.47 tree ring index x SAOD with a lag of −2 years.
3. Discussion
Rigozo et al. (2004), in studies on solar activity in tree ring data from Conc ´ordia-Brazil
10
(27◦S, 51◦W), have found a lag of zero year for the 11 years period, between sunspot number and tree ring width, which indicates that in the Conc ´ordia region the growth of tree seems to follow immediately the sunspot activity variability. Rigozo et al. (2002), still studying the solar variability effects in the tree-ring data, from Conc´ordia-Brazil, found in the cross-wavelet spectral analysis between the tree ring data and sunspot
15
number a high amplitude for the period close to 11 years, during the time interval 1940 to 1970. This represents a correspondence in the response of the growth of the tree ring time series, for the interval of more intense solar activity. Murphy (1990), in studies on tree ring data from Australia, similarly have found low correlation coefficients between tree ring data and Sunspot number, values between 0.16 and 0.22. Murphy
20
and Veblen (1992) also have found a correlation coefficient of 0.2 between tree ring data, from Colorado – USA, and sunspot number. They have attributed a strong 11-year periodic association between these two time series. The results found by us show a lag of zero year with a high positive correlation between the solar activity and tree ring data from Southern Brazil region. In the Fig. 3a–b show that the tree-ring index
25
increases and decreases when the Rz increases and decreases. It is also observed in long tendency temperature anomaly (Fig. 3c), where the lag with tree ring index is one
CPD
1, 215–230, 2005 Solar-ENSO corelation from tree-ring index N. R. Rigozo et al. Title Page Abstract Introduction Conclusions References Tables Figures J I J I Back CloseFull Screen / Esc
Print Version Interactive Discussion
EGU
year with a high positive correlation.
When the solar activity is maximum there is a higher radiative output of the Sun, at least as it was verified by satellite observations in the last two decades (Fr ¨olich and Lean, 1998). This higher radiative emission causes a heating in the most of Earth but it could make some regions to become colder. In the regions with heating during
5
solar maximum, one may have two situations. In the warm latitudes, the heating might causes a smaller tree ring growth and an anti-correlation between tree ring width and sunspot number might be observed. In the cold latitudes, the heating might causes a higher tree ring growth and thus a positive correlation with sunspot number is observed. Thus, the regional/local conditions could influence on the climate response to the solar
10
forcing (radiative) in this region.
The Southern Brazil is located in the temperate climate region. It presents rigorous winter and summer periods. Temperature and other climate data are not available for this region in the long period studied in this work (almost 200 years). One can only make some hypothesis about the climate response in this region to the solar forcing,
15
based on the tree ring width variations. Thus, a small increase of the temperature in this area could favor in the growth of the trees, while a decrease of the temperature could cause an inhibition in the growth of the trees. The correlations obtained between tree ring date x Rz, for long periods (>10 years), and tree ring dates x temperature anomaly for long and short periods (Fig. 4b), suggest that the activity solar cause
20
warming, through a more radiation emission to every maximum of solar activity (Wilson and Hudson, 1988; Fr ¨olich and Lean, 1998), that is to say a temperature increase, in the south Brazil region, in which influence an increase in the growth of the tree-rings.
Figure 3d and multivariate linear regression (Table 2) show an anti-correlation be-tween tree ring index and SOI index with a lag of 2 years. It represents that the tree
25
rings present a greater growth in epochs of El Ni ˜no (Da´ı et al., 2000). The south of Brazil presents a larger amount of precipitation in epochs of El Ni ˜no. Trees have a larger amount of water available during summer causing a larger growth of its rings.
CPD
1, 215–230, 2005 Solar-ENSO corelation from tree-ring index N. R. Rigozo et al. Title Page Abstract Introduction Conclusions References Tables Figures J I J I Back CloseFull Screen / Esc
Print Version Interactive Discussion
EGU
presents a factor of negative influence in the tree rings growth for long periods. It is comprehensible because the main influence of the volcanic aerosols is of causing a decrease in the temperature of the planet (Mass and Portman, 1989; Dutton and Christy, 1992). This decrease of the temperature would cause an inhibition in the growth of the trees giving an anti-correlation between tree ring index and SAOD.
5
The signal of the multivariate linear regression to short periods (Fig. 4) show that the tree ring are more influenced by the temperature than the SOI index and SAOD. Temperature present a cross-correlation coefficient of 0.74 with a zero year lag. It shows that the tree ring growth is more sensitive to temperature, that a phenomenon of global scale, as the volcanic eruptions and the SOI Index.
10
Solar activity, global temperature anomalies, ENSO and volcanic forcing explain nearly four-fifth (83%) of the variation in the tree-ring tendency above ten years for the ten-year running averages. For the low periods, among 2 to 5 years, the global temperature anomalies, ENSO and volcanic forcing explain nearly two-thirds (60,3%) of the variation in the tree-ring data.
15
The correlations obtained between tree ring date x Rz, for long periods (>10 years), and tree ring dates x temperature anomaly for long and short periods (Fig. 4b), sug-gest that the solar activity cause more warming, through more radiation emission at every solar activity maximum, that is to say a temperature increase, in Southern Brazil region, which causes an increase of tree growth ring. The multivariate linear regression
20
(Table 2) showed an anti-correlation between tree ring index and SOI index so that that tree rings present a greater growth in epochs of El Ni ˜no. The volcanic activity presents a factor of negative influence in the tree rings growth for long periods inhibiting the growth of the trees, giving an anti-correlation between tree ring index and SAOD.
The signal of the multivariate linear regression to short periods (Table 1) shows that
25
tree rings are more influenced by the temperature than the SOI index and SAOD. That shows that the tree ring growth is more sensitive to the temperature, than to volcanic eruptions and SOI Index.
CPD
1, 215–230, 2005 Solar-ENSO corelation from tree-ring index N. R. Rigozo et al. Title Page Abstract Introduction Conclusions References Tables Figures J I J I Back CloseFull Screen / Esc
Print Version Interactive Discussion
EGU
Acknowledgements. Thanks to Conselho Nacional de Desenvolvimento Cient´ıfico e Tecnol´ogico
– CNPq for support granted to this research (Project APQ 474185/2003-6, PQ 300992/2003-3) and research fellowships (PDJ 150102/2005-4) and to FAPESP post doctoral research Project 02/12723-2.
References
5
Dai, A. and Wigley, T. M. L.: Global Patterns of ENSO-induced Precipitation, Geophys. Res. Lett., 27, 1283–1286, 2000.
Dutton, E. G. and Christy, J. R.: Solar radiative forging at selected locations and evidence for global lower tropospheric cooling following the eruptions of El Chich ´on and Pinatubo, Geophys. Res. Lett., 19, 2313–2316, 1992.
10
Enfield, D. B.: El Ni ˜no, past and present, Rev. Geophys., 27, 159–187, 1989. Fritts, H. C.: Tree rings and climate, Academic Press Inc., London, 1976.
Fr ¨olich, C. and Lean, J.: The sun’s total irradiance cycles, trends and related climate change uncertainties since 1976, Geophys. Res. Lett., 97, 7579–7591, 1998.
Hamon, B. V. and Godfrey, J. S.: The role of the oceans, in: Climatic Change and Variability,
15
edited by: Pittock, A. B. et al., A Southern Perspective, Cambrige, Cambrige University Press, 31–52, 1978.
Hansen, J. and Lebedeff, S.: Global surface air temperatures: Update through 1987, J. Geo-phys. Res., 15, 323–326, 1988.
Hansen, J. and Lebedeff, S.: Global trends of measured surface air temperature, J. Geophys.
20
Res., 92, 13 345–13 372, 1987.
Hoyt, D. V. and Schatten, K. H.: The role of the sun in climate change, Oxford University Press, Oxford, 280 p., 1997.
Jones, P. D., Raper, S. C. B., Goodess, C. M., Cherry, B. S. G., and Wigley, T. M. L.: A grid point surface air temperature data set for the Southern Hemisphere, DOE Technical Report
25
No TR027, Washington, D. C., US Dept. of Energy, Carbon Dioxide Research Division, 73 p., 1986.
Lacis, A., Hansen, J., and Sato, M.: Climate forcing by stratospheric aerosols, Geophys. Res. Lett., 19, 1607–1610, 1992.
CPD
1, 215–230, 2005 Solar-ENSO corelation from tree-ring index N. R. Rigozo et al. Title Page Abstract Introduction Conclusions References Tables Figures J I J I Back CloseFull Screen / Esc
Print Version Interactive Discussion
EGU
Mass., C. F. and Portman, D. A.: Major volcanic eruptions and climate: A critical evaluation, J. Climate, 2, 566–593, 1989.
Murphy, J. O. and Veblen, T. T.: Proxy Data from Tree-ring time series for the eleven-year solar cycle, Proceedings ASA, 10, 64–67, 1992.
Murphy, J. O.: Australian tree ring chronologies a proxy data for solar variability, Proceedings
5
ASA, 8, 292–297, 1990.
Neelin, J. D. and Latif, M.: El Ni ˜no dynamics, Physics Today, 32–36, 1998.
Pittock, A. B.: An overview, in: Climatic Change and Variability, edited by: Pittock, A. B. et al., A Southern Perspective, Cambrige, Cambrige University Press, 1–6, 1978.
Rigozo, N. R. and Nordemann, D. J. R.: Solar activity records in tree-rings, Revista Geof´ısica –
10
Instituto Panamericano de Geograf´ıa e Historia (M´exico), 50, 163–170, Enero-Junio, 1999. Rigozo, N. R., Nordemann, D. J. R., Echer, E., Vieira, L. E. A., and Prestes, A.: Tree Ring
Image Interactive Treatment, in: 6th Latin America Conference on Space Geophysics, GA-26, Concepci ´on, 2001.
Rigozo, N. R., Nordemann, D. J. R., Echer, E., and Vieira, L. E. A.: Search for Solar Periodicities
15
in Tree-Ring Widths from Conc ´ordia (S.C., Brazil), Pure Applied in Geophysics, 161, 221– 233, 2004.
Rigozo, N. R., Nordemann, D. J. R., Echer, E., Zanandrea, A., and Gonzalez, W. D.: Solar variability effects studied by tree-ring data wavelet analysis, Adv. Space Res., 29, 1985– 1988, 2002.
20
Rigozo, N. R.: Registros da atividade solar e de outros fen ˆomenos geof´ısicos em an´eis de ´arvores, PhD Thesis (Doctorate in Space Geophysics) – National Institute for Space Re-search, Brazil, 132 p.,1998.
Sato, M., Hansen, J. E., McCormick, M. P., and Pollack, J. B.: Stratospheric aerosol optical depths, 1850–1990, J. Geophys. Res., 98, 22 987–22 994, 1993 and updates.
25
Wilson, R. C. and Hudson, H. S.: Solar luminosity variations in solar cycle 21, Nature, 332, 810–812, 1988.
CPD
1, 215–230, 2005 Solar-ENSO corelation from tree-ring index N. R. Rigozo et al. Title Page Abstract Introduction Conclusions References Tables Figures J I J I Back CloseFull Screen / Esc
Print Version Interactive Discussion
EGU
Table 1. Multiple Regression Results: 2 to 5 years band pass filter.
R 0.777
R-Square 0.604
Prob>F <0.0001
Parameter Value Error t-Value Prob>|t|
Intercept 5.0504E-4 0.01009 −0.05007 0.9604
Temperature 0.07035 0.00972 7.23747 <0.0001
SOI −0.00448 0.00201 −2.22962 0.0321
CPD
1, 215–230, 2005 Solar-ENSO corelation from tree-ring index N. R. Rigozo et al. Title Page Abstract Introduction Conclusions References Tables Figures J I J I Back CloseFull Screen / Esc
Print Version Interactive Discussion
EGU
Table 2. Multiple Regression Results to ten-year running averages.
R 0.917
R-Square 0.842
Prob>F <0.0001
Parameter Value Error t-Value Prob>|t|
Intercept 11.88638 1.9253 6.17387 <0.0001
Sunspot 0.00211 4.769E-4 4.42098 <0.0001
Temperature −0.77845 0.1366 −5.69957 <0.0001
SOI −0.02877 0.0042 −6.88016 <0.0001
CPD
1, 215–230, 2005 Solar-ENSO corelation from tree-ring index N. R. Rigozo et al. Title Page Abstract Introduction Conclusions References Tables Figures J I J I Back CloseFull Screen / Esc
Print Version Interactive Discussion EGU 1955 1960 1965 1970 1975 1980 1985 1990 1995 0 35 70 105 140 (e) SAOD Time (years) 1955 1960 1965 1970 1975 1980 1985 1990 1995 -2 -1 0 1 2 (d) SOI Index 1955 1960 1965 1970 1975 1980 1985 1990 1995 13.8 14.0 14.2 14.4 (c) Temperature Anomaly ( o C) 1955 1960 1965 1970 1975 1980 1985 1990 1995 0 50 100 150 200 (b) Sunspot Number 1955 1960 1965 1970 1975 1980 1985 1990 1995 0.8 1.0 1.2 1.4 (a)
Tree Ring Index
Figure 1 – Time series.
0.0 0.1 0.2 0.3 0.4 0.5 0.00 0.02 0.04 0.06 0.08 0.10 0.12 0.14 2.4 3.4 4.6 8.2 12.0 20.4 yr
Amplitude
Frequency (years
-1)
Figure 2 – Tree-ring index spectral analysis by iterative method.
Fig. 1. Time series.
CPD
1, 215–230, 2005 Solar-ENSO corelation from tree-ring index N. R. Rigozo et al. Title Page Abstract Introduction Conclusions References Tables Figures J I J I Back CloseFull Screen / Esc
Print Version Interactive Discussion EGU
12
1955 1960 1965 1970 1975 1980 1985 1990 1995 0 35 70 105 140e
SAOD
Time (years)
1955 1960 1965 1970 1975 1980 1985 1990 1995 -2 -1 0 1 2d
SOI Index 1955 1960 1965 1970 1975 1980 1985 1990 1995 13.8 14.0 14.2 14.4c
Temperature Anomaly ( o C) 1955 1960 1965 1970 1975 1980 1985 1990 1995 0 50 100 150 200b
Sunspot
Number
1955 1960 1965 1970 1975 1980 1985 1990 1995 0.8 1.0 1.2 1.4a
Tree Ring Index
Figure 1 – Time series.
0.0
0.1
0.2
0.3
0.4
0.5
0.00
0.02
0.04
0.06
0.08
0.10
0.12
0.14
2.4
3.4
4.6
8.2
12.0
20.4 yr
Amplitude
Frequency (years
-1
)
Figure 2 – Tree-ring index spectral analysis by iterative method.
Fig. 2. Tree-ring index spectral analysis by iterative method.
CPD
1, 215–230, 2005 Solar-ENSO corelation from tree-ring index N. R. Rigozo et al. Title Page Abstract Introduction Conclusions References Tables Figures J I J I Back CloseFull Screen / Esc
Print Version Interactive Discussion EGU
13
1960 1965 1970 1975 1980 1985 1990 0 15 30 (e) SAOD Time (years) -6 -3 0 3 (d) SOI Index 14.0 14.2 (c) Temperature Anomaly( o C) 60 75 90 (b) Sunspot Number 1.0 1.2 (a) Tree Ring IndexFigure 3 – ten-year running averages.
1955 1960 1965 1970 1975 1980 1985 1990 1995 -20 0 20 40 d SAOD
Time (years)
-10-5 0 5 10 c SOI Index 0.0 1.9 3.8 b Temperature Anomaly ( o C) 0.0 0.2 0.4 a Tree Ring IndexFigure 4 – 2 to 5 years band pass filter.
Fig. 3. Ten-year running averages.CPD
1, 215–230, 2005 Solar-ENSO corelation from tree-ring index N. R. Rigozo et al. Title Page Abstract Introduction Conclusions References Tables Figures J I J I Back CloseFull Screen / Esc
Print Version Interactive Discussion EGU
13
1960 1965 1970 1975 1980 1985 1990 0 15 30 e SAOD Time (years) -6 -3 0 3 d SOI Index 14.0 14.2 c Temperature Anomaly( o C) 60 75 90 b Sunspot Number 1.0 1.2 a Tree Ring IndexFigure 3 – ten-year running averages.
1955 1960 1965 1970 1975 1980 1985 1990 1995 -20 0 20 40 (d) SAOD
Time (years)
-10-5 0 5 10 (c) SOI Index 0.0 1.9 3.8 (b) Temperature Anomaly ( o C) 0.0 0.2 0.4 (a) Tree Ring IndexFigure 4 – 2 to 5 years band pass filter.
Fig. 4. 2 to 5 years band pass filter.