HAL Id: hal-00299737
https://hal.archives-ouvertes.fr/hal-00299737
Submitted on 17 Jul 2008
HAL is a multi-disciplinary open access
archive for the deposit and dissemination of
sci-entific research documents, whether they are
pub-lished or not. The documents may come from
teaching and research institutions in France or
abroad, or from public or private research centers.
L’archive ouverte pluridisciplinaire HAL, est
destinée au dépôt et à la diffusion de documents
scientifiques de niveau recherche, publiés ou non,
émanant des établissements d’enseignement et de
recherche français ou étrangers, des laboratoires
publics ou privés.
Recent Progress in the VLBI2010 Development
J. Behrend, J. Boehm, P. Charlot, T. Clark, B. Corey, J. Gipson, R. Haas, Y.
Koyama, D. Macmillan, Z. Malkin, et al.
To cite this version:
J. Behrend, J. Boehm, P. Charlot, T. Clark, B. Corey, et al.. Recent Progress in the VLBI2010
Development. IAG Symposia series (Springer Verlag), 2008, 133 (Part 5), pp.833-840.
�10.1007/978-3-540-85426-5_96�. �hal-00299737�
Recent Progress in the VLBI2010
Development
D. Behrend1 , J. B¨ohm2 , P. Charlot3 , T. Clark1 , B. Corey4 , J. Gipson1 , R. Haas5 , Y. Koyama6 , D. MacMillan1 , Z. Malkin7 , A. Niell4 , T. Nilsson5 , B. Petrachenko8 , A. Rogers4 , G. Tuccari9 , J. Wresnik2(1) NVI, Inc./NASA GSFC, Code 698, Greenbelt, MD 20771, USA
(2) Institute of Geodesy and Geophysics, University of Technology Vienna, AT-1040 Wien, Austria (3) Observatoire de Bordeaux – CNRS/UMR 5804, BP 89, FR-33270 Floirac, France
(4) MIT Haystack Observatory, Westford, MA 01886-1299, USA
(5) Onsala Space Observatory, Chalmers University of Technology, SE-439 92 Onsala, Sweden (6) Kashima Space Research Center, NICT, 893-1 Hirai, Kashima, Ibaraki 314-8501, Japan (7) Pulkovo Observatory, St. Petersburg 196140, Russia
(8) Geodetic Survey Division, Natural Resources Canada, Ottawa, ON, K1A 0E9, Canada (9) Istituto di Radioastronomia INAF, IT-96017 Noto, Siracusa, Italy
Abstract. From October 2003 to Septem-ber 2005, the International VLBI Service for Geodesy and Astrometry (IVS) examined cur-rent and future requirements for geodetic VLBI, including all components from antennas to anal-ysis. IVS Working Group 3 ‘VLBI 2010’, which was tasked with this effort, concluded with rec-ommendations for a new generation of VLBI sys-tems. These recommendations were based on the goals of achieving 1 mm measurement accu-racy on global baselines, performing continuous measurements for time series of station positions and Earth orientation parameters, and reaching a turnaround time from measurement to initial geodetic results of less than 24 hours. To realize these recommendations and goals, along with the need for low cost of construction and operation, requires a complete examination of all aspects of geodetic VLBI including equipment, processes, and observational strategies. Hence, in October 2005, the IVS VLBI2010 Committee (V2C) com-menced work on defining the VLBI2010 system specifications. In this paper we give a summary of the recent progress of the VLBI2010 project. Keywords. geodetic VLBI, next generation VLBI2010, IVS, Monte Carlo simulations
1
Introduction
Very Long Baseline Interferometry (VLBI) is a vital technique in the realization and mainte-nance of the terrestrial and celestial reference frames (TRF and CRF). It uniquely provides the
ICRF and the link between the ICRF and ITRF by providing the full set of Earth orientation pa-rameters (EOP), in particular DUT1 and nuta-tion. The current VLBI system was conceived and constructed mostly in the 1960’s and 1970’s. Aging antennas, increasing interference prob-lems (RFI), obsolete electronics, and high oper-ating costs make it increasingly difficult to sus-tain the current levels of accuracy, reliability, and timeliness. To alleviate this situation, in 2003 the International VLBI Service for Geodesy and Astronomy (IVS) (Schl¨uter and Behrend, 2007) initiated Working Group 3 (WG3) to define the next generation geodetic VLBI system, which has come to be called VLBI2010.
Over a two-year period, WG3 looked into the conceptual aspects of a new VLBI system. In particular, the observing strategies, frequencies and timing, backend systems, data acquisition and transport, correlation and fringe-finding, data analysis, and data archiving and manage-ment were investigated. The WG3 work culmi-nated in a “vision paper” (Niell et al., 2006) on the future VLBI system; with this final report the WG was closed in 2005. At the same time, in order to encourage the implementation of the recommendations of WG3, the IVS established the VLBI2010 Committee (V2C) as a perma-nent body of IVS. The V2C takes an integrated view of VLBI and evaluates the effectiveness of proposed system changes based on the degree to which they improve IVS’s final products.
The V2C work went hand-in-hand with the gradual establishment of the Global Geodetic
Observing System (GGOS) (Pearlman et al., 2006) of the International Accociation of Geodesy (IAG). The IVS aligned the design goals for the VLBI2010 system with the GGOS goals and strives for global baselines to be accurate to 1 mm and stable to 0.1 mm/yr. To reach these goals, a new set of criteria to measure the next generation geodetic VLBI system was es-tablished, based on:
• the recommendations for future IVS prod-ucts detailed in the IVS Working Group 2 Report (WG2) (Schuh et al., 2002)
• the requirements of the Global Geodetic Ob-serving System project (GGOS) of the Inter-national Association of Geodesy (IAG) • the science driven geodetic goals outlined
in the NASA Solid Earth Science Working Group Report (SESWG)
To realize the demanding goals, the IVS VLBI2010 Committee investigated the various facets that the new system needs to have in order to fulfill the requirements. The major focus right now is on reducing the major error sources stem-ming from the atmosphere, the instrumentation, and the structure of the radio sources. Further-more, the following strategies are investigated:
• a reduction of the random component of the delay-observable error, e.g., the per-observation measurement error, the stochas-tic properties of the clocks, and the unmod-eled variation in the atmosphere
• a reduction of systematic errors, e.g., the thermal and gravitational deflection of the antenna, drifts of the electronics, and radio source structure
• an increase of the number of antennas for geodetic VLBI and an improvement of their geographic distribution
• an increase of observation density, i.e., the number of observations per unit time • a reduction of susceptibility to external
radio-frequency interference
2
Increasing the Number of
Observations per Day
Increasing the number of observations per day depends on three factors:
• decreasing the length of time to slew from source to source
• decreasing the time to acquire data while on a source
• improving the scheduling algorithm
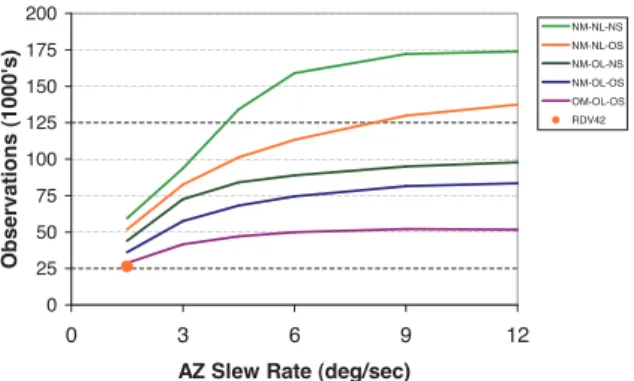
Although the steps taken to increase the num-ber of observations have been successful, the effort has shown that more work needs to be done to optimize the sky coverage in the short (< 10 minute) intervals corresponding to the at-mospheric variability, perhaps at the expense of the total number of observations. Figure 1 shows the number of observations as a function of slew speed of the antennas and different observing strategies. 0 25 50 75 100 125 150 175 200 0 3 6 9 12
AZ Slew Rate (deg/sec)
O b s e rv a ti o n s ( 1 0 0 0 's ) NM-NL-NS NM-NL-OS NM-OL-NS NM-OL-OS OM-OL-OS RDV42
Fig. 1. Number of observations as a function of slew speed of the antennas. All schedules were gener-ated assuming identical 12 meter antennas. Improve-ments in hardware, software and source selection all contribute to an increase of the number of observa-tions. Shown are the effects of OM (old mode, i.e. standard observing mode where data are recorded as they are observed), NM (new mode, i.e. “burst mode” where data are buffered and then written to a disk), OL (old list, i.e. old geodetic radio soure list), NL (new list, i.e. new extended geodetic ra-dio source list), OS (old scheduling , i.e. standard scheduling strategy), and NS (new scheduling, i.e. new scheduling strategy). For comparison we also include the results for RDV42, a recent VLBI session involving 10 VLBA stations (slew speed 1.5 deg/sec) and 9 other stations (various slew speeds) as a red dot. The remaining curves (from bottom to top) are: 1) OM–OL–OS; 2) NM–OL–OS; 3) NM–OL–NS; 4) NM–NL–OS; 5) NM–NL–NS.
Table 1. Specifications of the current VLBI system and the VLBI2010 system.
parameter current VLBI system planned VLBI2010 system
antenna size 5−100 m dish ∼ 12 m dish
slew speed ∼ 20–200 deg/min ≥360 deg/min
sensitivity SEFD 200–15 000 SEFD ≤ 2 500
frequency range S/X-band ∼ 2–15 (18) GHz
recording rate 128, 256 Mbps 8–16 Gbps
data transfer usually disk shipping e-transfer, e-VLBI
some e-transfer disk shipping when required
3
Decreasing the per Observation
Measurement Error
Recent technological advances have made it eco-nomically feasible to simultaneously use several (four or more) frequency bands spread across a wide frequency range, e.g. 2 GHz to 15 GHz. Analysis shows that, with such systems, VLBI phase ambiguities can be reliably resolved, re-sulting in typical delay precision of about 2.5 ps (less than 1 mm) (Petrachenko, 2007). For com-parison, with current group delay systems, the per-observation delay measurement error is typ-ically about 10–30 ps. Table 1 gives an overview of the key-parameters of the current VLBI sys-tem and the planned VLBI2010 syssys-tem.
To demonstrate that this broadband delay concept will work in practice, NASA is support-ing an R&D project to build a proof-of-concept “broadband” system and to evaluate its perfor-mance under real-world conditions. Major chal-lenges for the concept include successful opera-tion in the presence of RFI, realistic radio source structure, and uncalibrated instrumental offsets. The principal components of the new system are:
• Broadband dual linearly polarized feeds cov-ering 2 GHz to ∼15 GHz (see e.g. Figure 2) • Broadband low noise amplifiers for 2 GHz
to 15 GHz
• Digital backends with four 512 MHz chan-nels each and 2 bits/sample
• Mark5B+ recorders (Whitney, 2007) with 2 gigabits per second
Initial tests will be performed on a ∼ 600 km long baseline using the Westford (near Boston) 18 m antenna and the GGAO (at Goddard Space Flight Center, Washington, D.C.) 5 m antenna.
Fig. 2. The ETS-Lindgren quad-ridge broad band feed-horn (ETS-Lindgren, 2007) inside a heat shield attached to the 15 K station of the cryogenic refrig-erator. The dewar is on the right hand.
The proof-of-concept system will record both lin-ear polarizations from four 500 MHz bands that can be independently positioned in the frequency range from 2 GHz to approximately 12 GHz. The aggregate data rate at each site will be 8 Gbps us-ing four Mk5B+’s (Whitney, 2007) and two Dig-ital Back Ends (DBEs) (Whitney et al., 2007).
Detailed designs are at an advanced stage, parts are being acquired and assembled, and the first tests are expected in autumn of 2007.
4
Simulations
As part of the development of specifications for the new VLBI2010 observing system, the IVS has been performing simulations to evaluate the geodetic performance of VLBI2010 networks. Monte Carlo simulations with different system specifications have been performed by geodetic analysis using simulated data consisting of tropo-sphere, clock, and thermal noise delay contribu-tions. The o-c vector (observed minus computed
group delay) is set up as follows: o-c = !WZD2· mfw2(!) + CL2 " (1) − ! WZD1· mfw1(!) + CL1 " + WNBsl
For each observable, WZD1,2 and CL1,2 are the
simulated wet zenith delay and clock values at station 1 and 2, respectively, and mfw1,2(!) are
the wet mapping functions for the elevation angle !. The wet mapping functions are assumed to be without error in our studies. For each baseline a white noise contribution WNBsl is added.
The clock values are simulated as the sum of a random walk plus an integrated random walk (Herring et al., 1990). These processes are driven by white noise with a PSD (power spectral den-sity) of 0.3 ps2
/s for the random walk and 0.1 (fs/s)2/s for the integrated random walk.
The wet zenith delay values are simulated with a turbulence model that is described in de-tail in Nilsson et al. (2007). This model has been empirically verified with microwave radiom-etry by Nilsson et al. (2005) and Nilsson et al. (2006). The turbulence model uses as input station dependent structure constants Cn,
tro-pospheric height h, saturation scale length L and wind speed and direction. The wind speed and direction and the tropospheric height for the VLBI2010 simulations are taken from the ERA40 numerical weather model (ERA40, 2007) of the European Center for Medium-Range Weather Forecast (ECMWF, 2007). The structure con-stants are derived by an empirical fit to high-resolution radiosonde data, and the saturation scale length is fixed to the values proposed by Treuhaft and Lanyi (1987).
Once the o-c vector is created the simulations allow us to investigate optimal network antenna locations, antenna sensitivities, slew rates and observing schedules.
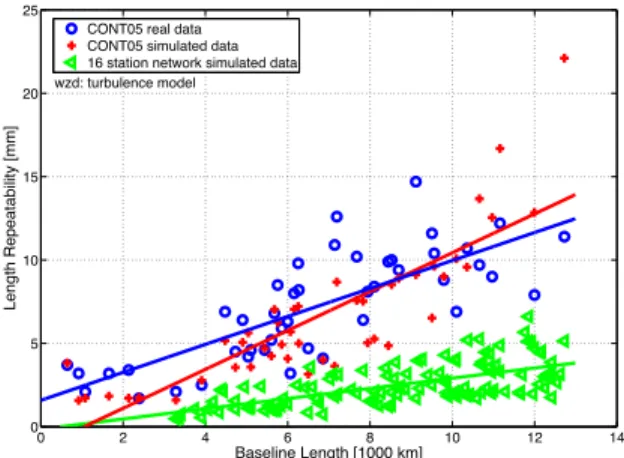
Figure 3 compares the results of an analysis of real CONT05 data (which is the best VLBI data set to date), a Monte Carlo simulation of the CONT05 data, and a Monte Carlo simula-tion of an anticipated VLBI2010 observing sce-nario. Both simulations were carried out with parameterizations of the atmospheres, clocks and measurement errors intended to be as realistic as possible. In both cases, the wet zenith delays are simulated using the turbulence model while the clocks are simulated using the random walk plus integrated random walk model constrained by an
0 2 4 6 8 10 12 14 0 5 10 15 20 25 wzd: turbulence model Baseline Length [1000 km] Length Repeatability [mm]
CONT05 real data CONT05 simulated data 16 station network simulated data
Fig. 3. Baseline length repeatability as a function of baseline length: The blue dots show the analy-sis of real CONT05 data. The red crosses show the analysis of simulated CONT05 data using the Monte
Carlo simulator with clock parameters of 1 · 10−14
at 50 min, a turbulence model for the tropospheric parameters, and delay measurement errors based on the real CONT05 observation errors. The green tri-angles show the simulation of a 16 station network of VLBI2010 antennas. Here the clock and atmosphere delays are simulated as for the CONT05 simulation, and a delay measurment error of 4 ps was used.
Allan Standard Deviation (ASD) of 1 · 10−14 at
50 min. In the case of the CONT05 simulation, the delay measurement errors are based on the observing errors of the real observations, which have a mean value over all observed baselines of 29 ps. For the VLBI2010 simulation, a delay measurement error of 4 ps, which is realistic for phase delays, is used for all observations.
5
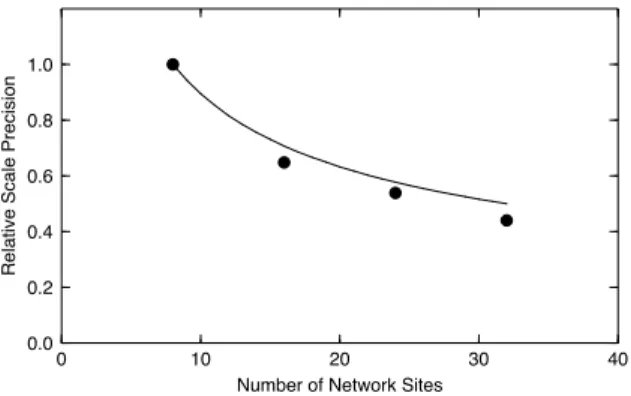
Network Size
A series of Monte Carlo runs were performed to evaluate the relative performance of networks of different size. For this purpose, a series of theoretical networks were generated that have roughly uniform global coverage and use plau-sible locations (e.g. the sites are on land and are co-located with GPS). These simulations in-dicate that the VLBI2010 network could improve the determination of the TRF scale to roughly several parts in 1010
in a single session, compared to the current level of determination of the TRF scale of about less than one part in 109
.
Figure 4 shows the precision of the relative scale parameter as a function of the number of network stations. Simulation and analysis of the
0.0 0.2 0.4 0.6 0.8 1.0
Relative Scale Precision
0 10 20 30 40
Number of Network Sites
Fig. 4. Terrestrial Reference Frame scale parameter precision from Monte-Carlo simulations. Precision is expressed relative to the precision of the 8-site
net-work. The line represents a simple (1/√n)-law.
dependence of EOP quality on the network size have shown an expected twofold improvement in both EOP precision and accuracy compared to existing regular IVS networks. Figure 5 shows an example of a test network with 16 stations with VLBI2010 antennas.
Fig. 5. Example of a 16 station test network of VLBI2010 antennas.
6
Source Structure Corrections
As we approach 1 mm precision, source structure becomes an ever more significant error compo-nent for geodetic VLBI. Furthermore, it signifi-cantly degrades our potential to use the proposed “broadband delay” technique to access VLBI’s precise phase delay observable. As a result, it will be important to apply appropriate modeling
to correct for such source structure errors. As an example, Figure 6 (Charlot, 2002) shows in the top a contour plot of the X-band radio emission for a structure index 3 radio source, and in the bottom the corresponding absolute values of structural delays for this source for baselines up to the length of one Earth diameter.
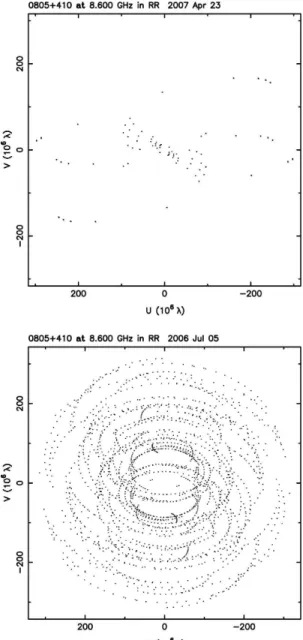
There is also temporal variation of radio source structure as for example shown in Fig-ure 7 (Charlot, 2002) for a typical X-band radio source that is regularly observed by the IVS. This phenomenon is impossible to address with the current VLBI system. With the new VLBI2010 observing scenarios that include larger networks and a manifold increase in the number of ob-servations per session, UV-coverage will improve to the point where precise VLBI images of the ICRF sources can be constructed on a daily ba-sis directly from the geodetic observations, there-fore enabling source structure corrections to be calculated. Simulations are currently underway to evaluate the potential of this approach. Fig-ure 8 shows the UV-coverage of a typical IVS experiment in today’s R1-series compared to the UV-coverage of a VLBI2010 schedule.
7
Summary
As part of the IVS VLBI2010 renewal process studies are carried out to develop requirements for achieving 1 mm position accuracy on global length baselines. This is a work in progress. The highlights of this work include:
• Studies show that faster slewing antennas, burst mode recording and improved schedul-ing algorithms yield a quantum increase in VLBI observations per session.
• Proof-of-concept tests are in preparation to demonstrate the broadband delay technique for achieving an order of magnitude im-provement in delay precision.
• Monte Carlo simulators have been devel-oped to evaluate the benefits of improved instrumentation and scheduling strategies. • The Monte Carlo simulators are being
cali-brated against CONT05 real data.
• Monte Carlo results indicate that increased observation density and delay precision lead to precisions of positions in the range 1.5– 3.5 mm. Better scheduling and analysis
Fig. 6. Top: Contour plot of the X-band radio emis-sion for a structure index 3 source. Structure in-dex 3 indicates that the median structure error over all possible baselines is between 10 picoseconds (ps) and 30 ps. About 35% of the current ICRF defin-ing sources are in this structure class. Bottom: The corresponding absolute values of structural delays for this source. The structural delay is plotted as a func-tion of the length and orientafunc-tion of the VLBI base-line projected onto the sky, expressed in millions of wavelengths (u, v coordinates), and the color coded scale ranges from 0 to 100 ps. The circle drawn in this plot has a radius equal to one Earth diameter, corresponding to the longest baselines that can be theoretically observed with Earth-based VLBI.
Fig. 7. (Charlot, 2002) VLBI images of 2200+420 at X-band for 10 successive epochs, spanning the period 1997.1–1998.6, as available from (Fey et al., 2002).
Fig. 8. Top: UV-coverage of a typical
R1-experiment. Bottom: UV-coverage of a VLBI2010 schedule.
strategies are expected to lead to further im-provements.
• Initial studies indicate that the increase in observation density and larger networks will enable active source structure corrections. Further simulations are underway.
Acknowledgement
J. B¨ohm and J. Wresnik are grateful to the Aus-trian Science Fund (FWF) for supporting this work within Project P18404-N10.
References
Charlot, P. (2002) Modeling Radio Source
Structure for Improved VLBI Data
Anal-ysis. In: International VLBI Service for
Geodesy and Astrometry 2002 General Meeting
Proceedings, N. Vandenberg and K. Baver
(Eds.), NASA/CP-2002-210002, pp.
233–242, ftp://ivscc.gsfc.nasa.gov/pub/
general-meeting/2002/pdf/charlot.pdf ECMWF: http://www.ecmwf.int/
ERA40: http://data.ecmwf.int/research/era/
ETS-Lindgren horn: http://www.ets-lindgren.
com/page/?i=3164-05
Fey, A.L, D.A. Boboltz, R.A. Gaume, and
K.A. Kingham (2002). USNO Analysis
Cen-ter for Source Structure Report. In:
Inter-national VLBI Service for Geodesy and As-trometry 2001 Annual Report, N. Vandenberg and K. Baver (Eds.), NASA/TP-2002-210001, pp. 249–252. ftp://ivscc.gsfc.nasa.gov/pub/ annual-report/2001/pdf/acusnoss.pdf Herring, T.A., J.L. Davis, and I.I. Shapiro (1990).
Geodesy by radio interferometry: the application of Kalman filtering to the analysis of very long baseline interferometry data. J. Geophys. Res., 95(B8), pp. 12561–12581.
Niell, A., A. Whitney, B. Petrachenko, W. Schl¨uter,
N. Vandenberg, H. Hase, Y. Koyama, C. Ma, H. Schuh, and G. Tuccari (2006). VLBI2010: Current and future requirements of
geode-tic VLBI systems. In: International VLBI
Service for Geodesy and Astrometry 2005
Annual Report, D. Behrend and K. Baver
(Eds.), NASA/TP-2006-214136, pp.
13–40. ftp://ivscc.gsfc.nasa.gov/pub/
annual-report/2005/pdf/spcl-vlbi2010.pdf Nilsson, T., L. Gradinarsky, and G. Elgered (2005).
Correlations Between Slant Wet Delays Measured by Microwave Radiometry. IEEE Trans. Geosci. Rem. Sens., GE-43(5), pp. 1028–1035.
Nilsson, T., G. Elgered, and L. Gradinarsky (2006). Characterizing Atmospheric Turbulence and In-strumental Noise Using Two Simultaneously Op-erating Microwave Radiometers. In: Proc. 9th Specialist Meeting on Microwave Radiometry and Remote Sensing Applications, MicroRad 2006, pp. 270–275.
Nilsson, T., R. Haas, G. Elgered (2007). Simu-lations of atmospheric path delays using
tur-bulence models. In: Proc. of the 18th
Euro-pean VLBI for Geodesy and Astrometry
Work-ing MeetWork-ing, J B¨ohm, A Pany, H Schuh (Eds.),
Geowissenschaftliche Mitteilungen, Schriftenreihe der Studienrichtung Vermessung und
Geoinfor-mation, Technische Universit¨at Wien, 79, pp.
175–180. http://mars.hg.tuwien.ac.at/∼evga/
proceedings/S64 Nilsson.pdf
Pearlman, M., Z. Altamimi, N. Beck, R. Fors-berg, W. Gurtner, S. Kenyon, D. Behrend, F.G. Lemoine, C. Ma, C.E. Noll, E.C. Pavlis, Z. Malkin, A.W. Moore, F.H. Webb, R.E. Neilan,
J.C. Ries, M. Rothacher, and P. Willis
(2006). Global Geodetic Observing System– Considerations for the Geodetic Network Infras-tructure. Geomatica, 60(2), pp. 193–204.
Petrachenko, B. (2007). Achieving a Quantum Leap in Observation Density. In: International VLBI Service for Geodesy and Astrometry 2006 General Meeting Proceedings, D. Behrend and
K. Baver (Eds.), NASA/CP-2006-214140,
pp. 67–71, ftp://ivscc.gsfc.nasa.gov/pub/
general-meeting/2006/pdf/petrachenko.pdf
Schl¨uter, W., and D. Behrend (2007). The
Interna-tional VLBI Service for Geodesy and Astrometry (IVS): current capabilities and future prospects. Journal of Geodesy, 81(6-8), pp. 379–387. Schuh, H., P. Charlot, H. Hase, E. Himwich, K.
King-ham, C. Klatt, C. Ma, Z. Malkin, A. Niell,
A. Nothnagel, W. Schl¨uter, K. Takashima, and
N. Vandenberg (2002). IVS Working Group 2 for Product Specification and Observing Programs. In: International VLBI Service for Geodesy and Astrometry 2001 Annual Report, N. Vandenberg and K. Baver (Eds.), NASA/TP-2002-210001,
pp. 13–45, ftp://ivscc.gsfc.nasa.gov/pub/
annual-report/2001/pdf/wg2 report 2.pdf Treuhaft, R.N., and G.E. Lanyi (1987). The effect
of the dynamic wet troposphere on radio interfer-ometry measurements. Radio Science, 22(2), pp. 251–265.
Whitney, A. (2007). The Mark 5 VLBI Data System. In: Proc. of the 18th European VLBI for Geodesy and Astrometry Working Meeting,
J B¨ohm, A Pany, H Schuh (Eds.),
Studienrichtung Vermessung und
Geoinfor-mation, Technische Universit¨at Wien, 79, pp.
33–38. http://mars.hg.tuwien.ac.at/∼evga/
proceedings/S21 Whitney.pdf
Whitney, A.R, S.S Doeleman, B. Fanous, H.F. Hin-teregger, and A.A.E. Rogers (2007). A Wide-Band VLBI Digital Backend System. In: Interna-tional VLBI Service for Geodesy and Astrometry 2006 General Meeting Proceedings, D. Behrend and K. Baver (Eds.), NASA/CP-2006-214140,
pp. 72–76, ftp://ivscc.gsfc.nasa.gov/pub/
general-meeting/2006/pdf/Whitney2.pdf