HAL Id: hal-00317917
https://hal.archives-ouvertes.fr/hal-00317917
Submitted on 7 Mar 2006
HAL is a multi-disciplinary open access
archive for the deposit and dissemination of
sci-entific research documents, whether they are
pub-lished or not. The documents may come from
teaching and research institutions in France or
abroad, or from public or private research centers.
L’archive ouverte pluridisciplinaire HAL, est
destinée au dépôt et à la diffusion de documents
scientifiques de niveau recherche, publiés ou non,
émanant des établissements d’enseignement et de
recherche français ou étrangers, des laboratoires
publics ou privés.
Numerical simulation of 3-D flow around sounding
rocket in the lower thermosphere
J. Kurihara, K.-I. Oyama, N. Iwagami, T. Takahashi
To cite this version:
J. Kurihara, K.-I. Oyama, N. Iwagami, T. Takahashi. Numerical simulation of 3-D flow around
sounding rocket in the lower thermosphere. Annales Geophysicae, European Geosciences Union, 2006,
24 (1), pp.89-95. �hal-00317917�
SRef-ID: 1432-0576/ag/2006-24-89 © European Geosciences Union 2006
Annales
Geophysicae
Numerical simulation of 3-D flow around sounding rocket in the
lower thermosphere
J. Kurihara1, K. -I. Oyama1, N. Iwagami2, and T. Takahashi3
1Institute of Space and Astronautical Science, Japan Aerospace Exploration Agency, Sagamihara, Kanagawa 229-8510, Japan 2Dept. of Earth and Planetary Science, Graduate School of Science, University of Tokyo, Bunkyo-ku, Tokyo 113-0033, Japan 3Information Science Laboratory, Tokai University, Hiratsuka, Kanagawa 259-1292, Japan
Received: 23 July 2005 – Revised: 29 November 2005 – Accepted: 21 December 2005 – Published: 7 March 2006
Abstract. Numerical simulations using the Direct Simula-tion Monte Carlo (DSMC) method are known to be useful for analyses of aerodynamic effects on in-situ rocket measure-ments in the lower thermosphere, but the DSMC analysis of a spin modulation caused by an asymmetric flow around the rocket spin axis has been restricted to the two-dimensional and axially symmetric simulations in actual sounding rocket experiments. This study provides a quantitative analysis of the spin modulation using a three-dimensional (3-D) simula-tion of the asymmetric flow with the DSMC method. Clear spin modulations in the lower thermospheric N2density
mea-surement by a rocket-borne instrument are simulated using the rocket attitude and velocity, the simplified payload struc-ture, and the approximated atmospheric conditions. Compar-ison between the observed and simulated spin modulations show a very good agreement within 5% at around 100 km. The results of the simulation are used to correct the spin mod-ulations and derive the absolute densities in the background atmosphere.
Keywords. Atmospheric composition and structure (Pres-sure, density and temperature; Thermosphere-composition and chemistry; Instruments and techniques)
1 Introduction
Atmospheric in-situ measurements using sounding rockets are affected by aerodynamic effects caused by the super-sonic motion of the rocket. For typical rocket experiments in the mesosphere and lower thermosphere region, the aerody-namic condition is generally regarded as a transition regime from continuum flow to free molecular flow. The Direct Sim-ulation Monte Carlo (DSMC) method (Bird, 1994) is widely used to simulate a flow under such a transition regime and ap-plied to a variety of fields. The first application of the DSMC method to rarefied atmospheric flow in a sounding rocket
ex-Correspondence to: J. Kurihara
periment was made by Bird (1988). Since then, the DSMC method has been recognized as a powerful numerical tool for the analysis of in situ measurements and applied to a wide variety of measurement techniques (e.g. Gumbel et al., 1998; Hor´anyi et al., 1999; Gumbel, 2001a,b; Rapp et al., 2001; Sternovsky et al., 2004).
An angle of attack, α, which is defined as the angle be-tween the rocket spin axis and the velocity vector, is an im-portant parameter for the flow pattern around the rocket. If
αhas a value other than 0◦, the flow pattern becomes asym-metric with respect to the rocket spin axis. Previous stud-ies using the DSMC method for actual sounding rocket ex-periments have been restricted to the two-dimensional (2-D) and axially symmetric simulations, and did not treat the an-gles of attack other than 0◦directly. Rapp et al. (2001) uti-lized the result of the DSMC simulation (Gumbel, 2001b) indirectly, together with a conversion factor experimentally determined by wind tunnel measurements as a function of
α, and corrected the aerodynamical effect in the asymmet-ric flow. However, a fully 3-D simulation of the asymmetasymmet-ric flow is required for the analysis of a spin modulation, which is the variation of the measured quantity synchronized with the rocket spin frequency. The spin modulation is usually ob-served with side-looking instruments when α6=0◦(Gumbel, 2001a).
This paper reports on a quantitative analysis of the spin modulation using the 3-D simulation of the flow around the sounding rocket. Clear spin modulations were seen in the atmospheric N2density measurement in the lower
ther-mosphere with a rocket-borne N2 temperature instrument
(NTV), which is a side-looking instrument using the Electron Beam Fluorescence (EBF) technique (Kurihara and Oyama, 2005). The angle of attack monitored by an attitude sensor onboard the rocket is used as an input parameter in the nu-merical simulation. The DSMC method is used to simulate the asymmetric density fields around the rocket. The results of the simulation are compared with the measured density variations and applied to correct the spin modulations and determine the absolute densities.
90 J. Kurihara et al.: Numerical simulation of 3-D flow around sounding rocket
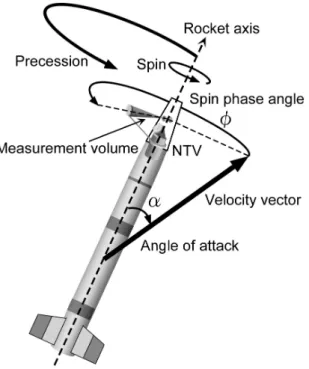
Fig. 1. Definition of the rocket attitude and motion.
2 Rocket observation
The atmospheric N2density measurement was conducted in
Japan on 6 February 2002 (Kurihara et al., 2003). The sound-ing rocket on which the NTV instrument was installed was launched at 19:30 LT from Kagoshima Space Center and reached an apogee altitude of 151.8 km at 190 s after the launch. The measurements by NTV were made in the 100.0– 151.8 km altitude region during the ascent of the flight and in 151.2–95.0 km during the descent. The NTV instrument consists of an electron gun to excite and ionize the ambi-ent N2and a sensitive spectrometer to detect the subsequent
fluorescence spectrum of the N+2 1st Negative (1N) bands based on the EBF technique. This instrument is designed to measure vibrational and rotational temperatures, in addition to the number density of N2. The temperatures are derived
from the band shape of the N+2 1N bands, and the number density is determined from the intensity of the band. Further details of the instrument and its calibration in the laboratory are given by Kurihara and Oyama (2005). The exposure time for each spectrum is 240 ms and the average spin period of the rocket is about 920 ms; roughly four spectra are obtained per spin. The measurement volume of NTV is located to the side of the payload, and thus NTV scans the density field around the rocket with the spin motion. As a result, the num-ber density derived from one spectrum is the average value of the density field scanned over one-fourth of the spin period. The measured densities are strongly contaminated by aero-dynamical effects and the spin modulations are clearly ob-served in the density profiles. In this paper, the density data measured only in the ascent are studied because the angle of
100 150
0 30 60
Altitude [km]
Angle of attack α [deg] (b) IAF Interpolation (b) (a) + Pc North East South West Zenith 0o 90o 180o 270o 10o 20o 30o 40o 55s 86s 155s 199s 255s IAF Interpolation
Fig. 2. (a) Direction of the rocket axis. The IAF measure-ments (open circles) were obtained only 57–86 and 155–255 s after the launch, and the missing data during 86–155 s are interpolated (closed circles) by assuming a stable precession, whose center is indicated by “Pc”. Arrows indicate the direction of the precession.
(b) Angle of attack variation in the ascent derived from the attitude
data in Fig. 2a.
attack measurement by the attitude sensor is not available in the descent as described below.
Figure 1 shows the definition of the rocket attitude and motion, and the attitude generally changes with a periodic motion, called precession, which is a rotation of the rocket axis, whereas spin is a rotation around the rocket axis. In this experiment, the rocket attitude and motion are measured with the Geomagnetic Aspectmeter (GA) and the Imaging Attitude Finder (IAF) on board the rocket. GA has two sen-sors to measure the horizontal and vertical components of the geomagnetic field vector with respect to a cross sectional plane of the rocket and can obtain the spin period of the rocket and the angle between the rocket axis and the geo-magnetic field vector. IAF is a two-dimensional star sensor using a multi-anode photomultiplier tube and can determine the direction of the rocket axis with an accuracy of 2 de-grees. However, the fluorescence induced by NTV was much brighter than expected, and the output signal of IAF was sat-urated most of the time during the emission of the electron beam. Figure 2a shows the direction of the rocket axis in the alt-azimuth coordinates. The IAF measurements are limited to 57–86 s (66–99 km altitudes in the ascent) and to 155– 255 s (from 145 km in the ascent to 134 km in the descent) after the launch. The rocket was separated after the apogee (199 s) into mother/daughter payloads. The mother payload includes a solid rocket motor and a Langmuir probe, and the daughter payload includes NTV and the attitude sensors. The purpose of the separation is to electrically isolate the Lang-muir probe from NTV, because the electron beam emission by NTV causes significant charging of the rocket body for the Langmuir probe measurement of the ambient plasma. After the rocket separation, the precession of the rocket became smaller and more rapid, and the direction of the rocket axis
was almost stationary. The missing attitude data during 86– 155 s are interpolated by assuming a stable precession of the rocket axis before the separation. The center and the radius of the precession circle are determined by a least-squares fit-ting to the IAF data points. The interpolated attitude data are consistent with the variation of the geomagnetic field vector measured by GA. Figure 2b shows the angles of attack de-rived from the above attitude data in the ascent. The angle of attack varies between 20–60◦during the NTV measurement and is large enough to cause the asymmetric flow.
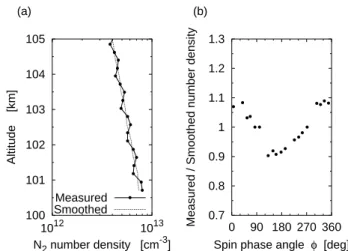
In order to analyze the characteristics of the spin modu-lation, the spin phase angle distribution of relative density changes is examined. The spin phase angle, φ, is defined as an angle between the rocket velocity vector and the look di-rection of NTV in a plane perpendicular to the rocket axis, as shown in Fig. 1. Accordingly, the location of the measure-ment volume with respect to the flow direction is represented as a function of φ; φ=0◦ corresponds to the front side of the rocket and φ=180◦corresponds to the rear side of the rocket. The relative density change is defined by the ratio of the measured density to the smoothed density. Considering that four density data are sampled per spin, it is appropri-ate to perform a running average over five data points for smoothing the density profile. Figure 3a shows the measured and smoothed density profile between 100–105 km altitudes during the ascent of the rocket. Figure 3b shows the rela-tive density changes plotted as a function of φ. The relarela-tive density change shows a 10% increase at φ=0◦ and a 10% decrease at φ=180◦. These features are typical spin modula-tion, commonly called “ram/wake modulation”, originating from compression/rarefaction in the density field around the rocket. Similar characteristics of the relative density change are found in the other altitude ranges, as shown later.
3 Direct simulation Monte Carlo calculations (DSMC)
The DSMC method is applied to a fully 3-D simulation of the flow around the rocket. Details of the DSMC method are described in Bird (1994). The most fundamental principle of the DSMC method is an approximation that the motions and collisions of molecules are uncoupled during a short time step. For the realization of this approximation, the time step should be sufficiently shorter than the mean free time of the collisions. The approximation also requires the size of sampling cells to be larger than the moving distances of molecules during the time step, but to be small compared to the length scale of local flow gradients, as well as the mean free path. The length scale of local gradients depends on the size and shape of the object in the flow. This means that the size of the cells and the time step have upper limits. These two requirements basically determine the total time steps and the total number of the cells, namely computing capacity re-quired for the simulations. In rarefied atmospheric flow sim-ulations, the mean free time and the mean free path increase rapidly with an increase in altitude. If the time step reaches at the upper limit, the total time steps of the simulation grow
100 101 102 103 104 105 1012 1013 Altitude [km] N2 number density [cm-3] (a) Measured Smoothed 0.7 0.8 0.9 1 1.1 1.2 1.3 0 90 180 270 360
Measured / Smoothed number density
Spin phase angle φ [deg] (b)
Fig. 3. Effect of spin modulation on the measured density
pro-file between 100–105 km altitudes in the ascent. (a) Measured and smoothed profiles. (b) Relative density changes plotted as a func-tion of the spin phase angle.
with increasing altitude because the sampling of macroscopic properties in the flow is performed at a time interval compa-rable to the mean free time. On the other hand, the total number of the cells increases with decreasing altitude, be-cause the size of the cell should be smaller than the mean free path. As a result, the DSMC simulation for the flow around a sounding rocket is generally efficient at the altitudes of 100– 120 km, and more powerful computing capacity is needed at lower and higher altitudes. For this reason, the fully 3-D simulation for the lower thermospheric conditions in this study are practical for present-day PCs but it is still diffi-cult to accomplish the calculations for the mesospheric con-ditions. Details of the numerical code and cell schemes used in this simulation have been provided by Kurihara (2004).
The numerical simulation is performed by providing the necessary input parameters, viz., angle of attack, rocket ve-locity, geometry of the payload, and background atmospheric conditions. As mentioned previously, the angle of attack is a critical parameter controlling the asymmetry of the flow. The rocket velocity and the background atmospheric tem-perature are also important for determining the Mach num-ber (Ma) of the flow. The tangential velocity components caused by the spin of the rocket are not considered in the simulations because they can be neglected compared to the supersonic speeds of the rocket. For example, the tangen-tial velocity of the spin is about 1 m/s at the surface of the rocket, while the rocket velocity is more than 1 km/s. Al-though the actual payload has a complex geometry, the sim-ulated payload is simplified as a truncated cone. However, the complex geometry of the payload is of minor impor-tance for the simulation, because the measurement volume of NTV is much larger than the size of the components of the payload. The background atmospheric parameters, such as atmospheric temperature and density, should be carefully considered in this simulation, because the measured temper-ature and density profiles are significantly different from the
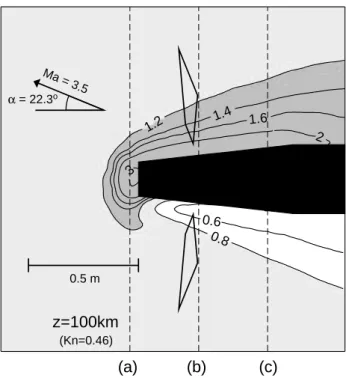
92 J. Kurihara et al.: Numerical simulation of 3-D flow around sounding rocket 0.6 0.6 0.8 0.8 1.2 1.4 1.6 2 3 0.5 m α = 22.3o Ma = 3.5
z=100km
(Kn=0.46)(a)
(b)
(c)
Fig. 4. Calculated relative density field around the rocket at 100-km
altitude.
empirical atmospheric model (Kurihara et al., 2003). There-fore, instead of the empirical atmospheric model values, the smoothed measurement values are adopted as the back-ground atmospheric parameters, except for the relative com-position. The measured N2number densities are smoothed
and then converted to the total number densities using the relative composition from the MSISE-90 atmospheric model (Hedin, 1991). The present study uses a hard sphere model for simulating particles in the flow and simplifies the atmo-spheric molecules to a single gas (air). Assuming that the particle is a hard sphere with a diameter of d, the mean free path of the gas particles, λ, is expressed as a function of the total number density of the particles, n, by λ=1/(
√
2π d2n). The rarefied gas flow is characterized by the Knudsen num-ber, Kn=λ/L, where L is the characteristic length of the ob-ject. In the case of the flow around the sounding rocket, a diameter of the rocket is usually taken as the characteristic length.
Results of the above-described DSMC calculations pro-vide the complex 3-D nature of the flow. As an example, Fig 4 shows a calculated relative density field, which is the ratio of the calculated density to the background atmospheric density. This figure is presented in a cross-sectional plane, including the rocket spin axis and the velocity vector, and the simulation is done for the flight condition corresponding to the altitude of 100 km. The black region represents the payload geometry, and the quadrangular regions indicate the measurement volume of NTV. The arrow indicates the ve-locity vector of the rocket, and in turn, the supersonic flow moves in the opposite direction to the arrow. The flow prop-erties α, Ma, and Kn, are 22.3◦, 3.5, and 0.46, respectively.
(a) 1.2 (b) 1.2 (c) 0.8 1.2 1.6
Fig. 5. Cross-sectional views of the calculated relative density field
at (a), (b), and (c) in Fig. 4.
0.6 0.6 0.8 0.8 0.8 1.2 1.4 1.6 2 2 z=100km (Kn=0.46) α=22.3o Ma=3.5 0.6 0.6 0.8 0.8 0.8 1.2 1.4 1.6 2 z=120km (Kn=20) α=28.8o Ma=2.0 0.8 0.8 1.2 1.4 1.6 z=140km (Kn=57) α=28.1o Ma=1.4 1.2 1.2 1.2
Fig. 6. Calculated relative density fields for 100, 120, and 140-km
altitudes. Right panels show the cross-sectional views of the relative density fields at the dashed lines in the left panels.
The relative density field is shown by the contours and gray scale. The density is doubled near the front surface of the payload by compression and decreases 50% right behind the payload by rarefaction. The measurement volume is located at the higher density region in the front side of the payload and at the slightly lower region in the rear side. This situ-ation illustrates the ram/wake modulsitu-ation seen in the obser-vation. Figures 5a, 5b, and 5c show cross-sectional views
0.8 0.9 1 1.1 1.2 1.3 1.4 0 90 180 270 360 Relative density
Spin phase angle φ [deg] (a) 100km 120km 140km 0.8 0.9 1 1.1 1.2 1.3 1.4 0 90 180 270 360
Normalized relative density
Spin phase angle φ [deg] (b)
100km 120km 140km
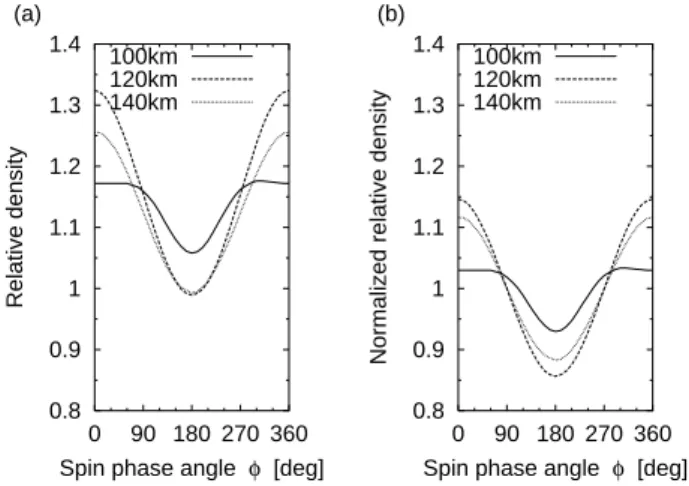
Fig. 7. (a) Relative densities simulating the NTV measurement and (b) normalized relative densities over the spin.
of the relative density field perpendicular to the rocket axis at (a), (b), and (c) in Fig. 4, respectively. The axially asym-metric nature of the flow is clearly seen in Figs. 5b and 5c. In particular, the folding density field around the payload is the most remarkable feature of the axially asymmetric flow, which can be reproduced only by the 3-D simulation. Similar features were found in the wind tunnel experiments but not in the 2-D simulations (Gumbel, 2001a), so far.
Results of the calculations for various altitudes are shown in Fig. 6. The arrows in the left panels are the same as for Fig. 4, but the relative lengths of the arrows correspond to the rocket velocities at the respective altitudes. In the left pan-els of Fig. 6, the relative density gradients around the rocket at 100 km are much steeper than at 120 km, and the relative density field undergoes a drastic change from a discrete pat-tern to a diffuse one between 100–120-km altitudes, but there is little change in the pattern above 120 km. These features of the flow patterns are more noticeable in the right panels of Fig. 6, and the folding density field at 100 km is substan-tially reduced above 120 km. These changes are mainly at-tributed to the transition from continuum flow (Kn<0.1) to free molecular flow (Kn 10), and the drastic change in the relative density field corresponds to a change in the prop-erty of the flow at around 110 km altitude, where Kn∼1: the mean free path of the gas particles is comparable to the char-acteristic length of the object. Although the Mach number also changes with altitude, a decrease in the Mach number decreases the magnitude of the maximum compression and rarefaction in the free molecular flow regime above 120 km. Gumbel (2001a) reported the altitude development with the 2-D simulation for α=0◦, which shows that the shock ef-fects decrease and focus towards the ends of the payload at high altitude. In the present 3-D simulation, the angles of at-tack are sufficiently large to form a shock front all along the payload and maintain a strong ram/wake modulation, even at high altitude.
The spin modulations are reproduced from these simula-tions for comparison with the observasimula-tions. The exact value
0.7 0.8 0.9 1 1.1 1.2 1.3 0 90 180 270 360
Measured / Smoothed number density
Normalized relative density
Spin phase angle φ [deg] Observation:100-105km
DSMC:100km DSMC:105km
Fig. 8. Relative density changes for the observation between the 100–105-km altitudes and the DSMC results for 100 and 105 km. The vertical axis corresponds to the measured/smoothed value for the observation and the normalized relative density for the DSMC results.
of the measured density cannot be reproduced straightfor-wardly from this simulation, because the background atmo-spheric density used in the simulation is based on the con-taminated N2density from the observation and the relative
composition from the empirical model. However, the results of the above simulations for the various altitudes show that the changes in the relative density field are small compared with those of the background density. This suggests that a simulated relative density can closely approximate the mea-sured relative density, even if the exact value of the back-ground density is unknown. Therefore, the spin modulation is simulated by the following two steps: the relative densi-ties are simulated according to the NTV measurement as a function of φ, and then normalized over the spin, by dividing the relative densities by the spin-average value of the rela-tive densities. This normalized relarela-tive density is defined as a simulated spin modulation. Figure 7a shows the relative densities simulated for various altitudes, and Fig. 7b shows the normalized relative densities. It should be noted that the relative densities in Fig. 7a are greater than one at any spin phase angle and any altitude. Even at φ=180◦, the density is higher than or equal to the background atmospheric den-sity, because the region which the measurement volume of NTV scans is dominated by the higher densities, as shown in the cross-sectional views in Fig. 6, and the density is derived from the scan over a wide range of angles (∼90◦). On the other hand, the normalized relative densities are greater than one at the front side but less than one at the rear side, as the result of the normalization. The results of these simulations indicate that the background atmospheric quantity is not al-ways obtained by a running average smoothing of the spin modulation observed with side-looking instruments.
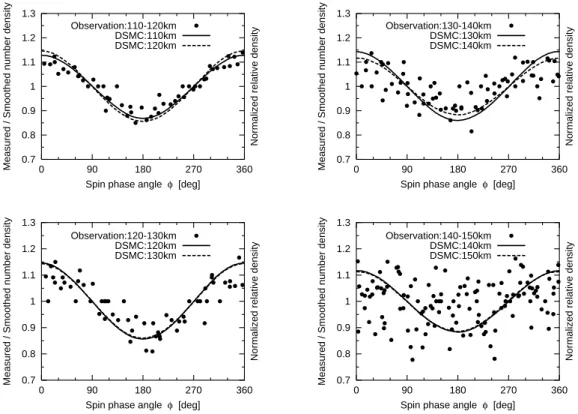
94 J. Kurihara et al.: Numerical simulation of 3-D flow around sounding rocket 0.7 0.8 0.9 1 1.1 1.2 1.3 0 90 180 270 360
Measured / Smoothed number density
Normalized relative density
Spin phase angle φ [deg] Observation:110-120km DSMC:110km DSMC:120km 0.7 0.8 0.9 1 1.1 1.2 1.3 0 90 180 270 360
Measured / Smoothed number density
Normalized relative density
Spin phase angle φ [deg] Observation:120-130km DSMC:120km DSMC:130km 0.7 0.8 0.9 1 1.1 1.2 1.3 0 90 180 270 360
Measured / Smoothed number density
Normalized relative density
Spin phase angle φ [deg] Observation:130-140km DSMC:130km DSMC:140km 0.7 0.8 0.9 1 1.1 1.2 1.3 0 90 180 270 360
Measured / Smoothed number density
Normalized relative density
Spin phase angle φ [deg] Observation:140-150km
DSMC:140km DSMC:150km
Fig. 9. Relative density changes for the observation and the DSMC results for various altitude regions.
4 Correction of the aerodynamic effects
The spin modulations from the observations and the DSMC results between the 100–105-km altitudes are compared, as shown in Fig. 8. In this altitude region, the observations and the DSMC results are in fairly good agreement within 5%. The precision of the density measurement is less than 1% at 100 km and much smaller than the difference between the observation and the simulation. The difference comes from both the uncertainty of the simulation model and small-scale perturbations in the background atmosphere. Despite the simplifications and approximations in the model, the sim-ulation is remarkably accurate in this altitude region. Similar comparisons at other altitudes are shown in Fig. 9. The ran-dom variations in the observed data grow exponentially with altitude, because the uncertainty of the density measurement is inversely proportional to the density. The relative density changes for the observations in Fig. 9 become scattered at higher altitudes, mainly because of this growth in the mea-surement uncertainty and, consequently, the spin modulation from the observations loses its character. It is therefore dif-ficult to quantify the accuracy of the simulations above 130-km altitude, but there is a clear deviation between the simu-lations and observations. On average, amplitudes of the spin modulation in simulations are larger than that in the obser-vations, while the basic features of ram/wake modulation are reasonably reproduced at all altitudes. These results imply that some simplifications and approximations in the model become less valid above 130 km. The simplification of a
sin-gle gas used in this model may be critical for simulations at high altitude because aerodynamic effects depend on the composition that changes rapidly with altitude in the lower thermosphere.
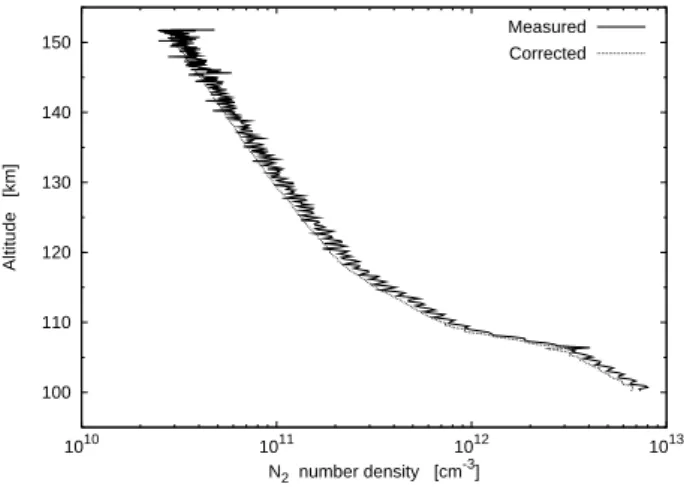
Since the validity of the present simulation is confirmed by the agreement between the observed and simulated spin modulations below 130-km altitude, the simulated relative densities are applied to correct the measured densities and determine the absolute densities. The correction is done by dividing the measured density by the relative density from the simulation. Figure 10 shows altitude profiles of the mea-sured and corrected densities. Note that the corrected profile above 110 km is smoothed by a running average, to cancel the uncertainty, because the large random variations remain in the measured densities at higher altitudes. However, even below 110 km, a smooth density profile is successfully ob-tained, and the spin modulation is significantly reduced. This result also supports the validity of the simulation. In addition, the corrected density profile is lower than the measured den-sity profile at almost all altitudes. As mentioned above, the reason is that the measured density is derived from a wide range of the scan, and the scanning region is dominated by the high relative densities.
Correction of the aerodynamic effects on in-situ measure-ments and the determination of the absolute density in the lower thermosphere are of increasing importance because the existing reference models turned out to be inaccurate in some cases. Rapp et al. (2001) have determined a total of 20 ab-solute density profiles from rocket-borne measurements with
100 110 120 130 140 150 1010 1011 1012 1013 Altitude [km] N2 number density [cm-3] Measured Corrected
Fig. 10. Altitude profiles of the measured and corrected density.
ionization gauges at high latitudes and found large discrep-ancies between their results and the reference atmospheres above 85 km altitude. In the present study, the derived ab-solute N2 density profile has a steep gradient at an altitude
range between 106–110 km, and at around 115–120 km, the N2density is significantly different from that of the
empiri-cal atmospheric model. Details of this structure will be dis-cussed in a future paper. The results of the simulations in this study demonstrated that the flow pattern around the rocket drastically changes between 100–120-km altitudes due to the transition from continuum flow to free molecular flow, but it is evident from Fig. 10 that the density drop at 106 km is not caused by the aerodynamical effects.
5 Conclusions
The results of the 3-D numerical simulation for the asym-metric flow around the sounding rocket using the DSMC method are compared with the spin modulations in the atmo-spheric N2density measurement by the rocket-borne
instru-ment. The observed and simulated spin modulations show generally a good agreement, even though the payload geome-try and the background atmosphere are simplified in the sim-ulation model. The simulated spin modsim-ulations with larger amplitudes than the observed at high altitude imply that com-positional change may be important for the rarefied flow sim-ulations in the lower thermosphere. The absolute N2density
profile is obtained by the correction of the spin modulations. The present study provides quantitative analysis to derive the absolute density, as well as qualitative illustration of the spin modulation. The 3-D simulation model used here is ap-plicable to other side-looking instruments, such as a reso-nance fluorescence instrument for atomic oxygen measure-ment, which usually suffers a crucial contamination by the spin modulation. In addition, if the 3-D simulations are ac-curate enough to identify which spin angle contains the back-ground values (or close to them), this information can be used as a filter on the measurements instead of smoothing all
the data, which, by definition, contains some bad data points deviated from the background values.
Acknowledgements. The authors would like to acknowledge T. Abe
(ISAS/JAXA) for discussion on the aerodynamic effects and intro-duction to the DSMC method. The authors also thank the rocket launching group of ISAS and all related government institutions for conducting the successful experiments.
Topical Editor U.-P. Hoppe thanks two referees for their help in evaluating this paper.
References
Bird, G. A.: Aerodynamic effects on atmospheric composition measurements from rocket vehicles in the thermosphere, Planet. Space Sci., 36, 921–926, 1988.
Bird, G. A.: Molecular gas dynamics and the direct simulation of gas flows, Oxford Univ. Press, Oxford, 1994.
Gumbel, J.: Aerodynamic influences on atmospheric in situ mea-surements from sounding rockets, J. Geophys. Res., 106, 10 553– 10 563, 2001a.
Gumbel, J.: Rarefied gas flows through meshes and implications for atmospheric measurements, Ann. Geophys., 19, 563–569, 2001b,
SRef-ID: 1432-0576/ag/2001-19-563.
Gumbel, J., Murtagh, D. P., Espy, P. J., and Witt, G.: Odd oxygen measurements during the Noctilucent Cloud 93 rocket campaign, J. Geophys. Res., 103, 23 399–23 414, 1998.
Hedin, A. E.: Extension of the MSIS thermosphere model into the middle and lower atmosphere, J. Geophys. Res., 96, 1159–1172, 1991.
Hor´anyi, M., Gumbel, J., Witt, G., and Robertson, S.: Simulation of rocket-borne particle measurements in the mesosphere, Geophys. Res. Lett., 26, 1537–1540, 1999.
Kurihara, J.: Energetics and structure of the lower thermosphere observed by sounding rocket experiment, Ph. D. thesis, The Uni-versity of Tokyo, 2004.
Kurihara, J. and Oyama, K.-I.: Rocket-borne instrument for measuring vibrational-rotational temperature and density in the lower thermosphere, Rev. Sci. Instrum., 76, 083101, doi:10.1063/1.1988189, 2005.
Kurihara, J., Oyama, K.-I., Suzuki, K., and Iwagami, N.: Vibrational-rotational temperature measurement of N2 in the lower thermosphere by the rocket experiment, Adv. Space Res., 32, 725–729, 2003.
Rapp, M., Gumbel, J., and L¨ubken, F.-J.: Absolute density mea-surements in the middle atmosphere, Ann. Geophys., 19, 571– 580, 2001,
SRef-ID: 1432-0576/ag/2001-19-571.
Sternovsky, Z., Holzworth, R. H., Hor´anyi, M., and Robertson, S.: Potential distribution around sounding rockets in mesospheric layers with charged aerosol particles, Geophys. Res. Lett., 31, L22101, doi:10.1029/2004GL020949, 2004.