HAL Id: hal-01321473
https://hal.sorbonne-universite.fr/hal-01321473
Submitted on 25 May 2016HAL is a multi-disciplinary open access
archive for the deposit and dissemination of sci-entific research documents, whether they are pub-lished or not. The documents may come from teaching and research institutions in France or abroad, or from public or private research centers.
L’archive ouverte pluridisciplinaire HAL, est destinée au dépôt et à la diffusion de documents scientifiques de niveau recherche, publiés ou non, émanant des établissements d’enseignement et de recherche français ou étrangers, des laboratoires publics ou privés.
aerosols: Compared chemical compositions of grains and
thin films
Nathalie Carrasco, François Jomard, Jackie Vigneron, Arnaud Etcheberry,
Guy Cernogora
To cite this version:
Nathalie Carrasco, François Jomard, Jackie Vigneron, Arnaud Etcheberry, Guy Cernogora. Labora-tory analogues simulating Titan’s atmospheric aerosols: Compared chemical compositions of grains and thin films. Planetary and Space Science, Elsevier, 2016, 128, pp.52-57. �10.1016/j.pss.2016.05.006�. �hal-01321473�
Laboratory analogues simulating Titan’s atmospheric aerosols:
compared chemical compositions of grains and thin films
Nathalie Carrasco1,2, François Jomard3, Jackie Vigneron4, Arnaud Etcheberry4, Guy Cernogora1
1
LATMOS, Université Versailles St Quentin, UPMC Univ. Paris 06, CNRS, 11 blvd d’Alembert, 78280 Guyancourt, France
2
Institut Universitaire de France, 103 bd Saint-Michel ,75005 Paris, France 3
GEMAC, Université Versailles St Quentin, CNRS, 45 Avenue des Etats Unis, FR78035 Versailles, France
4
ILV, Université Versailles St Quentin, CNRS, 45 Avenue des Etats Unis, FR78035 Versailles, France
Corresponding author: E-mail: [email protected]
Abstract
Two sorts of solid organic samples can be produced in laboratory experiments simulating
Titan’s atmospheric reactivity: grains in the volume and thin films on the reactor walls. We expect that grains are more representative of Titan’s atmospheric aerosols, but films are used to provide optical indices for radiative models of Titan’s atmosphere.
The aim of the present study is to address if these two sorts of analogues are chemically
equivalent or not, when produced in the same N2-CH4 plasma discharge. The chemical
compositions of both these materials are measured by using elemental analysis, XPS analysis
and Secondary Ion Mass Spectrometry. The main parameter probed is the CH4/N2 ratio to
explore various possible chemical regimes. We find that films are homogeneous but
significantly less rich in nitrogen and hydrogen than grains produced in the same experimental
conditions. This surprising difference in their chemical compositions could be explained by
the efficient etching occurring on the films, which stay in the discharge during the whole
plasma duration, whereas the grains are ejected after a few minutes. The higher nitrogen
content in the grains possibly involves a higher optical absorption than the one measured on
Introduction
Titan, the largest satellite of Saturn, is surrounded by a brownish opaque photochemical
smog. This smog is made of solid organic aggregates of a few hundreds of nanometers, rich in
nitrogen, and with a global CxHyNz composition [1-3]. The chemical complexity of this smog
is far from being understood despite the numerous in situ data by the ongoing
Cassini-Huygens mission.[1, 4-6] Several experiments have been developed to infer their chemical
composition by studying laboratory analogues.[7-9] According to the experimental setups, the
analogues (also named tholins in the following) are produced on the wall of the reactor, or in
the volume, producing respectively organic thin films or spherical shaped individual grains of
a few thousands nanometers in diameter.[10, 11]
Little attention has been drawn to the possible effect of such different growth pathways on the
chemical composition of the analogues. Individual grains and thin films are usually
considered as equivalent materials in terms of their chemical signatures, and used
alternatively depending on the involved analysis technique. Ellipsometry for example requires
exclusively thin films to determine the optical indices of the material [12, 13], whereas
high-resolution mass spectrometry analysis has been performed on grains only.[14, 15] However
an infrared spectroscopic comparative study showed some differences between grains and thin
films produced in the same experimental conditions. [16]
The aim of this work is to address this common paradigm by comparing the chemical
composition of both solid materials produced simultaneously in a plasma experiment
simulating the formation of solid organic aerosols in the atmosphere of Titan.[17, 18] The
chemical composition of these tholins grains has been extensively studied in the past by
infrared absorption spectroscopy, mass spectrometry and elemental analysis.[16, 19, 20] The
chemical composition of the tholins thin films has to date only been globally characterized by
infrared absorption spectroscopy[21]. The present work provides the first chemical analysis of
and SIMS (Secondary Ion Mass Spectrometry) analysis. Those two techniques are commonly
used for organic films analysis in general,[22-25] and are well adapted for nitrogen containing
films in particular[26-28]. Moreover two kinds of substrates are used, made of CaF2 and SiO2,
Experimental Section
Sample production
Experiments are carried out with the PAMPRE set-up, based on a Radio-Frequency
Capacitively Coupled Plasma (RF CCP) at 13.56 MHz.[18] RF plasmas are also used in
nitrogen methane mixtures for the production of CNx hard films [29] or hydrogenated
amorphous carbon films (a-C:H) [30]. Their efficiency to produce solid material explains their
interest to simulate the formation of Titan’s aerosols.
The plasma discharge is produced between a polarized cathode and a grounded metallic grid
(anode) surrounding and confining the plasma. The same power discharge of 30 W is injected
in the whole electric circuit for all the experiments. Half of the injected power is effectively
consumed to produce the discharge itself.[31] The gas mixture is continuously injected in the
reactor at 55 sccm and pumped through a rotary valve vacuum pump. The gas flow
composition is adjusted in order to introduce from 0% to 10% of CH4 in N2. source for the
plasma chemistry. Two high purity gas bottles are used, one of pure N2 and one containing a
N2–CH4 mixture with 10% CH4 [20]. Four mixtures conditions are chosen here to scan chemical conditions in agreement with the methane concentration profile in the atmosphere of
Titan [32]: 1, 2, 5 and 10 % of CH4 diluted in N2. Experiments are performed at room
temperature and a 0.9mbar pressure. The gas in the reactor is slightly warmed by the plasma
discharge reaching a stable temperature of 315 and 340 K for methane amounts of 2 and 10%
respectively [17]. The reactor walls are slowly warmed accordingly but no change is observed
in the 2-hrs experiments performed here.
RF CCP discharges are well-known for producing simultaneously thin films on substrates and
solid particles (grains) in the volume of reactive gas mixtures.[33] In our experimental set up,
the thin organic films are produced on the grounded anode, whereas levitating grains are
produced simultaneously in the gas volume without interaction with the walls.[34] To collect
thickness made of respectively CaF2 and SiO2 are symmetrically placed in the reactor to
provide comparable substrates for thin film deposition. These two substrate materials are
chosen to be chemically different but with similar geometry and similar electric properties in
the plasma discharge. A 2 h experiment duration is chosen, to limit the thickness of the films
below 1 µm.[12]
The film synthesis is a reproducible process. In previous studies we chose the same
experimental conditions: silicon substrates, 5% of injected CH4, 55sccm gas flow, 30W of
injected power [12, 21]. Gautier et al (2012) synthesized three films in a 3h-duration
experiment, and Mahjoub et al (2012) synthesized a film in a 2h-duration experiment. The
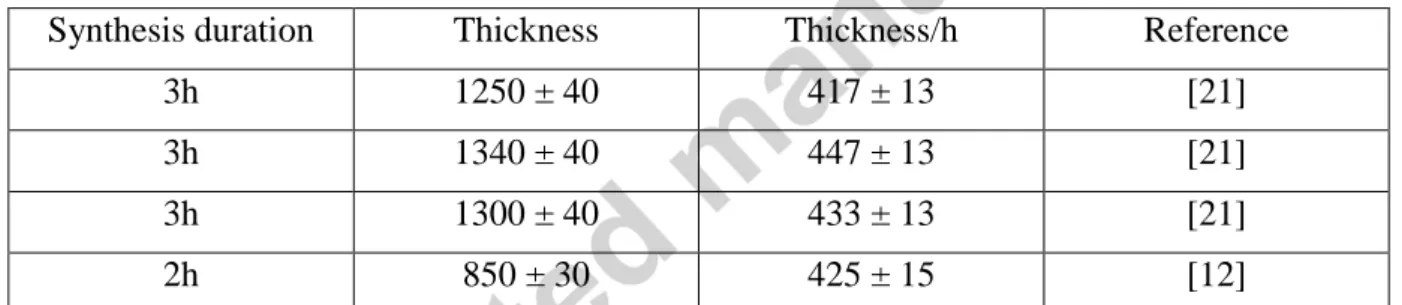
obtained thicknesses are reported in Table 1. The growth rates are in agreement for the four
samples showing that the films grow linearly, at least in the few-hours duration range of the
experiments, and are well reproducible.
Synthesis duration Thickness Thickness/h Reference
3h 1250 ± 40 417 ± 13 [21]
3h 1340 ± 40 447 ± 13 [21]
3h 1300 ± 40 433 ± 13 [21]
2h 850 ± 30 425 ± 15 [12]
Table 1: Films thicknesses obtained in various synthesis, using the same experimental conditions: Silicon substrates, 5% of injected CH4, 55 sccm gas flow, 30 W of injected power. Three substrates were placed in the plasma box for the same experiment in [21]. The uncertainty of the film thickness is given by the non-uniformity calculated by Complete-EASE™ software [12].
The films samples are carefully collected after air exposure of the reactor and stored in
individual boxes. The syntheses are performed in a one single experimental campaign of a
few weeks; just before the analysis of the films in order to limit as much as possible the time
interval between the synthesis and the analysis. Films are analyzed here by X-ray
Photoelectron Spectroscopy (XPS) and Secondary Ion Mass Spectrometry (SIMS). And solid
X-ray Photoelectron Spectroscopy (XPS)
The first step of the analysis is a chemical probe by XPS along the depth of the films. This is
achieved using a Thermo Scientific K-Alpha instrument, with a monochromatic Al-K α
X-Ray source (1486.6 eV) located in the ILV laboratory. Charge compensation is used to
overcome charging effects on the organic films. The X-ray spot is set at a 400 × 400 µm size
on the substrate. The pass energy of the analyzer is used in Constant Analyzer Energy mode,
with a 50.0 eV pass. The energy step size is set at 0.1 eV. Sputter depth profiling is performed
using an Argon ion gun (2 keV energy, 10 µA current), with an etch time of 10 s. An etch
time of 10 s is equivalent to an etching thickness of 15 nm, calibrated using Ta2O5. After each
etching step, XPS measurements are performed. The data treatment is performed using a
Shirley baseline and a 30% Lorentz-Gaussian distribution for the peak fitting. XPS
measurement tracks every component of the organic film but hydrogen.
The elemental composition is therefore given as normalized results, taking into account the
expected elements composing the films and possible contributions of the substrate (Ca and F
for films deposited on CaF2 substrates; and Si and O for SiO2 substrates), but no hydrogen.
Therefore XPS analysis directly provides the C/N ratio of the films, but the hydrogen content,
important for characterizing an organic material can unfortunately not be given by this only
technique.
Secondary Ion Mass Spectrometry (SIMS)
After XPS analysis, the organic solid film is covered with a thin gold film for SIMS analyses.
Those are performed using a Cameca IMS4F ion microscope located in the GEMAC
laboratory. The organic film is bombarded by a 14.5 keV Cs+ ion beam, of 10 µm diameter.
The etch time can reach 3000 s.
The sputtered ions are collected in negative mode, preventing any nitrogen detection. The ions
monitored are therefore H-, 12C-, 16O- as film constituents, but also 30Si- and 19F- as substrate
the film and the substrate. This collection mode is stable and useful for qualitative purpose,
but it does not allow absolute quantitative analysis. In the following it will be used to quantify
the evolution of the C, N and H concentrations in the films in arbitrary units.
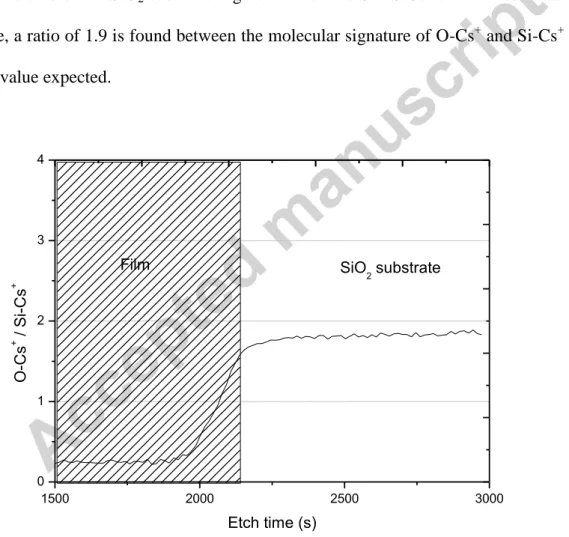
To provide a quantitative information, an additional analysis is performed by SIMS on the
10% thin film sample, monitoring in positive mode the molecular ions M-Cs+ (M is a neutral
atom extracted from the film). The energy of the bombardment is settled at 5.5 keV in this
case. Molecular ions are known to be more representative of the elemental composition of the
sample than the analysis of the direct sputtering ions.[35, 36] This quantification is validated
here on the case of the SiO2 substrate Figure 1: when the SIMS Cesium ion beam reaches the
substrate, a ratio of 1.9 is found between the molecular signature of O-Cs+ and Si-Cs+ instead
of the 2 value expected.
1500 2000 2500 3000 0 1 2 3 4 Film O -C s + / Si -C s + Etch time (s) SiO2 substrate
Figure 1: Intensity ratio of the molecular ions O-Cs+/ Si-Cs+ detected by SIMS on the film sample with a 10% methane gas mixture deposited on a SiO2 substrate. The shadowed area on the left corresponds to the organic film layer, and the clear area on the right to the SiO2 substrate.
Results: XPS and SIMS analysis of the thin films
XPS measurements: homogeneity of the films along thickness-profiles and existence of an
oxidized surface-layer
The homogeneity of the films is probed by XPS profiling after argon ion sputtering on the
first hundreds nanometers. Profiles obtained by SIMS and XPS on a SiO2 substrate, with a
10% CH4 condition are given on Figure 2. The very low amount of Si (< 0.1 %) measured by
XPS confirms the absence of substrate contamination in the film.
0 50 100 150 200 250 300 0 10 20 30 40 50 60 70 80 90 100 C N O Si Elem ent al (C , N , O, Si) rat io (%) Depth (nm)
Figure 2: XPS profile of a thin film with a 10% methane gas mixture on SiO2 substrate. The dashed vertical line presents the limit of the oxidized superficial layer.
The oxygen contribution is quantitatively given by the XPS data: oxygen counts for 1% inside
the films. As the real elemental composition is even lower because of the hydrogen
contribution unseen by XPS, tholin films can be considered as almost oxygen-free. This
confirms the absence of water adsorbed or air traces in the plasma reactor during the
air. Nevertheless, the first external layer, of about 20 nm thickness, is contaminated by a
higher oxygen content. Oxygen reaches up to 10% of the elemental ratio at the surface of the
film (XPS oxygen-profile on Figure 2). This is explained by an instantaneous oxidation
process when collecting the films out of the reactor and exposing them to air: those are easily
oxidized with oxygen as they are plasma polymers, containing reactive radicals after their
synthesis.[37-40]
XPS measurements: N/C depth profiles of the films
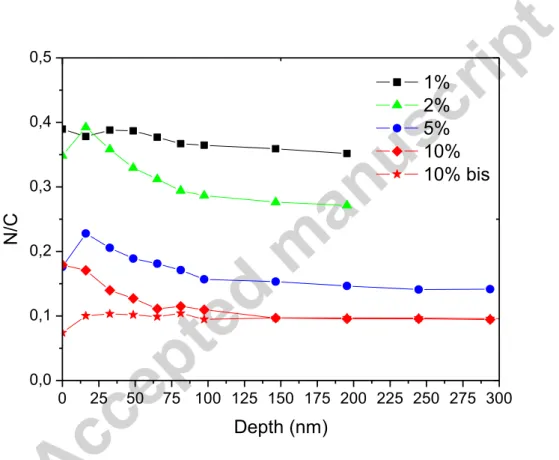
0 25 50 75 100 125 150 175 200 225 250 275 300 0,0 0,1 0,2 0,3 0,4 0,5 N /C 1% 2% 5% 10% 10% bis Depth (nm)
Figure 3: XPS N/C profiles of tholin films obtained on SiO2 substrates. Two 10% profiles are plotted on both SiO2 and CaF2 (10% bis) substrates.
We compare the N/C ratios of the films in Figure 3 obtained by XPS depth profile analysis
according to the initial methane concentration in the plasma. The N/C ratio depends strongly
on the methane concentration in the plasma discharge. It decreases from about 0.4 for
Comparison with previous XPS measurements on similar materials
XPS studies were previously performed on other laboratory analogues of Titan’s haze. [9, 41,
42] The most resembling material was produced in a spark discharge with a gas mixture of
CH4/N2/H2.[41, 42] However the material had a strong oxygen signature, also visible through
specific shifts in the C1s and N1s XPS spectra. Knowing that a thin oxidized layer is
produced on the surface of our films by air exposure, one can suspect a similar contamination
in their case, as only the external surface of the material was analyzed by XPS. When no
specific treatment is made to protect tholins from air contamination, XPS surface analysis
should not be considered as representative of the bulk samples.
SIMS measurements: no influence of the substrate
The homogeneity of the films is complementarily probed by SIMS measurements. SIMS
provides reliable results after about 100 s of Cesium ion bombardment corresponding to the
duration of the SIMS signal stabilization. The first 100 s of film etching cannot be considered
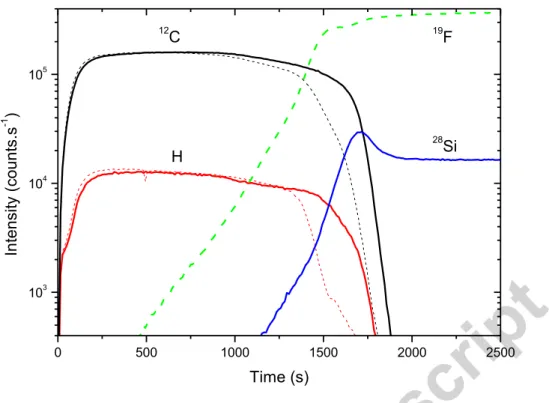
0 500 1000 1500 2000 2500 103 104 105 In te nsi ty (co un ts. s -1 ) Time (s) 12 C H 19 F 28 Si
Figure 4: Comparison of the SIMS profiles obtained in negative mode for thin films produced with a 10% methane gas mixture in similar conditions on respectively a SiO2 (thick plain lines) and a CaF2 substrate (dashed lines). H- and 12C- ion intensities are representative of the film samples, whereas 19F- and 28Si- ions are respectively representative of the SiO2 and CaF2 substrates.
The influence of the substrate on the film growth is illustrated on Figure 4. This SIMS
analysis shows that the samples are homogeneous after a few 100s of SIMS ion bombardment
down to the film-substrate interface. SIMS profiles of samples produced with 10% of methane
in identical conditions are plotted for films deposited on a SiO2 and a CaF2 substrate. The ions
represented are chosen as representative of the organic film (12C and H) and of the substrates
(28Si and 19F). No significant difference is observed in the main part of the film deposit for the
ions representative of the film: the intensities measured for 12C and H are well reproducible
whatever the choice of the substrate. A difference can however be noticed on the film
thickness: films are slightly thicker on SiO2 than on CaF2. The initiation of the deposition
film-substrate interface is not sensitive to this initial discrepancy. For these reasons, films are
further analyzed on SiO2 substrates only.
SIMS measurements: evolution of the films thickness with the initial methane concentration
The thickness of the films is provided in arbitrary units by the position (sputtering duration) of
the sharp decrease observed for carbon ions when Cesium ions encounter the substrate (Figure
34). The decrease occurs at 750s for the 1% film sample, 1000s for the 2% film sample and
1750s for both the 5 and 10% film samples. As all samples have been produced with the same
duration of 2 hours, we can conclude that the film deposition rate increases with the initial
methane amount in the gas mixture, but reaches an asymptotic value for methane conditions
larger than 5%. This evolution is fully consistent with a previous film thickness measurement
on Si substrates determined by ellipsometry.[12]
SIMS measurements: H/C composition of the films
As explained in the experimental section, the intensity ratio IH/IC (Figure 5) of the negative
ion intensities measured by SIMS is an indicator in arbitrary units of the H/C ratio of the
films. We can compare these ratios for the films produced in the different methane amount
conditions. IH/IC profiles are found to be similar at every profile depths and every CH4
concentrations. The H/C ratio is therefore constant in the films, and insensitive to the methane
200 400 600 800 1000 1200 1400 0,1 0,2 0,3 0,4 0,5 10% 5% 2% 1% I H / I C Time (s)
Figure 5: Influence of the CH4 content on the H/C ratio of the films deduced from SIMS measurements in negative mode (results obtained on SiO2). The IH/IC ratio is only plotted for the organic film (not beyond the substrate limit).
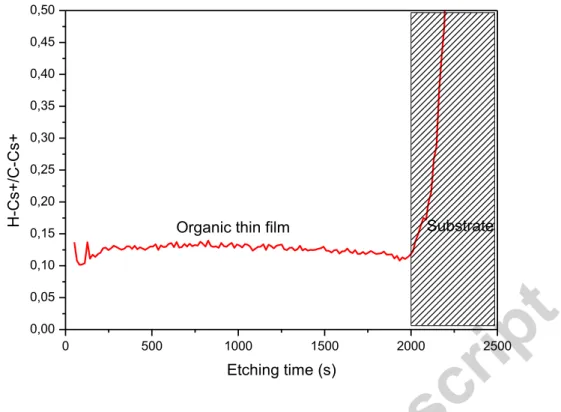
Moreover this ratio obtained in negative mode for all the samples can be roughly calibrated
thanks to the measurement of the positive molecular ions H-Cs+/ C-Cs+ from the 10% film
sample on SiO2 (
Figure 6
). It is found to be equal to about ~0.1. The H/C ratio of the films is0 500 1000 1500 2000 2500 0,00 0,05 0,10 0,15 0,20 0,25 0,30 0,35 0,40 0,45 0,50 Substrate H -C s+/ C -C s+ Etching time (s) Organic thin film
Figure 6 : Intensity ratio of the molecular ions H-Cs+/ C-Cs+ detected by SIMS on the film sample with a 10% methane gas mixture deposited on a SiO2 substrate.
Discussion: comparison with grains in the plasma volume
Production efficiency
The film thickness first increases with the initial methane content, from about 500 nm at CH4
1%, up to about 900 nm at CH4 5%, with a saturation reached above CH4 5% [21]. Such an
increase, for methane concentrations lower than 5%, is consistent with the production
efficiency observed for the grain in similar conditions. As discussed in [20], chemical growth
is related to the available quantity of methane dissociated in the discharge, increasing with the
methane concentration injected in the reactor.
First, one could expect that films are the results of the accumulation of grains. In this case, the
surface roughness of the films should be in the order of magnitude of the grain diameters.
This is not the case: films roughness is about a few tens of nanometers whereas grains
diameter is about several hundreds of nanometers [12]. Films and grains have therefore
different growth modes.
A difference is observed concerning the two solid productions in the plasma at methane
concentrations larger than 5%. The film thickness remains maximal (also observed in [12]),
whereas the grains almost disappear from the plasma volume (production rate ten times lower
at 10% than at 5%) [20]. The limiting factor for the organic growth of the grains at high
methane amount is attributed to atomic hydrogen, whose content in the gas phase increases
with methane [43]. As no decrease is observed for the films thickness at large methane
amounts, this process occurring in the volume is not significant in the case of the films. Other
processes are at stake in the plasma limiting the film thickness on the anode.
Films grow during the whole 2 hours experience-duration in the discharge, but their
thicknesses do not exceed several hundreds of nanometers whatever the methane
concentration [12]. Grains grow in the discharge up to a limited diameter above which they
are ejected from the plasma. Their diameters reach the same order of magnitude as the 2-hrs
important process therefore limits the organic growth of the films on the anode. At the anode,
films are exposed to an efficient bombardment of both electrons and negative ions [12, 17].
This bombardment surely erodes the organic films by etching, as observed after argon ion
bombardment on carbonitride films [44].
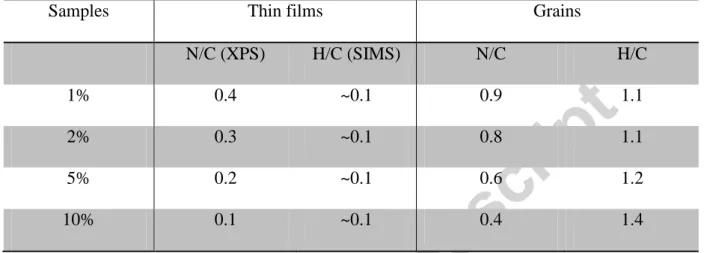
Samples Thin films Grains
N/C (XPS) H/C (SIMS) N/C H/C
1% 0.4 ~0.1 0.9 1.1
2% 0.3 ~0.1 0.8 1.1
5% 0.2 ~0.1 0.6 1.2
10% 0.1 ~0.1 0.4 1.4
Table 2: Elemental analysis of both thin films and grains. Thin films N/C ratios are determined here from XPS data at a 150 nm depth; and thin films H/C ratios are taken from Cs-M+ molecular ions from SIMS analysis. The grains elemental analysis has been made in [20, 45].
Chemical composition.
Elemental analysis of both films and grains is reported in Table 1.
Films are found less rich in nitrogen by a factor of 2 to 3, compared to grains. This lower
nitrogen content explains the lower amine signature compared to the aliphatic one observed in
a previous first study [16] opposing films and grains by mid-infra-red absorption
spectroscopy.
The H/C ratio is constant in the films, which is not the case for the levitating dust particles, as
studied in [20, 45] by elemental analysis. H/C ratio in grains was indeed found to increase
with the initial methane amount: C was found constant by elemental analysis, meaning that
suspected role of H as inhibitor for grains growth [43]). Moreover, the similar ~0.1 H/C ratio
obtained by SIMS for all films is much lower than the H/C observed in the grains. This
highlights a higher unsaturation level in the organic film material, which was not detected by
a previous comparative study in infrared absorption spectroscopy [16]. This study actually
noted a more intense signature of aliphatic CH2/CH3 functions in the films than in the grains
for a same methane amount in the gas phase, concluding on possible higher hydrogen content
in the films. We show here that the hydrogen content is on the contrary globally lower in the
films than in the grains. The aliphatic enhancement noticed in [16] is actually explained by a
relative decrease of the adjacent amine signature in the films compared to the grains.
As discussed above, the films are located on the grounded electrode during the whole duration
of the discharge and are subject to an etching process from the electrons and the negative ions
of the discharge. Our work suggests that the grains are a more pristine organic material, and
the films could be the result of an additional efficient plasma etching.
Electron etching is known to induce dehydrogenation on carbonitride films [46], in agreement
with the low H/C ratios of the films. Moreover a study of argon ion implantation on silicon
carbonitride films also observed a decrease of the nitrogen content of the films after ion
bombardment, in agreement with the low N/C ratios of the films compared to the grains [44].
These two H and N losses from the films during plasma etching suggest a release of
nitrogen-bearing volatiles in the discharge. This possible release is in agreement with the production of
ammonia NH3, detected previously in the discharge and hardly explained by only gas-phase
Conclusion
The chemical composition of thin films deposited on the grounded anode, in a N2-CH4
RF-plasma discharge is studied by complementary XPS and SIMS analysis. The main RF-plasma
parameter studied here is the initial methane amount in the reactive plasma. Films are found
to be homogeneous along their depth profile, except an external oxidized layer no thicker than
20 nm and due to the samples air exposure. These films are compared to another solid phase
produced simultaneously as spherical grains of about a few hundreds nm diameter in
suspension in the plasma volume. Significant differences are found between these two
materials: films are more cross-linked and less rich in nitrogen than the grains.
These differences could be explained by additional etching processes on the films through
electron, and negative ion bombardment.
In a previous study we measured the optical indices of the films according to the methane
concentration in the discharge. The imaginary optical index k, characterizing the absorption
properties of the sample, was found to increase drastically with the nitrogen content in the
films (by an order of magnitude between films produced at 10 and 2% of methane
respectively) [12]. As our analysis reveals that grains are much richer in nitrogen than films
for similar methane conditions, we expect that grains are more absorbent than films produced
in similar experimental conditions. Hence due to the absence of wall effect during their
synthesis, grains are often considered as more representative of Titan’s atmospheric aerosols.
It would therefore be important to complementarily measure the optical indices of the grains
in order to improve the predictions of Titan’s radiative models.
Acknowledgements:
NC acknowledges the financial support of the European Research Council (ERC Starting Grant PRIMCHEM, grant agreement n°636829).References
1. Israel, G., et al., Complex organic matter in Titan's atmospheric aerosols from in situ pyrolysis and analysis. Nature, 2005. 438(7069): p. 796-799.
2. Tomasko, M.G., et al., Rain, winds and haze during the Huygens probe's descent to Titan's surface. Nature, 2005. 438(7069): p. 765-778.
3. Tomasko, M.G., et al., A model of Titan's aerosols based on measurements made inside the atmosphere. Planetary and Space Science, 2008. 56(5): p. 669-707. 4. Lavvas, P., et al., Aerosol growth in Titan’s ionosphere. Proceedings of the National
Academy of Sciences, 2013.
5. Vinatier, S., et al., Optical constants of Titan’s stratospheric aerosols in the 70–1500 cm−1 spectral range constrained by Cassini/CIRS observations. Icarus, 2012. 219(1): p. 5-12.
6. Waite Jr., J.H., et al., The Process of Tholin Formation in Titan’s Upper Atmosphere. Science, 2007. 316: p. 870-875.
7. Cable, M.L., et al., Titan Tholins: Simulating Titan Organic Chemistry in the Cassini-Huygens Era. Chem. Rev. , 2012. 112(3): p. 1882-1909.
8. Coll, P., et al., Can laboratory tholins mimic the chemistry producing Titan's aerosols? A review in light of ACP experimental results. Planetary and Space Science, 2013. 77: p. 91–103.
9. Tran, B.N., J.P. Ferris, and J.J. Chera, The photochemical formation of a titan haze analog. Structural analysis by x-ray photoelectron and infrared spectroscopy. Icarus, 2003. 162(1): p. 114-124.
10. Coll, P., et al., Experimental laboratory simulation of Titan’s atmosphere: Aerosols and gas phase. Planet. Space Sci., 1999. 47: p. 1331-1340.
11. Hadamcik, E., et al., Light scattering measurements on Titan's aerosols analogues produced by a dusty plasma. Planet. Space Sci., 2009. 57: p. 1631–1641.
12. Mahjoub, A., et al., Influence of methane concentration on the optical indices of Titan’s aerosols analogues. Icarus, 2012. 221(2): p. 670-677.
13. Sciamma-O’Brien, E., et al., Optical constants from 370 nm to 900 nm of Titan tholins produced in a low pressure RF plasma discharge. Icarus, 2012. 218(1): p. 356-363. 14. Pernot, P., et al., Tholinomics: Chemical Analysis of Nitrogen-Rich Polymers.
Analytical Chemistry, 2010. 82(4): p. 1371-1380.
15. Somogyi, Á., et al., Chemical ionization in the atmosphere? A model study on
negatively charged “exotic” ions generated from Titan's tholins by ultrahigh resolution MS and MS/MS. International Journal of Mass Spectrometry, 2012. 316–318(0): p. 157-163.
16. Quirico, E., et al., New experimental constraints on the composition and structure of tholins. Icarus, 2008. 198(1): p. 218-231.
17. Alcouffe, G., et al., Capacitively coupled plasma used to simulate Titan's atmospheric chemistry. Plasma Sources Science and Technology 2010. 19(1): p. 015008.
18. Szopa, C., et al., PAMPRE: A dusty plasma experiment for Titan’s tholins production and study. Planet. Space Sci., 2006. 54: p. 394-404.
19. Carrasco, N., et al., Chemical Characterization of Titan's Tholins: Solubility,
Morphology and Molecular Structure Revisited. . The Journal of Physical Chemistry A, 2009. 113(42): p. 11195-11203.
20. Sciamma-O'Brien, E., et al., Titan's atmosphere: An optimal gas mixture for aerosol production? Icarus, 2010. 209(2): p. 704-714.
21. Gautier, T., et al., Mid- and far-infrared absorption spectroscopy of Titan's aerosols analogues. Icarus, 2012. 221(1): p. 320-327.
22. Johnston, E.E. and B.D. Ratner, Surface characterization of plasma deposited organic thin films. Journal of Electron Spectroscopy and Related Phenomena, 1996. 81(3): p. 303-317.
23. Retzko, I., et al., Chemical analysis of plasma-polymerized films: The application of X-ray photoelectron spectroscopy (XPS), X-ray absorption spectroscopy (NEXAFS) and fourier transform infrared spectroscopy (FTIR). Journal of Electron Spectroscopy and Related Phenomena, 2001. 121(1): p. 111-129.
24. Sabbatini, L. and P.G. Zambonin, XPS and SIMS surface chemical analysis of some important classes of polymeric biomaterials. Journal of Electron Spectroscopy and Related Phenomena, 1996. 81(3): p. 285-301.
25. Shi, F.F., Recent advances in polymer thin films prepared by plasma polymerization Synthesis, structural characterization, properties and applications. Surface and Coatings Technology, 1996. 82(82): p. 1-15.
26. Hanuš, J., G. Ceccone, and F. Rossi, Amino-rich Plasma Polymer Films Prepared by RF Magnetron Sputtering. Plasma Processes and Polymers, 2012. 9(4): p. 371-379. 27. Maurau, R., et al., Nitrogen Introduction in pp-HMDSO Thin Films Deposited by
Atmospheric Pressure Dielectric Barrier Discharge: An XPS Study. Plasma Processes and Polymers, 2012. 9(3): p. 316-323.
28. Vogelsang, A., et al., Deposition of Thin Films from Amino Group Containing Precursors with an Atmospheric Pressure Microplasma Jet. Plasma Processes and Polymers, 2011. 8(1): p. 77-84.
29. Hao, J., W. Liu, and Q. Xue, Effect of N2/CH4 flow ratio on microstructure and composition of hydrogenated carbon nitride films prepared by a dual DC-RF plasma system. Journal of Non-Crystalline Solids, 2007. 353(2): p. 136-142.
30. Géraud-Grenier, I., V. Massereau-Guilbaud, and A. Plain, Characterization of particulates and coatings created in a 13.56 MHz radiofrequency methane plasma. Surface and Coatings Technology, 2004. 187(2–3): p. 336-342.
31. Alves, L.L., et al., Capacitively coupled radio-frequency discharges in nitrogen at low pressure. Plasma Sources Science and Technology, 2012. 21(4): p. 045008.
32. Waite Jr, J.H., et al., Ion Neutral Mass Spectrometer Results from the First Flyby of Titan. Science, 2005. 308: p. 982-986.
33. Bouchoule, A., ed. Dusty Plasmas : Physics, Chemistry and Technological Impacts in plasma Processing. ed. Wiley. 1999: New York.
34. Berndt, J., et al., Some Aspects of Reactive Complex Plasmas. Contributions to Plasma Physics, 2009. 49(3): p. 107-133.
35. Gao, Y., A new secondary ion mass spectrometry technique for III‐V semiconductor compounds using the molecular ions CsM+. J. Appl. Phys., 1988. 64: p. 3760-3762. 36. Gao, Y., et al., On the SIMS depth profiling analysis: reduction of matrix effect.
International Journal of Mass Spectrometry and Ion Processes, 1995. 143: p. 11-18. 37. Gengenbach, T.R., R.C. Chatelier, and H.J. Griesser, Characterization of the Ageing
of Plasma-deposited Polymer Films: Global Analysis of X-ray Photoelectron Spectroscopy Data. Surface and Interface Analysis, 1996. 24(4): p. 271-281. 38. Swaraj, S., et al., Aging of Plasma-Deposited Films Prepared from Organic
Monomers. Plasma Processes and Polymers, 2007. 4(S1): p. S784-S789.
39. Unger, W.E.S., et al., Ageing Studies of Plasma Deposited Organic Films by Surface Chemical Analysis (ESCA, ToF-SIMS, XAS). Materials Science Forum, 2007. 539 - 543: p. 623-628.
40. Gengenbach, T.R. and H.J. Griesser, Aging of 1,3-diaminopropane plasma-deposited polymer films: Mechanisms and reaction pathways. Journal of Polymer Science Part A: Polymer Chemistry, 1999. 37(13): p. 2191-2206.
41. Ruiz-Bermejo, M., et al., CH4/N2/H2-spark hydrophobic tholins: A systematic approach to the characterisation of tholins. Part II. Icarus, 2009. 204(2): p. 672-680. 42. Ruiz-Bermejo, M., et al., CH4/N2/H2 spark hydrophilic tholins: A systematic
approach to the characterization of tholins. Icarus, 2008. 198(1): p. 232-241. 43. Carrasco, N., et al., Volatile products controlling Titan’s tholins production. Icarus,
2012. 219(1): p. 230-240.
44. Batocki, R.G.S., et al., Effect of argon ion bombardment on amorphous silicon carbonitride films. Journal of Physics: Conference Series, 2014. 480(1): p. 012021. 45. Fleury, B., et al., Influence of CO on Titan atmospheric reactivity. Icarus, 2014. 238:
p. 221-229.
46. Wnuk, J.D., J.M. Gorham, and D.H. Fairbrother, Growth and Microstructure of Nanoscale Amorphous Carbon Nitride Films Deposited by Electron Beam Irradiation of 1,2-Diaminopropane. The Journal of Physical Chemistry C, 2009. 113(28): p. 12345-12354.
47. Thissen, R., et al., Laboratory Studies of Molecular Growth in the Titan
Ionosphere The Journal of Physical Chemistry A, 2009. 113(42): p. 11211-11220.
Highlights
Chemical profiles of tholin films are provided by XPS and SIMS analysis.
Films are homogeneous and O-free except a thin 20nm external oxydized layer.
Grains and films are produced simultaneously but their residence time is different.
Films remain in the discharge and undergo continuous etching processes.