HAL Id: hal-01726706
https://hal.univ-lorraine.fr/hal-01726706
Submitted on 8 Mar 2018
HAL is a multi-disciplinary open access
archive for the deposit and dissemination of sci-entific research documents, whether they are pub-lished or not. The documents may come from teaching and research institutions in France or abroad, or from public or private research centers.
L’archive ouverte pluridisciplinaire HAL, est destinée au dépôt et à la diffusion de documents scientifiques de niveau recherche, publiés ou non, émanant des établissements d’enseignement et de recherche français ou étrangers, des laboratoires publics ou privés.
variations and modelling of multixenobiotic defence
(MXD) transport activity in transplanted zebra mussels
Sandrine Pain, Simon Devin, Marc Parant
To cite this version:
Sandrine Pain, Simon Devin, Marc Parant. Biomarker versus environmental factors:
sea-sonal variations and modelling of multixenobiotic defence (MXD) transport activity in trans-planted zebra mussels. Science of the Total Environment, Elsevier, 2007, 373 (1), pp.103-112. �10.1016/j.scitotenv.2006.10.054�. �hal-01726706�
Biomarker versus environmental factors: seasonal variations and modelling of multixenobiotic defence (MXD) transport activity in transplanted zebra mussels.
Pain Sandrine†*, Devin Simon‡ and Parant Marc†
Université Paul Verlaine (Metz) – Rue du Général Delestraint – 57 070 METZ – France
† Laboratoire Ecotoxicité et Santé Environnementale – CNRS UMR 7146.
‡ Laboratoire Biodiversité et Fonctionnement des Ecosystèmes.
*
PAIN Sandrine (Corresponding Author - [email protected]):
Present address : Université de Reims – URVVC UPRES EA 2069 – Laboratoire Eco-Toxicologie – BP 1039 – 51 687 REIMS cedex 2 – France.
Tel: 33-3-26913328 Fax: 33-3-26913347
ABSTRACT
The occurrence of biomarker temporal variations linked to environmental factors makes it difficult to distinguish the specific effect of pollution. The present work aims to investigate the seasonal variations of the transport activity of the multixenobiotic defence (MXD), that is used as a biological tool for the monitoring of pollution in aquatic ecosystems. The MXD transport activity was monitored monthly from August 2001 to October 2002 in zebra mussels (Dreissena polymorpha) transplanted to three sites in the Moselle River. The ‘efflux method’ was used to evaluate functional activity of MXD by inhibition between rhodamine B and verapamil. Water physicochemical characteristics were provided by a French regulatory agency (Water Agency) that monitors river water quality. The results of a principal
components analysis describe the seasonal cycle of water characteristics and demonstrate that MXD activity is subjected to significant temporal variations. These data were described with a generalised linear model that enables to link MXD variability to the seasonal variations of environmental parameters such as temperature or levels of organic contamination. This work proposes a modelling approach and highlights that the occurrence of seasonal variations in MXD response has to be taken into account in the interpretation of in situ monitoring studies.
KEYWORDS
Multixenobiotic defence, Biomarker, Dreissena polymorpha, Seasonal variations, Environmental parameters, Generalised linear model.
INTRODUCTION
In the field of ecotoxicology, biomarkers are widely used to evaluate the health of the aquatic environment. Biomarkers provide biological responses that are useful tools informing about pollutant exposure and their possible toxic effects in living organisms (National
Research Council, 1987; Lagadic et al., 1997). Although biomarkers aim to evidence pollutant related responses, recent studies have pointed out the need to integrate other factors in the interpretation of results (Vidal et al., 2002; Bodin et al., 2004; Gillis et al., 2004; Petrovic et al., 2004). Abiotic factors (water temperature, conductivity, organic matter level, etc.) and biotic factors (age, reproduction stage, parasitism, etc.) vary throughout the year on the basis of seasonal cycles. As these variations may greatly influence biological responses,
ecotoxicological researches are directed towards the evaluation of temporal fluctuations of biomarkers by field monitoring of their responses in native and/or in transplanted organisms over at least a one year period.
The general objective of the present work was to evaluate the seasonal variations of a biomarker, the activity of the multixenobiotic defence mechanism, in caged zebra mussels (Dreissena polymoprha) over a 15 months field study.
Because they are abundant in aquatic ecosystems, easy to collect and to handle (particularly for caging) and also representative of their environment (sessile), bivalve molluscs are particularly suitable for the field investigation of seasonal variations. In freshwater ecosystems, zebra mussels have received most attention for years as a sentinel species for ecotoxicological studies (de Lafontaine et al., 2000; Smolders et al., 2004; Bervoets et al., 2005; Giamberini and Cajaraville, 2005).
The multixenobiotic defence mechanism (MXD) has been proposed to constitute a relevant biomarker of exposure to pollution (Parant and Pain, 2001; Pain and Parant, 2003). Briefly, MXD acts as a first line defence system against xenobiotics by preventing cellular accumulation and enhancing cellular efflux of potentially harmful molecules that can be found in aquatic environments (Kurelec, 1992; Epel, 1998). It has been associated with the expression of a membrane glycoprotein called P-glycoprotein (Pgp) that mediates ATP-dependent efflux of a wide variety of structurally and functionally diverse compounds (Endicott and Ling, 1989; Gottesman and Pastan, 1993).
The Pgp-mediated efflux phenotype has been identified in many aquatic organisms (for a review see Bard, 2000) and especially in sentinel species as bivalve molluscs (Minier et al., 1993; Smital and Kurelec, 1997; Parant and Pain, 2001). In bivalves Pgps are mainly
expressed in tissues directly exposed to environmental pollution or in tissues involved in the detoxification of pollutants (gills, mantle, digestive gland; Kurelec and Pivcevic, 1989; Minier and Galgani, 1995). MXD has been shown to confer effective protection against deleterious effects caused by the exposure to toxic compounds in adults as well as in embryonic or larval stages (Waldman et al., 1995; McFazden et al., 2000). Finally, this defence system has also been shown to be induced in bivalves collected from polluted areas (Minier et al., 1993; Kurelec et al., 1996) and following field or laboratory exposures (Eufemia and Epel, 2000; Smital et al., 2003; Achard et al., 2004; Legeay et al., 2005). Our previous works also showed that MXD was induced in zebra mussels exposed to environmental stress when compared to control organisms (Pain and Parant, 2003).
Usually, the induction of a biological response following exposure to pollution is assessed by comparison to a control response in non-exposed organisms. This control is considered as a “normal response”, that is to say, as the physiological level of the studied function. However it must be determined whether this physiological level is constant or whether it can change, and in the latter case, it must be determined what are the factors involved in its variations. Environmental factors that can modulates parameters linked to reproduction or food supply for example are likely to influence the biology of bivalve molluscs and then to make biological response to pollutants variable (Sheehan and Power, 1999). The temporal variations of the biological defences against pollution may both affect the level of organism protection and make it difficult to distinguish between effects of pollutants and effects of other environmental factors. As a consequence, it is of primary importance to determine the normal range of variations of biomarker activities in order to propose usable and useful diagnostic tools (Bodin et al., 2004; Lau et al., 2004; Leinio and Lehtonen, 2005).
Seasonal changes of MXD response has been evidenced in marine bivalves and these variations were linked to environmental factors such as temperature (Minier et al., 2000; Keppler and Ringwood, 2001a, 2001b). Because this evaluation is crucial for a relevant use of MXD as a biomarker, we investigated its variability in a freshwater ecosystem. For this purpose, the MXD activity was monitored monthly from August 2001 to October 2002 in zebra mussels transplanted to three sites in the Moselle River. Finally, a model linking environmental parameters to MXD levels was established.
MATERIALS and METHODS
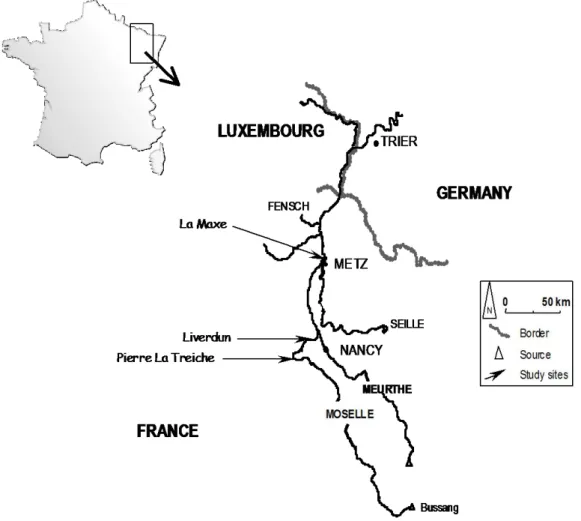
1- Site description
The present study was carried out in the Moselle River, a tributary of the Rhine River that flows in the north-east of France. Three sites were chosen, covering approximately 100 km of the lower Moselle. A map of the river and sampling sites is presented in figure 1. La Maxe (LMX) is the site where the zebra mussels were sampled. It is located in the downstream part of the river, few kilometres downstream the town Metz, whereas Pierre La Treiche (PLT) and Liverdun (LIV) are located in the upstream part of the river.
2- Zebra mussels collection and transplantation
Zebra mussels (Dreissena polymorpha; 20 2 mm in shell length) were collected in July 2001 in the Moselle River (La Maxe, figure 1). Organisms were carried to the laboratory in the water of origin. They were kept under laboratory conditions for 8 days prior to experiment, i.e. dechlorinated water (16-17°C) with continuous oxygen changed daily. Mussels were fed daily with commercial frozen food (Nauplium). Random groups of 60 ‘depurated mussels’ were then placed in cages made of polyethylene netting with a mesh size of 4 x 4 mm,
allowing free circulation of water. The dimensions of the cages were 20 x 9 x 2 cm. Forty-five cages containing 60 mussels each were then deployed in situ. They were transplanted in the Moselle river (15 cages per site), to PLT and LIV, and also to LMX, which was the site where the mussels were collected from. The cages were secured to the bank with a long piece of wire attached to trees present on the river bank and were allowed to float at 20 cm above the river bottom (rocky bottom; total depth of the water column at the transplanting area of about 80 cm).
Monthly monitoring of MXD activity in zebra mussels
The measurements were conducted each month from August 2001 to October 2002 (except for LIV in October 2002). One cage of mussels was collected each month at each site and carried to the laboratory in the water of origin. The MXD activity in the mussels was assessed the following day.
The efflux method was used to evaluate functional activity of MXD, that is, to assess Pgp related efflux by comparing total efflux in control organisms to that of organisms that were given the inhibitor (verapamil) (Kurelec et al., 2000; Parant and Pain, 2001). This efflux assay consists first in exposing mussels to the fluorescent dye that they accumulate in their
gills cells and second, in measuring the efflux rate of the dye with or without the inhibitor. Briefly, mussels were exposed to dechlorinated water containing 5 µM of the fluorescent dye rhodamine B in a light-protected beaker for 4 hours. After the loading period, mussels were washed three-times in dechlorinated water for 2 minutes. Mussels were then exposed either to 30 mL of dechlorinated water or to 30 mL of dechlorinated water containing 30 µM of
verapamil, the MXD inhibitor. Every 5 minutes during 50 minutes, 100 µL of efflux medium were transferred in duplicate to a 96-well microplate and the fluorescence of effluxed RB was immediately measured on a Fluostar (BMG Lab Technologies). This allowed to assess the MXD related efflux rates of rhodamine B. Finally, the activity of MXD was evaluated by the difference between the efflux rates obtained in the absence and in the presence of verapamil. Each efflux measurement was conducted in triplicates.
3- Environmental parameters
Water physicochemical parameters were monthly collected by a French regulatory agency for the monitoring of river quality (Agence de l’Eau Rhin-Meuse) and were retrieved through their database (available at http://www.eau-rhin-meuse.fr/sierm/, 2006), except for water temperatures that were recorded directly during zebra mussels collection. Data on 15 parameters were finally available during the biological monitoring: oxygen saturation, chemical and biological oxygen demand, dissolved organic carbon, total nitrogen, nitrites, nitrates, ammonium, phosphorus, phosphates, suspended matter, conductivity, pH,
chlorophyll a levels and temperature.
4- Statistical analyses
The analysed data are mean values calculated from the MXD activities obtained for 3 groups of 5 mussels, except for PLT in October 2002 where only two groups were used. Because the MXD responses measured each month in the three studied sites did not meet the assumptions for ANOVA (Kolmogorov-Smirnov test for normality and Levene test for variance homogeneity), the non-parametric Kruskal-Wallis ANOVA (KW) was used for comparative purposes. Pairwise comparisons were carried out with the Mann-Whitney (MW) non parametric test for two-samples. For all statistical analysis, the probability level
determining significance was p < 0.05.
A standardised principal component analysis was performed in order to describe the seasonal variations of river physicochemical characteristics and then to investigate how these
variations could reflect and explain the variations of MXD responses in zebra mussels transplanted in the Moselle. In this aim, the PCA was first conducted using the
physicochemical data (15 parameters) collected for the Moselle river during the fifteen months of the study (44 observations). Second, the MXD activity was added a posteriori as a supplementary variable on the correlation circle. In this way, the variable “MXD activity” did not take part in the construction of the PCA axis and this enabled to highlight the relation between this variable that we wanted to explain and the whole physicochemical explanatory variables (Philippeau, 1986). The PCA showed that the first three axis explain 67.77% of the total variance. The factorial plane F1xF3 (44.96% of the total variance) was preferred to F1xF2 (48.28% of the total variance) because the variable of interest “MXD”, added a
posteriori, was best represented.
A non parametric Spearman correlation was computed to investigate linear relationship between MXD response and water temperature.
A generalised linear model (GLM) (McCullagh and Nelder, 1989) was applied to analyse the dependence of MXD response on 15 variables that reflect the seasonal change of
environmental conditions (see table 1 for details). Data from the three sites were pooled in order to consider a wider range of physicochemical variations. For the modelling of MXD activity, the error was assumed normal and the log link function was used. A forward stepwise procedure was adopted to build the model. At each step of the modelling process, variables can be both added or removed from the model. The significance of each variable is tested at each step to determine whether it should be entered, removed, kept in or kept out of the model. This method allowed to conserve only useful variables, and not to consider redundant or useless ones. At the end of the procedure, several parameters were controlled: the significance of variable coefficients according to the Wald’ test, the contribution of each variable to the model with the loglikelihood-ratio test for cumulative effects and the overall goodness of fit according to the deviance (the parameter that measures the discrepancy between modelled and observed values in GLM). It allowed to identify variables whose elimination will not result in a significant increase in deviance, and only significant factors will be kept in the final model. The distributions of the model residuals were analysed to test the model validity.
Data were analysed using STATISTICA software (Statsoft, 1999) except for the Principal Components Analysis that was performed using ADE-4 software (Thioulouse et al., 1997).
RESULTS
1- Seasonal variability in MXD in transplanted zebra mussels
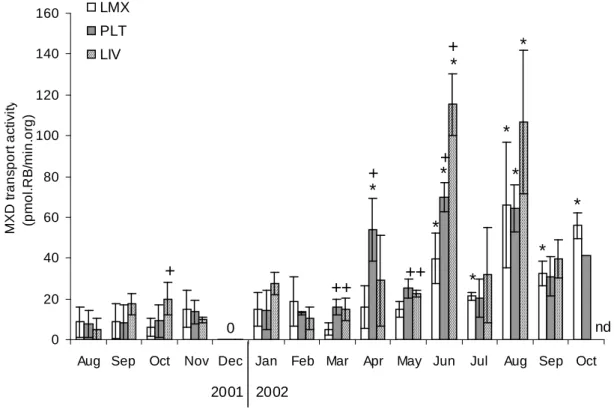
Significant differences in MXD activity measured in zebra mussels transplanted in LMX, in PLT and in LIV were observed throughout the experiment (figure 2; KW, p<0.05).
In LMX, the MXD activity levels were low and homogeneous (KW, p>0.05) from August 2001 to May 2002. From June 2002 until the end of the experiment, MXD response was increased and more heterogeneous (KW, p<0.05). August 2002 showed the highest level (66 pmol.RB/min/org).
In PLT, the MXD activity levels were low and homogeneous (KW, p>0.05) from August 2001 to January 2002. The months when MXD was significantly induced are April, June and August 2002 (MW, p<0.05). From March to June 2002, levels reached at PLT were higher than those obtained at LMX (MW, p<0.05). June 2002 showed the highest level (70 pmol.RB/min/org).
In LIV, the months when MXD was significantly induced are June and August 2002 (MW, p<0.05). In October 2001, March, May and June 2002, the level was higher than that obtained at LMX (MW, p<0.05). In January and June 2002, the level was higher than that obtained at PLT (MW, p<0.05). June 2002 showed the highest level (115 pmol.RB/min/org). In LIV, responses are more heterogeneous throughout the year than at the two other sites.
Note that we could not detect any MXD transport activity in December. For this measure, the dye efflux in dechlorinated water was the same as that in inhibitor solution, as if
verapamil was not able to inhibit the dye efflux.
2- Seasonal variability in environmental parameters
Available physicochemical data provided by the French Water Agency for each sampling date and each site are presented in table 1. PLT and LIV, which are located in the upstream part of the Moselle River showed quite similar characteristics. LMX, located in the
downstream part, generally showed higher levels for quite all the studied parameters, which denotes a water of lesser good quality with respect to the two other sites. However, the major difference between the upstream part and the downstream part of the Moselle river concerns water conductivity which was on average 3 to 3.5-fold higher in the downstream part than in the upstream part.
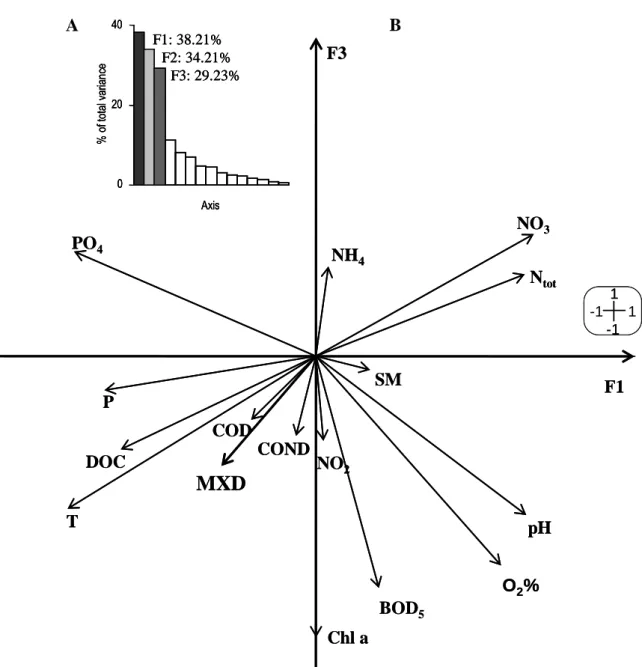
The principal component analysis enabled to describe seasonal variations of
physicochemical characteristics of the river water. The correlation circle presented in figure 3 shows that the F1 axis is positively correlated with nitrogenous matter and negatively with phosphorous matter and dissolved organic carbon. The F3 axis is negatively correlated with the water concentrations of chlorophyll a and biological oxygen demand. In figure 4, the results of PCA are shown by the position of monthly physicochemical data on the factorial plane F1xF3. These results highlight the seasonal cycle of the physicochemical characteristics of the studied river, from the summer 2001 to the autumn 2002. Autumn and winter periods are characterised by increased levels of nitrogenous matter and on the opposite, spring and summer periods are characterised by increased temperature, pH, oxygen saturation, biological oxygen demand, concentrations of chlorophyll a, dissolved organic carbon and phosphorous matter. It can be noted that the two autumn periods and also the two summer periods (2001, 2002) are clearly distinguished in the factorial plane, indicating a marked difference in physicochemical profile between these two years.
3- Relationship between response of MXD and environmental parameters
The projection a posteriori of MXD activity on the correlation circle of the PCA (figure 3) showed that it was positively correlated to temperature and concentrations of chlorophyll a, and to a lesser extent to chemical oxygen demand and conductivity that were not sufficiently represented on the circle. In addition, MXD activity was correlated negatively to levels of nitrogenous matter. Levels of MXD activity were higher during summer periods than during winter periods. As other studies have highlighted the significant correlation between MXD response and water temperatures in marine ecosystems, we investigated this correlation in our freshwater ecosystem. The MXD response in zebra mussels transplanted in the Moselle River was indeed highly correlated with the temperature of the water (rSpearman=0.493, n=132,
p=1.8.10-9). As water temperature is probably not the only parameter involved in MXD variations, all the environmental parameters were considered to build a generalised linear model. On the 15 physicochemical variables originally considered, only ten were finally retained, which influenced the MXD activity (Table 2). Modelled values fitted with observed ones (scaled deviance = 132, df = 121, p = 0.23), and residuals are normally distributed (deviance residuals, ² = 6.1, df = 8, p = 0.63). Five variables seemed to have no influence on the biomarker activity: water conductivity, chemical oxygen demand, total nitrogen concentration and parameters related to phosphorus (phosphate and total phosphorus concentrations). The loglikelihood ratio test enabled to distinguish the variables that represent
a great weight in the model. The variables with greater weight in the model are temperature, biological oxygen demand, nitrites concentrations, and chlorophyll a levels (Table 3).
DISCUSSION
MXD seasonal variations have already been studied in marine bivalves (Minier et al., 2000, Keppler and Ringwood, 2001a, 2001b; Bodin et al., 2004). However, to our knowledge, this aspect has not been investigated in freshwater bivalves. Whereas the previously cited works were based on Pgp expression levels, we monitored the functional activity of the multixenobiotic defence in transplanted zebra mussels throughout a fifteen months study.
The monitoring of MXD activity in transplanted zebra mussels showed the occurrence of significant seasonal changes throughout the year. Though there were differences between the three studied sites, the global tendency was for the measured levels of MXD activity to be higher and significantly induced in the second part of our study, in spring and summer 2002. In 2002, MXD induction occurred during the warmest months as it was previously shown in marine bivalves by measuring the enhancement of Pgp expression (Minier et al., 2000; Keppler and Ringwood, 2001a, 2001 b). Indeed MXD induction in zebra mussels was significantly correlated with the water temperature in our study as well as in the previously cited works. Some authors even showed induction of MXD activity in marine bivalves exposed in laboratory to heat shock, suggesting a possible direct role of temperature in MXD induction (Eufemia and Epel, 2000). However, no induction was observed in transplanted zebra mussels during the warmest month in 2001 (August), which presented a similar value for water temperature. As this unexpected result was obtained for the first month of the experiment, difficulties linked to acclimation of mussels to caging conditions can not be excluded. However, a second hypothesis can be proposed. Regarding the position of the warmest months (August 2001 and June, July, August 2002) in the factorial plane F1xF3 of the PCA, it can be seen that they were clearly distinguished in the plane, indicating that they presented different physicochemical characteristics. This result suggests that the difference in MXD response between the warmest months of the two years may be explained by marked difference of physicochemical characteristics of the studied ecosystem (chlorophyll a levels, oxygen saturation…see table 1). Indeed, although the generalised linear model allowed to confirm that water temperature positively influences MXD activity, it also revealed that MXD is influenced by other environmental parameters that have to be taken into account in field
survey protocol. As a consequence, even if the water temperature is a predominant factor whose variations seem to reflect those of MXD response, other parameters are involved.
Among the 15 physicochemical parameters that were taken into account in our analysis, 10 were found to be significantly involved in the description of MXD temporal variations (biological oxygen demand, temperature, nitrites, suspended matter, chlorophyll a, pH, dissolved organic carbon, ammonium, nitrates oxygen saturation; tables 2 and 3). The model gives the relative contribution of each parameter to the global phenomenon. So it appears difficult to isolate the role of each environmental parameter. However, the contribution of biological oxygen demand and dissolved organic carbon is quite easy to consider. Both parameters describe level of organic matter in water. As a wide variety of organic molecules (natural toxins, algal metabolites, microbial degradation products, synthetic musk fragrances, environmental contaminants; see Smital et al., 2004 for a review) were shown to interact with MXD, it seems logical that the variations of MXD response could be explained in part by factors that describes organic matter levels. Moreover, biological oxygen demand corresponds to the fraction of organic matter that can be biologically degraded. This biodegradable part of organic matter may be preferentially transported by MXD, then explaining the preponderant place of BOD5 in the description of MXD temporal variations.
Some authors had shown that algal metabolites could induce MXD defence (Eufemia et al., 2002). As a consequence, it has been hypothesised that the phytoplankton production could sometimes explain the high levels of MXD response in warm seasons (Minier et al., 2000). One can be surprised of the negative correlation, although it is very low, of chlorophyll a levels in the description of MXD variability in our study. However, even if the correlation coefficient is lowly negative, the weight of this parameter in the model is high, confirming its real contribution in the variability of MXD. The contribution of other factors (pH, oxygen saturation…) appears also difficult to explain. A direct involvement of these parameters in MXD variability is probably not to consider, supporting the idea that one isolated parameter can not explain all the complexity of seasonal variation of a biological response. However it is important to consider environmental factors on the whole and to model their interaction with the biota in order to better understand biological responses in realistic exposure conditions.
A number of environmental and physiological factors may influence biomarker responses that may fluctuate throughout the year (Sheehan and Power, 1999). Usually, biomarker responses are higher during summer period than in winter period (increased temperature, primary production, metabolism, stress, decreased oxygenation). The modification of these
parameters contributes to increasing environmental stress for living organisms, and results in activation of biomarkers of stress. The occurrence of such variations renders more complex the interpretation of biomarker response during in situ monitoring studies. As MXD activity has been proposed as a suitable biomarker of organic contamination in aquatic ecosystems, it seems essential to take into account the occurrence of the variability in the interpretation of results. In this aim, it would be of interest to determine whether the seasonal variations are similar from one year to the next. Moreover it will be interesting to compare the present investigation with monitoring studies of mussels transplanted in contaminated areas in order to determine how the addition of the “contamination” parameter could modify our model.
ACKNOWLEDGEMENTS
This research was supported by a fellowship from the French Ministry of Research and Technology. The authors are grateful to Jean-Nicolas BEISEL (Laboratory of
Biodiversity and Ecosystem Functioning – University Paul Verlaine of Metz) for his valuable help with statistical analysis.
REFERENCES
Achard M, Baudrimont M, Boudou A, Bourdineaud JP. Induction of a multixenobiotic resistance protein (MXR) in the Asiatic clam Corbicula fluminea after heavy metals exposure. Aquat. Toxicol. 2004; 67: 347-357.
Bard SM. Multixenobiotic resistance as a cellular defense mechanism in aquatic organisms. Aquat. Toxicol. 2000; 48: 357-389.
Bervoets L, Voets J, Covaci A, Chu S, Qadah D, Smolders R, Schepens P, Blust R. Use of transplanted zebra mussels (Dreissena polymorpha) to assess the bioavailability of
microcontaminants in Flemish surface waters. Environ. Sci. Technol. 2005; 39: 1492-1505. Bodin N, Burgeot T, Stanisière JY, Bocquené G, Menard D, Minier C, Boutet I, Amat A,
Cherel Y, Budzinski H. Seasonal variations of a battery of biomarkers and physiological indices for the mussel Mytilus galloprovincialis transplanted into the northwest
Mediterranean Sea. Comp. Biochem. Physiol. C 2004; 138: 411-427.
de Lafontaine Y, Gagne F, Blaise C, Costan G, Gagnon P, Chan HM. Biomarkers in zebra mussels (Dreissena polymorpha) for the assessment and monitoring of water quality of the St Lawrence River (Canada). Aquat. Toxicol. 2000; 50: 51-71.
Endicott JA, Ling V. The Biochemistry of P-glycoprotein-mediated multidrug resistance. Annu. Rev. Biochem. 1989; 58: 137-171.
Epel D. Use of multidrug transporters as a first line defense against toxins in aquatic organisms. Comp. Biochem. Physiol. A 1998; 120: 23-28.
Eufemia NA, Epel D. Induction of the multixenobiotic defense mechanism (MXR) P-glycoprotein in the mussel Mytilus californianus as a general cellular response to environmental stress. Aquat. Toxicol. 2000; 49: 89-100.
Eufemia NA, Clerte S, Girshick S, Epel D. Algal products as naturally occurring substrates for P-glycoprotein in Mytilus californianus, Mar. Biol. 2002; 140: 343-353.
Giambérini L, Cajaraville MP. Lysosomal responses in the digestive gland of the freshwater mussel, Dreissena polymorpha, experimentally exposed to cadmium. Environ. Res. 2005; 98: 210-214.
Gillis PL, Reynoldson TB, Dixon DG. Natural variation in a metallothionein-like protein in Tubifex tubifex in the absence of metal exposure. Ecotox. Environ. Saf. 2004; 58: 22-28. Gottesman MM, Pastan I. Biochemistry of multidrug resistance mediated by the multidrug
transporter. Annu. Rev. Biochem. 1993; 62: 385-427.
Keppler CJ, Ringwood AH. Expression of P-glycoprotein in southeastern oysters Crassostrea virginica, Mar. Environ. Res. 2001a; 52: 81-96.
Keppler CJ, Ringwood AH. Expression of P-glycoprotein in the gills of oysters Crassostrea virginica: seasonal and pollutant related effects. Aquat. Toxicol. 2001b; 54: 195-204. Kurelec B. The multixenobiotic resistance mechanism in aquatic organisms. Crit. Rev.
Toxicol. 1992; 22: 23-43.
Kurelec B, Pivcevic B. Distinct glutathione-dependant enzyme activities and a verapamil-sensitive binding of xenobiotics in a fresh-water mussel Anodonta cygnea. Biochem. Biophys. Res. Com. 1989; 164: 934-940.
Kurelec B, Krca C, Lucic D. Expression of multixenobiotic resistance mechanism in a marine mussel Mytilus galloprovincialis as a biomarker of exposure to polluted environments. Comp. Biochem. Physiol. C 1996; 113: 283-289.
Kurelec B, Smital T, Pivcevic B, Eufemia N, Epel D. Multixenobiotic resistance P-glycoprotein and chemosensitizers. Ecotoxicology 2000; 9: 307-327.
Lagadic L, Caquet T, Amiard JC. Biomarqueurs en écotoxicologie: principes et définitions. In: Lagadic L, Caquet T, Amiard JC, Ramade F, editors. Biomarqueurs en écotoxicologie, Aspects fondamentaux. Masson, Paris, 1997, pp. 1-9.
Lau PS, Wong HL, Garrigues Ph. Seasonal variations in antioxidative responses and acetylcholinesterase activity in Perna viridis in eastern oceanic and western estuarine waters of Hong Kong. Cont. Shelf Res. 2004; 24: 1969-1987.
Leiniö S, Lehtonen KK. Seasonal variability in biomarkers in the bivalve Mytilus edulis and Macoma balthica from the northern Baltic Sea. Comp. Biochem. Physiol. C 2005; 140: 408-421.
Legeay A, Achard-Joris M, Baudrimont M, Massabuau JC, Bourdineaud JP. Impact of Cadmium contamination and oxygenation levels on biochemical responses in the Asiatic clam Corbicula fluminea. Aquat. Toxicol. 2005; 74: 242-253.
McCullagh P, Nelder JA. Generalized Linear Models. Monographs on Statistics & Applied Probability,37. Chapmann and Hall/CRC, London, 1989, 532 pp.
McFadzen I, Eufemia NA, Heath C, Epel D, Moore MN, Lowe DM. Multidrug resistance in the embryos and larvae of the mussel Mytilus edulis. Mar. Environ. Res. 2000; 50: 319-323.
Minier C, Galgani F. Multi-xenobiotic resistance in Mytilus edulis. Mar. Environ. Res. 1995; 39: 267-270.
Minier C, Akcha F, Galgani F. P-glycoprotein expression in Crassostrea gigas and Mytilus edulis in polluted seawater. Comp. Biochem. Physiol. B 1993; 106: 1029-1036.
Minier C, Borghi V, Moore MN, Porte C. Seasonnal variation of MXR and stress proteins in the common mussel Mytilus galloprovincialis. Aquat. Toxicol. 2000; 50: 167-176.
National Research Council. Biological markers in environmental health research. Environ. Health Persp. 1987; 74: 3-9.
Pain S, Parant M. Response of MultiXenobiotic Defence Mechanism (MXDM) in Dreissena polymorpha exposed to environmental stress. Chemosphere 2003; 52: 1105-1113.
Parant M, Pain S. Potential use of multixenobiotic defense mechanism (MXDM) in Dreissena polymorpha as a biomarker for the monitoring of freshwater pollution. Wat. Res. 2001; 35: 3743-3748.
Petrovic S, Semencic L, Ozretic B, Ozretic M. Seasonal variations of physiological and cellular biomarkers and their use in the biomonitoring of north adriatic coastal waters (Croatia). Mar. Poll. Bull. 2004; 49: 713-720.
Philippeau G. Comment interpréter les résultats d'une analyse en composantes principales ? Instituts Techniques des Céréales et des Fourrages, Paris, France, 1986, 63 pp.
Sheehan D, Power A. Effects of seasonality on xenobiotic and antioxidant defence mechanisms of bivalve molluscs. Comp. Biochem. Physiol. C 1999; 123: 193-199.
Smital T, Kurelec B. Inhibitors of the multixenobiotic resistance mechanism in natural waters: In vivo demonstration of their effects. Environ. Toxicol. Chem. 1997; 16: 2164-2170. Smital T, Sauerborn R, Hackenberger BK. Inducibility of the P-glycoprotein transport activity
in the marine mussel Mytilus galloprovincialis and the freshwater mussel Dreissena polymorpha. Aquat. Toxicol. 2003; 65: 443-465.
Smital T, Luckenbach T, Sauerborn R, Hamdoun AM, Vega RL, Epel D. Emerging
contaminants - pesticides PPCPs microbial degradation products and natural substances as inhibitors of multixenobiotic defense in aquatic organisms. Mutat. Res. 2004; 552: 101-107.
Smolders R, Bervoets L, De Coen W, Blust R. Cellular energy allocation in zebra mussels exposed along a pollution gradient: linking cellular effects to higher levels of biological information. Environ. Poll. 2004; 129: 99-112.
Thioulouse J, Chessel D, Dolédec S, Olivier JM. ADE-4: a multivariate analysis and graphical display software, Stat. Comp. 1997; 7: 75-83.
Vidal ML, Bassères A, Narbonne JF. Seasonal variations of pollution biomarkers in two populations of Corbicula fluminea (Muller). Comp. Biochem. Physiol. C 2002; 131: 133-151.
Waldmann P, Pivcevic B, Müller WEG, Zahn RK, Kurelec B. Increased genotoxicity of acetylaminofluorene by modulators of multixenobiotic resistance mechanism: studies with the freshwater clam Corbicula fluminea. Mutat. Res. 1995; 342: 113-123.
Table 1: Physicochemical data obtained from the French Water Agency for the monitoring
of river water (http://www.eau-rhin-meuse.fr/sierm/) for each month and site, except for water temperature which was recorded during mussels sampling (O2%: oxygen saturation,
COD and BOD5: chemical and biological oxygen demand, DOC: dissolved organic carbon,
Ntot: total nitrogen, NO2: nitrites, NO3: nitrates, NH4: ammonium, P: phosphorus, PO4:
phosphates, SM: suspended matter, Cond: conductivity, pH, Chla: chlorophyll a levels and T: temperature).
O2% BOD5 COD DOC Ntot NH4 NO2 NO3 P PO4 SM T COND pH Chl a
SITES DATES % mgO2.L-1 mgO2.L-1 mgC.L
-1 mg.L-1 mgNH4.L-1 mgNO2.L-1 mgNO3.L-1 mg.L -1 mgPO4.L-1 mg.L -1 °C µS.cm-1 µg.L-1 LMx Aug 01 74 2.0 16 3.6 1.5 0.20 0.08 5.6 0.19 0.43 15 23 1130 7.4 4.9 Sep 01 76 2.0 19 3.4 2.0 0.50 0.23 6.4 0.22 0.21 16 16 1490 7.7 3.0 Oct 01 88 2.0 20 2.0 2.7 0.02 0.12 9.6 0.15 0.06 10 16 1360 7.7 2.7 Nov 01 95 3.0 20 3.1 3.0 0.30 0.27 9.3 0.15 0.06 19 7 1350 7.8 1.7 Dec 01 93 2.0 12 2.9 6.0 0.49 0.25 11.9 0.14 0.09 7 3 1450 7.8 1.1 Jan 02 93 3.0 18 2.8 3.0 0.41 0.11 9.9 0.06 0.09 22 4 1550 7.9 2.2 Feb 02 95 3.5 18 2.6 2.5 0.24 0.11 8.5 0.13 0.03 54 8 1205 7.9 3.2 Mar 02 98 3.0 20 3.4 3.5 0.22 0.15 12.0 0.19 0.08 78 11 843 7.9 4.1 Apr 02 115 3.3 18 2.3 2.3 0.32 0.15 7.1 0.10 0.03 14 12 1213 8.1 43.9 May 02 122 3.0 23 3.6 2.5 0.07 0.22 8.5 0.12 0.06 17 18 1510 8.1 52.4 Jun 02 102 4.0 27 4.3 1.5 0.10 0.40 4.0 0.17 0.09 16 26 1635 7.8 28.7 Jul 02 103 3.0 21 3.6 1.0 0.06 0.11 1.1 0.21 0.07 19 23 1485 7.7 30.2 Aug 02 68 3.0 19 2.8 1.5 0.26 0.10 5.5 0.21 0.33 10 25 1225 7.4 3.2 Sep 02 91 3.0 29 2.5 2.5 0.13 0.15 6.1 0.26 0.18 15 20 1450 7.8 24.9 Oct 02 88 3.0 22 4.6 2.1 0.20 0.12 6.4 0.17 0.16 12 15 1467 7.7 2.7 PLT Aug 01 68 2.0 15 3.4 1.0 0.13 0.07 3.3 0.14 0.28 14 23 390 7.3 8.1 Sep 01 79 2.0 28 3.0 1.0 0.19 0.03 2.5 0.19 0.18 14 14 500 7.5 6.5 Oct 01 83 2.0 12 2.6 2.0 0.08 0.03 6.0 0.10 0.09 3 15 292 7.5 1.6 Nov 01 99 2.0 9 2.7 2.0 0.09 0.03 4.7 0.12 0.15 8 5 371 7.8 0.7 Dec 01 94 2.0 18 2.4 2.0 0.07 0.05 8.4 0.10 0.03 10 1 262 7.6 1.1 Jan 02 93 3.0 11 1.5 3.0 0.18 0.04 8.9 0.09 0.15 12 2 543 8.0 1.1 Feb 02 101 3.0 10 2.2 2.0 0.05 0.03 7.3 0.10 0.06 8 6 309 7.9 1.1 Mar 02 94 3.0 6 1.3 2.0 0.02 0.03 8.0 0.09 0.06 4 10 345 8.1 3.8 Apr 02 108 3.0 9 1.4 2.0 0.04 0.03 4.9 0.05 0.03 8 10 399 8.6 22.7 May 02 93 3.0 12 3.2 2.0 0.05 0.05 4.9 0.09 0.06 5 16 285 7.9 10.8 Jun 02 86 3.0 13 3.1 2.0 0.13 0.07 4.9 0.22 0.12 12 25 405 7.7 14.0 Jul 02 131 3.0 15 3.1 1.0 0.04 0.03 1.7 0.13 0.06 9 22 515 8.1 27.0 Aug 02 81 3.0 12 3.3 1.0 0.13 0.04 1.5 0.18 0.15 10 25 475 7.9 28.1 Sep 02 97 3.0 20 3.4 1.0 0.07 0.04 3.0 0.02 0.01 5 19 450 8.0 24.3 Oct 02 106 3.0 7 4.3 1.7 0.07 0.03 5.0 0.13 0.09 16 13 197 7.1 1.1 LIV Aug 01 79 2.0 16 3.2 1.0 0.15 0.07 4.3 0.15 0.23 7 22 405 7.6 2.2 Sep 01 87 2.0 12 2.9 1.0 0.12 0.04 3.9 0.16 0.11 11 14 354 7.5 1.9 Oct 01 86 2.0 9 2.3 2.5 0.07 0.08 7.2 0.11 0.13 4 14 389 7.5 0.6 Nov 01 91 2.0 13 2.7 2.0 0.05 0.05 8.0 0.09 0.11 9 6 475 7.8 1.1 Dec 01 90 2.0 38 2.3 2.0 0.21 0.07 8.7 0.10 0.09 2 2 420 7.8 2.2 Jan 02 93 3.0 15 2.8 3.0 0.15 0.07 10.8 0.12 0.09 11 3 576 8.0 1.4 Feb 02 94 3.0 11 1.9 2.0 0.08 0.04 7.7 0.08 0.05 8 7 409 7.8 0.8 Mar 02 100 3.0 21 3.1 3.0 0.24 0.09 12.1 0.22 0.12 105 9 325 7.9 7.3 Apr 02 118 3.0 13 2.2 3.0 0.04 0.04 8.2 0.08 0.03 13 11 389 8.3 29.2 May 02 110 3.0 13 3.0 2.0 0.07 0.08 5.8 0.13 0.09 9 16 456 7.9 18.4 Jun 02 103 3.0 14 3.7 1.5 0.13 0.04 2.8 0.14 0.09 9 25 436 7.9 11.4 Jul 02 96 3.0 15 3.1 1.0 0.07 0.03 1.7 0.14 0.08 10 22 427 8.0 26.5 Aug 02 84 3.0 15 3.3 1.0 0.10 0.05 2.8 0.13 0.22 7 25 436 7.8 11.0 Sep 02 89 3.0 13 3.9 2.0 0.06 0.04 3.8 0.18 0.20 5 19 479 7.8 4.4
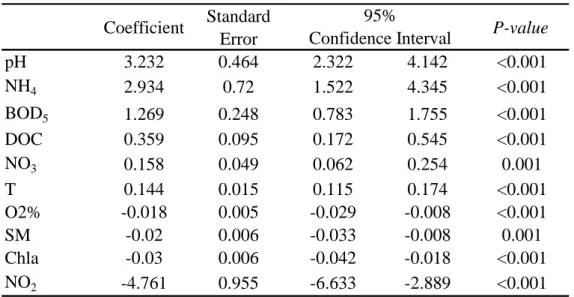
Table 2: Generalised linear model results. P-values refer to the significance of coefficient
according to the Wald’ test.
Table 3: Results of the loglikelihood ratio test for cumulative effects. Variables were added
sequentially in the generalised linear model, and the resulting increase in loglikelihood was tested with a chi-square test. Variables are presented in decreasing order of importance in the model. Coefficient Standard Error P-value pH 3.232 0.464 2.322 4.142 <0.001 NH4 2.934 0.72 1.522 4.345 <0.001 BOD5 1.269 0.248 0.783 1.755 <0.001 DOC 0.359 0.095 0.172 0.545 <0.001 NO3 0.158 0.049 0.062 0.254 0.001 T 0.144 0.015 0.115 0.174 <0.001 O2% -0.018 0.005 -0.029 -0.008 <0.001 SM -0.02 0.006 -0.033 -0.008 0.001 Chla -0.03 0.006 -0.042 -0.018 <0.001 NO2 -4.761 0.955 -6.633 -2.889 <0.001 95% Confidence Interval ² P-value T 52.337 <0.0001 BOD5 32.846 <0.0001 NO2 28.964 <0.0001 Chla 20.984 <0.0001 NO3 16.139 0.0001 SM 11.04 0.0009 NH4 6.725 0.0095 pH 6.035 0.014 DOC 5.097 0.024 O2% 0.029 0.8648
0 20 40 60 80 100 120 140 160
Aug Sep Oct Nov Dec Jan Feb Mar Apr May Jun Jul Aug Sep Oct
MXD t ra n sp o rt a ct ivi ty (p mo l. R B/ mi n .o rg ) LMX PLT LIV * * * * * * * * * * + ++ ++ + + + 0 nd 2001 2002
Figure 2: MXD transport activity (pmol.RB/min/org) in zebra mussels transplanted in LMX,
PLT and LIV between August 2001 and October 2002. Data are mean ± SD of results obtained from 3 groups of 5 mussels at each month between August 2001 and September 2002. In August 2002, the MXD activity was not determined for LIV (nd) and the bar
presented for PLT corresponds to the mean of 2 groups (29.6; 53.3 pmol.RB/min/org) instead of 3; that is why no SD appears in the graph. In December 2001, the MXD levels were null at all sites (0). * indicates months for which MXD level was significantly induced (Mann Withney , p<0.05) with respect to the other months for a given site. + indicates months for which MXD level was significantly induced with respect to the level measured in LMX which is the site where zebra mussels were sampled (Mann Withney , p<0.05).
Figure 3: Eigenvalues (A) and correlation circle (B) of the principal component analysis
performed using the physicochemical characteristics (15 parameters, 44 observations). The MXD activity was added a posteriori on the correlation circle.
O2% BOD5 COD DOC Ntot NH4 NO2 NO3 P PO4 SM T COND pH Chl a
MXD
0 20 40 Axis % o f t ot al v ari an ce F1: 38.21% F2: 34.21% F3: 29.23% F3 F1 -1 1 -1 1 -1 1 O2% BOD5 COD DOC Ntot NH4 NO2 NO3 P PO4 SM T COND pH Chl aMXD
0 20 40 Axis % o f t ot al v ari an ce F1: 38.21% F2: 34.21% F3: 29.23% 0 20 40 Axis % o f t ot al v ari an ce F1: 38.21% F2: 34.21% F3: 29.23% F3 F1 -1 1 -1 1 -1 1 -1 1 -1 1 -1 1 B AAutumn 2001 Aug 01 Sep 01 Oct 01 Summer 2001 Nov 01 Dec 01 Jan 02 Feb 02 Mar 02 Winter 2002 Apr 02 May 02 Jun 02 Spring 2002 Jul 02 Aug 02 Sep 02 Summer 2002 Oct 02 Autumn 2002 F1 F3 -4.4 2.5 -4 3.3
Figure 4: Factorial plane F1xF3 of the principal component analysis showing the position of
the physicochemical data recorded for each studied month. Sampling dates were grouped by drawing arbitrary ellipses representing each studied season.