Accepted Manuscript
Coupling experimental and field-based approaches to decipher carbon sources in the shell of the great scallop, Pecten maximus (L.)
V. Marchais, J. Richard, A. Jolivet, J. Flye-Sainte-Marie, J. Thébault, F. Jean, P. Richard, Y.-M. Paulet, J. Clavier, L. Chauvaud
PII: S0016-7037(15)00443-3
DOI: http://dx.doi.org/10.1016/j.gca.2015.07.010
Reference: GCA 9364
To appear in: Geochimica et Cosmochimica Acta
Received Date: 24 July 2014
Accepted Date: 8 July 2015
Please cite this article as: Marchais, V., Richard, J., Jolivet, A., Flye-Sainte-Marie, J., Thébault, J., Jean, F., Richard, P., Paulet, Y.-M., Clavier, J., Chauvaud, L., Coupling experimental and field-based approaches to decipher carbon sources in the shell of the great scallop, Pecten maximus (L.), Geochimica et Cosmochimica Acta (2015), doi: http:// dx.doi.org/10.1016/j.gca.2015.07.010
This is a PDF file of an unedited manuscript that has been accepted for publication. As a service to our customers we are providing this early version of the manuscript. The manuscript will undergo copyediting, typesetting, and review of the resulting proof before it is published in its final form. Please note that during the production process errors may be discovered which could affect the content, and all legal disclaimers that apply to the journal pertain.
1
Coupling experimental and field-based approaches to decipher carbon sources in
the shell of the great scallop, Pecten maximus (L.)
Marchais V. a, *, Richard J. a, *, Jolivet A. a, Flye-Sainte-Marie J. a, Thébault J. a, Jean F. a, Richard P.
b
, Paulet Y.-M. a, Clavier J. a, Chauvaud L. a
a
UMR 6539, LEMAR, Université de Bretagne Occidentale, Institut Universitaire Européen de la Mer, Technopôle Brest-Iroise, rue Dumont d’Urville, 29280 Plouzané, France
b
UMR 7266, LIENSs, Université de la Rochelle, 2 rue Olympe de Gouges, 17000 La Rochelle, France
*
Both authors equally contributed to this manuscript
Corresponding author: Violette Marchais
Email: vmarchais@gmail.com
Abstract
This research investigated how the carbon isotopic composition of food source (13Cfood) and
dissolved inorganic carbon (13CDIC) influences the carbon isotopic composition of Pecten maximus
shells (13Cshell) under both experimental and natural conditions. The objectives are to better
understand the relationship between P. maximus and its environment, and to specifically distinguish conditions under which calcification is influenced by respired CO2 derived from food sources versus
conditions in which calcification uses inorganic carbon from seawater. Laboratory experiment investigated carbon incorporation into shell carbonates by maintaining scallops under conditions where the stable carbon isotopic composition of food sources was considerably depleted (-54‰), relative to values observed in the natural environment (-21‰). Laboratory experiment ran for 78 days under three temperature conditions, 15°C, 21°C and 25°C. A survey of the environmental parameters and stable carbon isotopic composition into shell carbonate of natural population of P. maximus was also realized during the same year in the Bay of Brest, France. Data collected from both laboratory experiment and the natural environment confirmed that both 13CDIC and 13
Cfoodinfluence 13Cshell values and that organic carbon incorporation (CM) averages about 10%
(4.3 to 6.8% under experimental conditions and 1.9 to 16.6% in the natural environment). The shift in stable carbon isotopic composition from the uptake of depleted food sources under experimental conditions realized a marked divergence in the predicted equilibrium between calcium carbonate and
2
ambient bicarbonate, relative to the natural environment. This offset was 1.7 ± 0.6‰ for scallops in their natural environment and 2.5 ± 0.5 and 3.2 ± 0.9‰ for scallops under experimental conditions at water temperatures of 15 and 21°C, respectively. The offset of 3‰ for scallops subjected to laboratory experiment could not be explained in light of growth rate but may be related to food supply and/or temperature. Food source and temperature effects may also explain the annual variation observed in CM values measured from scallops in their natural environment. CM estimation
from the natural population of P. maximus varied seasonally from around 2% at the end of winter, to 12% in summer. The seasonal variation resembles variability in the carbon isotopic composition of the food sources throughout the year with an exception at the end of winter.
Keywords: stable carbon isotopes, metabolic carbon, DIC, respired carbon, Pecten maximus, experiment
3
1. Introduction
Mollusk shell is a composite biomineral comprised of 95 to 99 weight % calcium carbonate. Shell cross sections exhibit two or three super-imposed calcium carbonate layers, made of either aragonite or calcite (Marin and Luquet, 2004). Mollusks precipitate carbonate from ambient seawater such that the structure composition, carbon and oxygen stable isotopic ratios, and other features of successive shell bands record environmental conditions (Davenport, 1938; Stanton and Dodd, 1970; Krantz et al., 1987; Schöne et al., 2003). Based on evidence of the influence of water temperatures and isotopic composition (18Ow related to salinity) on oxygen isotopic composition of biogenic
carbonate (18Oshell) (Urey, 1947; Epstein et al., 1953; Craig, 1965; Emiliani, 1966; Shackleton,
1967; O'Neil et al., 1969), 18Oshell values have been used to estimate past temperature and salinity
parameters (Grossman and Ku, 1986; Ingram et al., 1996; Chauvaud et al., 2005; Schöne et al., 2005; Wanamaker et al., 2007). Carbon isotopic ratios of the shell (13Cshell) are derived from the stable
carbon isotope ratio of dissolved inorganic carbon (13CDIC) in seawater (Mook and Vogel, 1968;
Mook, 1971; Killingley and Berger, 1979; Arthur et al., 1983), metabolic carbon (Klein et al., 1996; Geist et al., 2005; McConnaughey and Gillikin, 2008) or some combination of the two (Tanaka et al., 1986; McConnaughey et al., 1997; Dettman et al., 1999; Furla et al., 2000; Vander Putten et al., 2000; Lorrain et al., 2004; Gillikin et al., 2006; Chauvaud et al., 2011). Physiological parameters (e.g., growth rates, metabolism, ontogeny, food source variations) can complicate 13Cshell data
interpretation due to their influence on biomineralization (Shackleton et al., 1973; Erez, 1978; Swart, 1983; Gonzalez and Lohmann, 1985; McConnaughey, 1989a, b; Owen et al., 2002a, b).
Values for marine mollusk 13Cshell are primarily controlled by three factors: 13CDIC, 13C of
respired carbon (13CR) and proportion of metabolic carbon (CM) incorporated into shell material
(McConnaughey, 1989a; McConnaughey et al., 1997; McConnaughey and Gillikin, 2008; Beirne et al., 2012). McConnaughey et al. (1997) calculated a theoretical metabolic carbon contribution of 10% for aquatic mollusks based on the “respiratory gas exchange model”. However, recent experimental and empirical studies have documented several deviations from this model indicating that CM appears to be species-specific (e.g., Lorrain et al., 2004; Gillikin et al., 2006; Gillikin et al.,
2007), even in the marine environment, and that CM shows species-specific variation over the
lifetime of an individual (Klein et al., 1996; Lorrain et al., 2004; Gillikin et al., 2009; Butler et al., 2011; Chauvaud et al., 2011).
Poulain et al. (2010) and Beirne et al. (2012) used the Manila clam (Venerupis philippinarum) and ocean quahog (Arctica islandica), respectively, to provide rigorous, species-specific
4
experimental calibration of 13Cshell with 13CDIC for mollusk shell carbonate. Both research teams
found a metabolic carbon contribution of ~10% (CM = 12% for Manila clam and 10% for ocean
quahog) and concluded that ambient DIC exerts primary control on 13Cshell. The investigation by
Chauvaud et al. (2011) examining ontogenetic and seasonal variations in Pecten maximus shells, found that 13Cshell values did not reliably track 13CDIC variation, but might represent a promising
tool for ecophysiological studies.
The present study focuses on the carbon isotopic composition of the Pecten maximus shell. This species is a ubiquitous marine mollusk that range from Spain to Norway and resides in water depths of 0 to 500 m. The biology of the scallop is well understood in terms of growth rate, reproduction and energy allocation (Paulet et al., 1988; Chauvaud et al., 1998; Saout et al., 1999; Lorrain et al., 2002). P. maximus has a high growth rate (up to 400 µm.day-1 along the shell’s dorso-ventral axis) and produces daily growth bands from spring to fall (Chauvaud et al., 1998; Chauvaud et al., 2005). This daily pattern of striae allows the carbonate deposits along the shell’s growth axis to be precisely dated (Chauvaud et al., 1998; Chauvaud et al., 2005; Chauvaud et al., 2012). It also enables precise calibration of geochemical tracers during the growth period (see Schöne et al., 2002), to a degree not typically possible with other species (e.g. Wanamaker et al., 2007; Beirne et al., 2012).
As outlined by McConnaughey and Gillikin (2008), the use of 13Cshell as an environmental
proxy requires a better understanding of processes influencing calcification and whether it dominated by respired CO2 derived from food or inorganic carbon from ambient seawater. We addressed these
questions by measuring the carbon isotopic composition of shell carbonate from controlled laboratory experiment, in which scallops were fed phytoplankton with a depleted carbon isotopic composition (13Calgae depleted in 13C relative to values in natural environment). Three temperature
conditions were applied corresponding to temperatures recorded in the field: (1) at the beginning of the experiment (15°C), (2) maximum temperature encountered throughout the natural range for P. maximus (21°C) and (3) an extreme physiologically stressfully temperature (25°C). The experiment lasted 78 days, allowing enough time for 13Calgae, 13CDIC, 13Ctissues and 13Cshell to reach a new
steady-state. The main goals of the experimental trial were to control factors, such as temperature and food source, that covary in the natural environment, and to determine their influence on carbon incorporation into shell carbonate. To better understand P. maximus’ carbon dynamics, experimental conditions varied the stable carbon isotope composition of the organism’s food sources over a wide range (ranging from -21‰ under natural conditions to -54‰ under experimental conditions) and maintained stable temperatures under three temperature conditions. Under experimental conditions, the stable carbon isotopic composition was measured from shell carbonate. A survey of the
5
environmental parameters and stable carbon isotopic composition into shell carbonate of P. maximus was also realized during the same year at the Lanvéoc locality, Bay of Brest, France (Fig. 1). Scallop
13
Cshell was specifically monitored in detail over one year of growth to establish estimates of
seasonal variation in metabolic carbon incorporation. These results were then analyzed in light of the experimental results.
2. Material and methods
2.1. Biological material
Pecten maximus used for the experimental study came from a single cohort spawned at the Tinduff bivalve hatchery (Bay of Brest, France, Fig. 1) in spring 2010. The juveniles were then raised in small cages at Sainte-Anne du Portzic (Bay of Brest, Fig. 1) from June 2010 to the end of May, 2011. On May 31st, 2011, 1320 P. maximus individuals (1 year old; average length = 34.0 ± 4.1 mm, 1) were transferred to Argenton Shellfish Laboratory of the French Research Institute for Exploitation of the Sea (IFREMER, Brittany, France, Fig. 1) where experiment was conducted. By convention, the age class is the number of first Januaries experienced by an individual, easily controlled by the number of winter marks on the shell’s outer surface. The scallops evaluated in this study were class I.
2.2. Experimental conditions
Scallops were divided randomly into three batches of 440 individuals each, and placed in plastic mesh cages inside three 250 L tanks subjected to different temperature conditions: 15°C (T15), 21°C (T21) and 25°C (T25). Water within the tanks was homogenized with aquarium pumps. Each tank was supplied with 80 L.h-1 of seawater filtered at 1 µm. Tanks were completely emptied and cleaned once a week.
Throughout the experiment, water flowing into the tanks was continuously supplemented with a 50/50 (volume) mixture of two cultured microalgae (50% Isochrysis affinis galbana -Tahitian strain T-iso - and 50% Chaetoceros gracilis) depleted in 13C. These microalgae with low carbon isotope ratios (13Calgae) were produced by bubbling CO2 from a commercial cylinder of petrochemical origin
6
into culture medium (see Paulet et al., 2006 for more details). The quantity of microalgae added to each tank was adjusted twice a day to maintain a concentration of 3×10⁴ cells.mL-1 within the tanks (1.5×106 µm3.mL-1), so that food was never a limiting factor, independently of temperature and number of individuals in tanks (Utting and Millican, 1998; Fig. 2A). Algal concentrations were checked twice a day using a Coulter counter. The experiment lasted for 78 days (ending on August 16th, 2011), and maintained a photoperiod (12h/12h), salinity, pH and O2 concentration at constant
levels. Salinity, pH and O2 concentration were measured once a week using WTW probes (WTW
Multi 3430 Multiparameter Meter equipped with TetraCon 925 salinity probe, SenTix pH probe and FDO 925 oxygen optode). Their average values (± S.D.) were 35.8 ± 0.2 (PSU), 8.1 ± 0.1 and 94 ± 7%, respectively.
During the initial 21 days, all scallops were maintained at 15.1 ± 0.2°C, a temperature approximating that of the natural environment. This allowed acclimation to controlled conditions as well as identification and removal of damaged individuals prior to experimentation. On June 22nd, 2011, temperature was increased at a rate of 1°C.day-1 to 21°C in T21 (stable by June 28th, 2011; Fig. 2A) and to 25°C in T25 (stable by July 7th, 2011; Fig. 2A). The T15 tank remained at 15°C (assumed at ambient temperature). Temperatures were recorded in each tank every 15 minutes using button data loggers (Signatrol SL52T Button Data Logger). Average temperature (± S.D.) was 14.8 ± 0.6°C (over 78 days) for the T15 tank, 21.4 ± 0.2°C (over 50 days) for the T21 tank and 25.2 ± 0.9°C (over 41 days) for the T25 tank (Fig. 2A).
2.3. Sampling
To monitor stable carbon isotopic composition of scallop tissues, five P. maximus were collected each week from each tank, beginning at the end of the acclimation period (June 21st, 2011) and continuing until the end of the experiment. Adductor muscle, digestive gland (stomach content expelled by rinsing with distilled water), mantle and gills were extracted from each individual, and frozen at -20°C.
At the end of the experiment, three scallops were collected from each tank and shells were analyzed for their stable carbon isotopic composition (13Cshell). In addition, three individuals of age
class I from the natural population (referred to as “field” scallops) were sampled on October 24th, 2011 at Lanvéoc (Fig. 1), a sampling site where chlorophyll a was recorded once a week from March
7
to October (Chatterjee et al., 2013). The shells of these 12 scallops (nine from tanks and three from natural population) were used to determine growth rate and δ13C carbonate analysis.
To determine carbon isotope composition of food source (δ13Calgae), 5 mL of the microalgal
mixture was sampled each week during the experiment. Samples were filtered with pre-combusted glass microfiber filters (Whatman GF/F). Prior to filtration, filters were rinsed with 10% HCl followed by a rinse with distilled water. After filtration, filters were rinsed with distilled water, immediately dried (12 h at 60°C) and stored in darkness until analysis according to Lorrain et al. (2003).
Water from each tank was sampled once a week for carbon isotope analysis of dissolved inorganic carbon (δ13CDIC). Surface seawater was also sampled at Lanvéoc once a week (from March
to October 2011) using a Niskin bottle. Each water sample was fixed with 20 µL of saturated mercuric chloride (HgCl2) in a 12 mL glass vial (Gillikin and Bouillon, 2007).
2.4. Daily growth rate, preparation and calcium carbonate sampling of shell
The daily growth rate of the 12 sample shells (experimental + “field” scallops) was individually measured from the external surface of the left valve along the dorso-ventral growth axis (Chauvaud et al., 1998). The shells were first cleaned by sonication, rinsed in Milli-Q water and then air-dried. From the first visible stria near the umbo to the outer edge of the shell, the distance between two successive daily growth striae was measured from images acquired using a high-resolution digital camera (Sony DFW-X700) and analyzed using image analysis software (Visilog®, Noesis).
The same 12 shells were also analyzed for carbon isotopic composition (13Cshell). The outer
calcite layer of the flat valve was sampled using a Dremel drill with a 0.3 mm grinding tip. Small grooves were cut parallel to growth striae along the dorso-ventral axis, from the first winter growth mark to the ventral edge of the shell. Because daily growth rate is not constant, each carbonate sample included material from 1 to 5 striae. Sampling points were separated by spaces equivalent to 1 to 2 days of growth. A total of 522 aliquots of P. maximus calcite were collected, with an average of 30 samples from experimental shells and 80 samples from “field” shells. Aliquots exhibited average sample weights of 114 ± 20 µg and were stored in clean glass vials until analysis.
8
Freeze-dried tissues were powdered and loaded into 8 x 5 mm tin cups (400 µg sample weight). Stable carbon isotopic analysis was performed at LIENSs – UMR7266 (University of La Rochelle, France) using an Elemental Analyzer (Flash EA 1112, Thermo Scientific) coupled to a Delta V Advantage isotope ratio mass spectrometer (IRMS) via a ConFlo IV interface. Isotopic data are expressed using conventional delta notation (δ) in ‰ relative to the Vienna Pee Dee Belemnite (VPDB), according to Coplen (2011):
δ13
Csample = [(Rsample / Rstandard) – 1] (eq. 1)
where R = 13C/12C. Error measurements were < 0.15‰ (1) for δ13C, as estimated using an internal acetanilide laboratory standard.
Filters with algal samples were decarbonated via exposure to HCl fumes in a dessicator for four hours (Lorrain et al., 2003), then loaded into 8 x 5 mm tin cups. Isotopic analysis followed the same methods used for tissue samples.
Stable carbon isotope ratios of total dissolved inorganic carbon (13CDIC) were measured at the
Earth System Sciences Laboratory (Vrije Universiteit Brussel, Belgium) using an Elemental Analyzer (Flash 1112 EA Thermo Finnigan) coupled to a Thermo Delta V Plus IRMS via CONFLO III. Repeated analysis of standards (Gillikin and Bouillon, 2007) established measurement precision better than 0.2‰.
All carbonate isotopic analyses (13Cshell) were performed on a Finnigan MAT 252 IRMS
equipped with a Kiel III automated sampling device at Stanford University, USA. Samples were acidified in 100% phosphoric acid at 70°C for 470 s. Repeated analysis of the NBS-19 standard (National Institute of Standards and Technology, NIST SRM 8544) yielded a 13C standard deviation of 0.023‰.
2.6. Data analysis
For each shell analyzed, samples were exactly positioned along the shell growth trajectory. Each sample was dated according to the number of striae (growth days) between two sampled areas. A calendar date was assigned to each growth stria according to its sequential position relative to the last deposited stria on the ventral margin corresponding to the growth stop (Chauvaud et al., 2005).
9
Samples containing several striae would thus yield isotopic ratios that reflect average values for the period spanned by the sampling interval. For each carbonate sample, the day of the median stria was affected to date the sample.
For clarity, we applied a linear interpolation to δ13Cshell values of each individual from each
temperature conditions (T15, T21 and T25), to calculate the daily δ13Cshell series. The δ13Cshell results
were then averaged each day for each temperature condition (n = 3 individuals for each treatment). Between two measured values of δ13CDIC, linear interpolation was realized using the relationship
observed between algal concentrations (cells.mL-1) at the inlet of the tank and 13CDIC (13CDIC =
-1.32×10⁻⁵ × (algal concentration at tank inlet) + 0.068; R2 = 0.68, p < 0.01, n = 23). Covariation between δ13Cshell and δ13CDIC was then calculated for each treatment (T15, T21 and T25).
We used an equation described in McConnaughey et al. (1997) to estimate percentage of metabolic carbon in the shell (% CM):
% CM = 100 × (δ13Cshell – εcal-b – δ13CDIC) / (δ13CR – δ13CDIC) (eq. 2)
where εcal-b is the enrichment factor between bicarbonate and calcite independent of temperature in
the range of 10 to 40°C, and equals 1‰ (Romanek et al., 1992). The δ13CDIC term refers to the
carbon isotope ratio of dissolved inorganic carbon measured in each tank or in the natural environment, and δ13CR refers to the carbon isotope composition of respired carbon as measured
from tissue (δ13Ctissue) according to Tanaka et al. (1986) and McConnaughey et al. (1997). Given the
lack of consensus on the most relevant tissue for estimating δ13CR, we calculated CM values from
each (δ13C of muscle, mantle, gills and digestive gland). Values for δ13Ctissues declined until July 19th,
2011, and then remained constant until the end of the experiment (steady-state period, data not shown). Averaged δ13Ctissues values from the steady-state period were used in equation 2. Under the
assumption that they resembled the final metabolized substrate in respective laboratory and field assays, 13Calgae (laboratory experiment) and 13C of particular organic matter (13CPOM for “field”
scallops) were also used as 13CR values.
All statistical analyses were performed using the R software package (R development Core Team, 2005). Comparison of data used ANOVA or Kruskal-Wallis tests if assumptions of normality (Shapiro-Wilk test) or homogeneity of variances (Bartlett test) were in question. For pairwise comparisons, Student tests were applied or Wilcoxon tests in cases where assumptions of normality or homogeneity of variances were not respected. Because δ13Cshell values did not exhibit normality,
Kendall correlations tests were used to evaluate the correlations between δ13Cshell variations between
10
3. Results
3.1. Experimental conditions
Microalgal quantity distributed in each tank was scaled back during the experiment (from 33.2×10⁴ to 5.9×10⁴ cells.mL-1; Fig. 2B) to compensate for fewer scallops in tanks due to sampling during the experiment. The average microalgal concentrations (± S.D.) in the tanks during the experiment were 4.3×10⁴ ± 1.6×10⁴, 3.0×10⁴ ± 1.4 ×10⁴ and 3.3×10⁴ ± 1.3x10⁴ cells.mL-1 for T15, T21 and T25 treatments, respectively(Fig. 2B). Quantity of algae distributed differed significantly among treatments (Kruskal-Wallis: p < 0.01).
The microalgal carbon isotopic ratio (δ13Calgae) remained stable throughout the experiment, and
showed no differences among tanks (ANOVA: p = 0.87). The T15 and T25 treatments exhibited
13
Calgae values of -54.0 ± 1.4‰ (the two tanks shared the same algae source), while the T21
treatment gave 13Calgae values of -53.7 ± 1.7‰.
Values of δ13CDIC remained relatively stable during the first part of the experiment and then
increased sporadically after July 7th, 2011, once temperatures had stabilized in all treatments (Fig. 2C). Values for δ13CDIC ranged from -4.3‰ to 0.07‰ and did not vary significantly between
treatments (ANOVA: p = 0.72).
3.2. Shell growth
Total shell growth at the end of the experiment reached 7.1 ± 2.0 mm, 7.1 ± 0.9 mm and 3.5 ± 1.2 mm (average ± S.D., n = 3) for T15, T21 and T25 treatments, respectively and 44.4 ± 3.5 mm for “field” scallops from early March to October 24th
, 2011. Daily growth rate averages during growth periods were 112.5 ± 30.0 µm.day-1, 99.9 ± 34.7 µm.day-1, 92.1 ± 29.5 µm.day-1 and 192.2 ± 62.7 µm.day-1 for T15, T21, T25 treatments and “field” scallops, respectively. Scallops in the T15 and T21 treatments grew until the end of the experiment (August 15th and August 13th, 2011, respectively), whereas scallops in the T25 treatment ceased to grow (by the latest) on July 11th, 2011.
11
Steady-state conditions between tissues and food resulted in δ13Ctissues values that differed
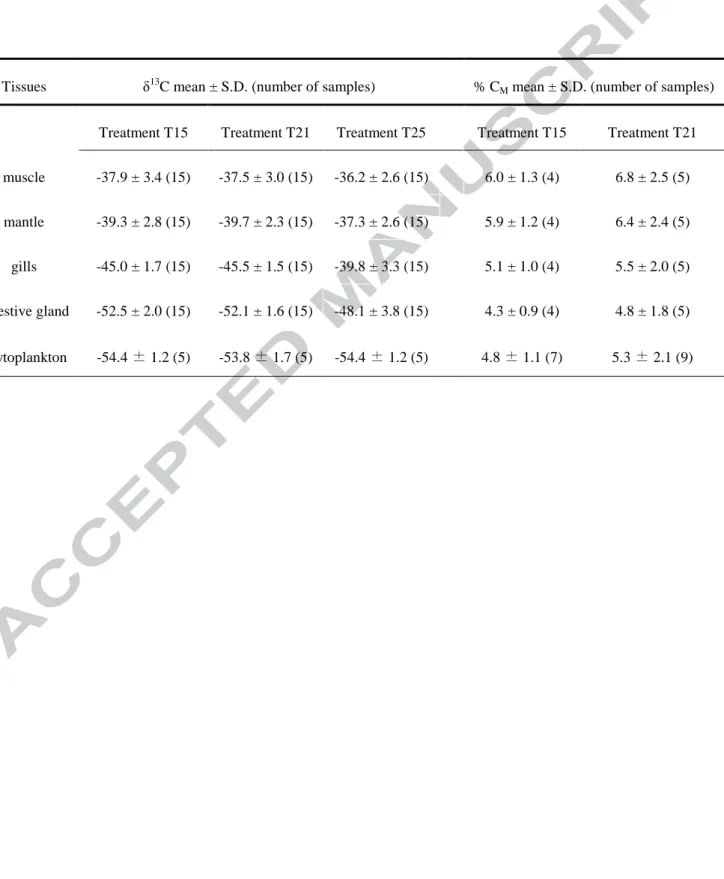
significantly among tissue types, regardless of temperature (ANOVA: p < 0.01). These variations followed the general pattern of δ13Cdigestive gland < δ13Cgills < δ13Cmantle < δ13Cmuscle (Table 1). Gills and
digestive gland tissues also exhibited significantly lower δ13C for scallops in the T25 treatment, relative to values for scallops in the two other treatments (Kruskal-Wallis: p < 0.01). Muscle and mantle tissues had similar δ13C values regardless of temperature condition (ANOVA: pmuscle = 0.17,
pmantle = 0.07; Table 1).
Prior to the application of controlled experimental conditions (May 31st, 2011), δ13Cshell
stabilized at mean values of 0.8 ± 0.3‰ (n = 9) (Fig. 3). At the beginning of the experiment, 13Cshell
values start to decrease for all scallops. Minimum values of -5.3 ± 0.9‰ (T15), -5.5 ± 0.6‰ (T21) and -6.9 ± 0.1‰ (T25) occurred from June 25th and 29th for all treatments. Shells appear to have reached steady-state after 26 to 30 days. After this point, both δ13Cshell and 13CDIC values increased
in each treatment until the end (Fig. 3). During the steady-state period (from June 17th to August 16th, 2011 for T15 and from June 19th to August 16th, 2011 for T21), δ13Cshell variation from the T15
treatment resembled that of the T21 treatment (r = 0.49, p < 0.01). Values for δ13Cshell and δ13CDIC
also covaried in the T15 (r = 0.63, p < 0.01) and T21 treatments (r = 0.36, p < 0.01).
3.4. Metabolic contribution
Metabolic carbon incorporated into shell carbonate was calculated from equation 2 (McConnaughey et al., 1997) using values recorded from July 19th, 2011 to August 16th, 2011, when δ13
Ctissues reached steady-state relative to the 13C depleted food source (δ13Calgae). The contribution of
metabolic carbon (CM) to shell carbonate varied between 4.3 ± 0.9% and 6.8 ± 2.5%, respectively,
measured from δ13Cdigestive gland and 13Cmuscle as proxies for 13CR (Table 1). Estimation of CM from
different reference tissues did not significantly differ according to experimental conditions (ANOVA: p = 0.19 for T15 and p = 0.55 for T21; Table 1). CM calculated from different tissue types
also did not differ significantly among different temperature conditions (Student tests: pmuscle = 0.61,
pmantle = 0.70, pgills = 0.72, pdigestive gland = 0.67 and palgae = 0.62). Metabolic carbon contribution
estimates from the T25 treatment were not available because shells stopped growing before reaching steady-state conditions with respect to δ13Ctissues and δ13Calgae.
12
3.5. δ13CDIC and δ13Cshell values from the natural environment
In 2011, δ13CDIC measured at Lanvéoc reached their lowest values in winter (minimum of -0.6‰
on 1 March), then increased (with some variation) to reach maximum values on 26 May (1.8‰). Values then slowly decreased during summer and autumn but did not reach 0‰ (Fig. 4).
δ13
Cshell of the 3 “field” scallops slightly decreased, from 0.4‰ in March 2011 to -0.7‰ in
October 2011, with some variation (Fig. 4).
4. Discussion
During periods of active growth, mollusk shells record variations in environmental conditions such as food sources or dissolved inorganic carbon (Wilbur and Saleuddin, 1983; McConnaughey and Gillikin, 2008). During the experiment described here, minimum P. maximus shell growth of 2.1 mm (over 33 days) was observed in the T25 treatment. This rate created enough material to record experimental conditions.
4.1. Carbon sources for shell carbonate under controlled conditions
Shell carbon mostly originates from seawater DIC, as shown by the significant correlation between δ13Cshell and δ13CDIC (Fig. 3). Poulain et al. (2010) and Beirne et al. (2012) also reported
covarying δ13Cshell and δ13CDIC values. Values for δ13Cshell more closely resembled those of δ13CDIC
than those of δ13Calgae. For example, δ13Cshell did not fall below -8‰ whereas the average δ13Calgae
was -54‰. The proportion of metabolic carbon using δ13Ctissues as estimate of δ13CR, ranged from 4.3
± 0.9% to 6.8 ± 2.5%. These values, established under controlled conditions, resemble previously reported results from P. maximus in the natural environment (Lorrain et al., 2004) and from other marine bivalves (Gillikin et al., 2005; Gillikin et al., 2006; Poulain et al., 2010; Beirne et al., 2012). Studies by Gillikin et al. (2007; 2009) on Mercenaria mercenaria (marine bivalve) and Pyganodon cataracta (freshwater bivalve) however, did not find similar low values for metabolic carbon contribution to shell. These authors estimated metabolic carbon contribution ranging from 5 to 37%
13
and 15 to 35% for M. mercenaria and P. cataracta, respectively and ascribed their findings to ontogenetic effects, wherein larger shells incorporated greater relative proportions of metabolic carbon (Gillikin et al., 2007; Gillikin et al., 2009). The bivalves used in this study were juveniles (1 year old) and thus were not subject to similar ontogenetic effects. P. maximus δ13Cshell could serve as
a proxy for environmental δ13CDIC, but the influence of respired CO2 and other processes complicates
interpretation of δ13
Cshell variation.
As previously shown by Chauvaud et al. (2011) and Owen et al. (2002a), and demonstrated by our experiment, temperature does not appear to strongly influence δ13Cshell over a 15 to 21°C range.
Values for δ13Cshell varied independently of temperature (Fig. 3). P. maximus may consume more as
temperature increases (Laing, 2000), thus respiring more, and making more CO2 available for
calcification. Metabolic oxygen demand in scallops also increases with seawater temperature, again increasing the amount of respired CO2. In this study, percentage of metabolic carbon integrated into
shell carbonate did not differ significantly according to temperature, regardless of the tissue type used to estimate CM (Table 1). During an increase in temperature however, the minimum δ13Cshell
value did differ according to temperature condition. Stronger metabolism and greater integration of metabolic carbon into carbonates with increasing temperature may explain these aspects of the data.
Integration of DIC and/or metabolic carbon from food source into shell carbonate was rapid, and reached steady-state after 26 to 30 days. Using the same experimental design, Poulain et al. (2010) found a similar trends among Manila clams. Extrapallial fluid directly incorporates DIC and uses it to precipitate calcite, whereas respired CO2 can derive from several metabolic processes occurring in
tissues and hemolymph (Wilbur and Saleuddin, 1983; McConnaughey and Gillikin, 2008). The incorporation delay is consistent with tissue turnover observed among bivalves (Paulet et al., 2006). At the beginning of the experiment, carbonate precipitation may have rapidly assimilated 13C depleted DIC, mixing it with respired CO2 from food ingested prior to the experiment. Once
δ13
Ctissues reached steady-state with δ13Calgae (50 days after the start of the experiment), metabolic
carbon incorporated into calcite (less than 10%) assumed the 13C composition of the phytoplankton food source given during the experiment.
4.2. Input of the integration of experimental and natural environment data
Data from scallops reared under laboratory conditions and from scallops in their natural environment confirm the influence of 13CDIC and 13C of food sources (13Cfood) on 13Cshell values.
14
CM reached values of around 10% (from 4.3 to 6.8% under experimental conditions and from 1.9 to
16.6% in the natural environment; Fig. 6), as predicted by the “respiratory gas exchange model” described in McConnaughey et al. (1997). Both environmental factors (temperature, pH and stable carbon isotopic composition of food) and physiological parameters (metabolism, shell growth rate and ontogeny) influence 13Cshell variation.
The shift in stable carbon isotopic composition of food provided the opportunity to study its effect on the predicted equilibrium between calcium carbonate and ambient bicarbonate (Fig. 5A). Data from “field” scallops showed an offset (from equilibrium) of 1.7 ± 0.6‰ while those from scallops reared under experimental conditions showed an offset of 2.5 ± 0.5 and 3.2 ± 0.9‰ for individuals maintained at temperatures of 15 and 21°C, respectively. Differences between these values were significant (pairwise Wilcoxon: “field”/T15: p < 0.001, “field”/T21: p < 0.001 and T15/T21: p < 0.001). This indicates that a -21‰ to -54‰ shift in the stable carbon isotopic composition of food sources causes the 1.7‰ offset from the predicted equilibrium to shift to 2.5‰ at 15°C and to 3.2‰ at 21°C. Even given covarying relations between 13Cshell and 13CDIC observed
from T15 and T21 experimental data, the steady-state conditions among 13C values of food, DIC, tissues and shell coincide with offset values significantly different from zero, thus demonstrating the significant influence of 13Cfood on 13Cshell values. The greater similarity of 13Cshell values to those
of 13CDIC, rather than to those of 13Cfood indicates a relatively low metabolic carbon contribution to
shell carbon. The offset difference observed between data from the 15 and 21°C laboratory temperature conditions could result from a slightly higher carbon metabolic contribution documented in the T21 data.
The difference in offset observed for the “field” and experimental data could also reflect growth rate differences. Plots of daily growth rate versus offset in “field” scallop data (Fig. 5B, open circles), show a low growth rate group with an offset of 0.5‰, and a high growth rate group with an offset of 1.8‰. In the natural environment, low growth rates correspond to low food level and low temperature conditions, whereas high growth rates reflect the opposite (Fig. 6). A 3‰ offset for experimental scallop shell data is therefore not consistent with growth rate variation.
Food supply and temperature effects may introduce annual variation in organic carbon incorporation (CM) values in “field” scallop data. Shell growth recommences at the end of the winter,
in tandem with an increase in organic carbon contribution to shell. At that time of the year, CM in the
shell is around 2%. As food availability and temperatures increase, CM also rises progressively (Fig.
15
surface temperatures began to drop. Surprisingly, CM fell to values of 2.9% in early May, when shell
growth rate declined with the onset of a phytoplankton bloom. Chauvaud et al. (1998) and Lorrain et al. (2000) have previously documented declines in P. maximus shell growth during spring blooms, suggesting that it reflects a reduction in feeding. Spring CM values approaching zero support these
earlier observations and interpretations.
According to Chatterjee et al. (2013), the 2011 seasonal variation in food sources for benthic filter-feeders in the Bay of Brest (Lanvéoc) divides into four periods. These include (1) periods of very low food concentration from January to the end of February and from mid-October to the end of December, (2) a period when microphytobenthos bloomed and phytoplankton were present, from March to the end of April, (3) a period during which phytoplankton bloomed and microphytobenthos were still productive, from May to the end of May, and (4) a period when only phytoplankton were present, from June to mid-October (Fig. 6). The integration of metabolic carbon into carbonate varied significantly (Kruskal-Wallis: p < 0.01), according to the four defined periods, regardless of value types used to estimate 13CR values (including 13Cmuscle for scallops sampled in 2000 by
Lorrain et al. (2002), or 13CPOM sampled in 2011; see Fig. 6 legend for details). This variation
probably reflects seasonal growth trends for P. maximus described by Guarini et al. (2011). These authors interpreted winter as a period of limited food availability, when P. maximus suspends morphodynamic development and reduces metabolic activity. Spring represents a period of high food availability and increased metabolism for the organism (Pazos et al., 1997; Guarini et al., 2011). A transition phase occurs between these two periods, in which the organism’s feeding and growth shift to accommodate changes in metabolic activity. When integrated with the equation of McConnaughey et al. (1997) these different phases give:
13
Cshell = (13Cfood × CM) + (13CDIC × (100 – CM)) + 1
The consequences for 13Cshell values were that 13CDIC equaled 13Cshell measured at the end of the
winter, minus 1‰ when the growth recommenced, and CM tended towards 0%. This demonstrates
that CM values should be estimated at the end of the transition phase, once shells reach steady-state.
5. Conclusion
This study used laboratory experiments and data from the natural environment to calibrate and interpret P. maximus as a paleoenvironmental proxy. Data from laboratory experiment allowed us to
16
study seasonal variation in 13Cshell values and provide further information on previously proposed
relation between growth rate and 13Cshell (Lorrain et al., 2004). Uptake of the strongly depleted food
source demonstrated how carbonates values diverge from predicted equilibrium values with ambient bicarbonate. In contrast to the findings of Chauvaud et al. (2011), data from this study demonstrated that 13Cshell values from scallops can serve as accurate proxy values for 13CDIC, when measured
from calcite forming during the period when recovery in shell growth occurs. Moreover, Chauvaud et al. (2011) did identify similar patterns when they removed the ontogenetic signal from 13Cshell
values measured from large P. maximus individuals. The reassessed 13Cshell values presented by
Chauvaud et al. (2011), referred to as 13Cshell detrended had similar annual minima, confirming that this
value can serve as a proxy for 13CDIC.
Ecophysiological studies can also benefit from 13Cshell information. Seasonal variation in CM
from the age class I scallops (one year old) analyzed here can now be used to reinterpret 13Cshell data
from older individuals.
Acknowledgements
The project was supported by the French program COMANCHE (Agence Nationale de la Recherche, ANR-2010-STRA-010), the French program CHIVAS (Agence Nationale de la Recherche, ANR-Blanc) and the Natural Environment Research Council (grant NE/G000018/1 to LSP). We thank the Service d’Observation en Milieu Littoral, INSU-CNRS, station de Brest (http://somlit.epoc.u-bordeaux1.fr/fr/) for providing temperature and δ13CPOM data. The authors also
thank all the staff of the IFREMER shellfish laboratory at Argenton, the Tinduff scallop hatchery for providing juvenile scallops, and Anne Lorrain, who contributed scallop data as well as helpful comments and feedback. We are also grateful to the entire CHIVAS team for their perseverance that enabled the full survey at Lanvéoc in 2011. We are grateful to Dr. J. N. Sutton for English and editing improvements. V. Marchais was supported by a doctoral grant from the Université de Bretagne Occidentale.
17
Arthur M. A., Williams D. F. and Jones D. S. (1983) Seasonal temperature-salinity changes and thermocline development in the mid-Atlantic Bight as recorded by the isotopic composition of bivalves. Geology 11, 655-659.
Beirne E. C., Wanamaker Jr A. D. and Feindel S. C. (2012) Experimental validation of environmental controls on the δ13
C of Arctica islandica (ocean quahog) shell carbonate. Geochim. Cosmochim. Acta 84, 395-409.
Butler P. G., Wanamaker Jr A. D., Scourse J. D., Richardson C. A. and Reynolds D. R. (2011) The stability of shell δ13
C with respect to biological age in mature specimens of the long-lived bivalve Arctica islandica. Palaeogeogr. Palaeoclimatol. Palaeocol. 302, 21-30.
Chatterjee A., Klein C., Naegelen A., Claquin P., Masson A., Legoff M., Amice E., L'Helguen S., Chauvaud L. and Leynaert A. (2013) Comparative dynamics of pelagic and benthic micro-algae in a coastal ecosystem. Est. Coast. Shelf Sci. 133, 67-77.
Chauvaud L., Thouzeau G. and Paulet Y.-M. (1998) Effects of environmental factors on the daily growth rate of Pecten maximus juveniles in the Bay of Brest (France). J. Exp. Mar. Bio. Ecol.
227, 83-111.
Chauvaud L., Lorrain A., Dunbar R. B., Paulet Y.-M., Thouzeau G., Jean F., Guarini J.-M. and Mucciarone D. (2005) Shell of the Great Scallop Pecten maximus as a high-frequency archive of paleoenvironmental changes. Geochim. Geophy. Geosyst. 6, 1-15.
Chauvaud L., Thébault J., Clavier J., Lorrain A. and Strand Ø. (2011) What’s hiding behind ontogenetic δ13
C variations in mollusk shells? New insights from the Great Scallop (Pecten maximus). Estuar. Coast. 34, 211-220.
Chauvaud L., Patry Y., Jolivet A., Cam E., Le Goff C., Strand Ø., Charrier G., Thébault J., Lazure P. and Gotthard K. (2012) Variation in size and growth of the great scallop Pecten maximus along a latitudinal gradient. PloS one 7, e37717.
Coplen T. B. (2011) Guidelines and recommended terms for expression of stable isotope ratio and gas ratio measurement results. Rapid Commum. Mass Spectrom. 25, 2538-2560.
Craig H. (1965) Measurement of oxygen isotope paleotemperatures, in: Tongiori, E. (Ed.), Stable isotopes in oceanographic studies and paleotemperatures. Cons. Naz. delle Ric., Spoleto, Italy, pp. 161-182.
Davenport C. B. (1938) Growth lines in fossil pectens as indicators of past climates. J. Paleontol. 12, 514-515.
18
Dettman D. L., Reische A. K. and Lohmann K. C. (1999) Controls on the stable isotope composition of seasonal growth bands in aragonitic fresh-water bivalves (Unionidae). Geochim. Cosmochim. Acta 63, 1049-1057.
Emiliani C. (1966) Isotopic paleotemperatures. Science 154, 851-857.
Epstein S., Buchsbaum R., Lowenstam H. A. and Urey H. C. (1953) Revised carbonate-water isotopic temperature scale. Geol. Soc. Am. Bull. 64, 1315-1326.
Erez J. (1978) Vital effect on stable-isotope composition seen in foraminifera and coral skeletons. Science 273, 199-202.
Furla P., Galgani I., Durand I. and Allemand D. (2000) Sources and mechanisms of inorganic carbon transport for coral calcification and photosynthesis. J. Exp. Biol. 203, 3445-3457.
Geist J., Auerswald K. and Boom A. (2005) Stable carbon isotopes in freshwater mussel shells: environmental record or marker for metabolic activity? Geochim. Cosmochim. Acta 69, 3545-3554.
Gillikin D. P., De Ridder F., Ulens H., Elskens M., Keppens E., Baeyens W. and Dehairs F. (2005) Assessing the reproducibility and reliability of estuarine bivalve shells (Saxidomus giganteus) for sea surface temperature reconstruction: Implications for paleoclimate studies. Palaeogeogr. Palaeoclimatol. Palaeocol. 228, 70-85.
Gillikin D. P., Lorrain A., Bouillon S., Willenz P. and Dehairs F. (2006) Stable carbon isotopic composition of Mytilus edulis shells: relation to metabolism, salinity, 13CDIC and
phytoplankton. Org. Geochem. 37, 1371-1382.
Gillikin D. P. and Bouillon S. (2007) Determination of 18O of water and 13C of dissolved inorganic carbon using a simple modification of an elemental analyser isotope ratio mass spectrometer: an evaluation. Rapid Commum. Mass Spectrom. 21, 1475-1478.
Gillikin D. P., Lorrain A., Meng L. and Dehairs F. (2007) A large metabolic carbon contribution to the 13C record in marine aragonitic bivalve shells. Geochim. Cosmochim. Acta 71, 2936-2946. Gillikin D. P., Hutchinson K. A. and Kumai Y. (2009) Ontogenic increase of metabolic carbon in
freshwater mussel shells (Pyganodon cataracta). J. Geophys. Res. 114, G01007.
Gonzalez L. A. and Lohmann K. C. (1985) Carbon and oxygen isotopic composition of Holocene reefal carbonates. Geology 13, 811-814.
19
Grossman E. L. and Ku T. L. (1986) Oxygen and carbon isotope fractionation in biogenic aragonite: temperature effects. Chem. Geol. 59, 59-74.
Guarini J.-M., Chauvaud L., Cloern J. E., Clavier J., Coston-Guarini J. and Patry Y. (2011) Seasonal variations in ectotherm growth rates: quantifying growth as an intermittent non steady state compensatory process. J. Sea Res. 65, 355-361.
Ingram B. L., Conrad M. E. and Ingle J. C. (1996) Stable isotope and salinity systematics in estuarine waters and carbonates: San Francisco Bay. Geochim. Cosmochim. Acta 60, 455-467.
Killingley J. S. and Berger W. H. (1979) Stable isotopes in a mollusk shell: detection of upwelling events. Science 205, 186-188.
Klein R. T., Lohmann K. C. and Thayer C. W. (1996) SrCa and 13C/12C ratios in skeletal calcite of Mytilus trossulus: covariation with metabolic rate, salinity, and carbon isotopic composition of seawater. Geochim. Cosmochim. Acta 60, 4207-4221.
Krantz D. E., Williams D. F. and Jones D. S. (1987) Ecological and paleoenvironmental information using stable isotope profiles from living and fossil molluscs. Palaeogeogr. Palaeoclimatol. Palaeocol. 58, 249-266.
Laing I. (2000) Effect of temperature and ration on growth and condition of king scallop (Pecten maximus) spat. Aquaculture 183, 325-334.
Lorrain A., Paulet Y.-M., Chauvaud L., Savoye N., Nézan E. and Guérin L. (2000) Growth anomalies in Pecten maximus from coastal waters (Bay of Brest, France): relationship with diatom blooms. J. Mar. Biol. Assoc. U. K. 80, 667-673.
Lorrain A., Paulet Y. M., Chauvaud L., Savoye N., Donval A. and Saout C. (2002) Differential 13C and 15N signatures among scallop tissues: implications for ecology and physiology. J. Exp. Mar. Bio. Ecol. 275, 47-61.
Lorrain A., Savoye N., Chauvaud L., Paulet Y. M. and Naulet N. (2003) Decarbonation and preservation method for the analysis of organic C and N contents and stable isotope ratios of low-carbonated suspended particulate material. Anal. Chim. Acta 491, 125-133.
Lorrain A., Paulet Y. M., Chauvaud L., Dunbar R., Mucciarone D. and Fontugne M. (2004) 13C variation in scallop shells: Increasing metabolic carbon contribution with body size? Geochim. Cosmochim. Acta 68, 3509-3519.
20
McConnaughey T. (1989a) 13C and 18O isotopic disequilibrium in biological carbonates. 1. Patterns. Geochim. Cosmochim. Acta 53, 151-162.
McConnaughey T. (1989b) 13C and 18O isotopic disequilibrium in biological carbonates. 2. in vitro simulation of kinetic isotope effects. Geochim. Cosmochim. Acta 53, 163-171.
McConnaughey T. A., Burdett J., Whelan J. F. and Paull C. K. (1997) Carbon isotopes in biological carbonates: respiration and photosynthesis. Geochim. Cosmochim. Acta 61, 611-622.
McConnaughey T. A. and Gillikin D. P. (2008) Carbon isotopes in mollusk shell carbonates. Geo-Mar. Lett. 28, 287-299.
Mook W. G. and Vogel J. C. (1968) Isotopic equilibrium between shells and their environment. Science 159, 874-875.
Mook W. G. (1971) Paleotemperatures and chlorinities from stable carbon and oxygen isotopes in shell carbonate. Palaeogeogr. Palaeoclimatol. Palaeocol. 9, 245-263.
O'Neil J. R., Clayton R. N. and Mayeda T. K. (1969) Oxygen isotope fractionation in divalent metal carbonates. J. Chem. Phys. 51, 5547-5557.
Owen R., Kennedy H. and Richardson C. (2002a) Experimental investigation into partitioning of stable isotopes between scallop (Pecten maximus) shell calcite and sea water. Palaeogeogr. Palaeoclimatol. Palaeocol. 185, 163-174.
Owen R., Kennedy H. and Richardson C. (2002b) Isotopic partitioning between scallop shell calcite and seawater: effect of shell growth rate. Geochim. Cosmochim. Acta 66, 1727-1737.
Paulet Y.-M., Lucas A. and Gerard A. (1988) Reproduction and larval development in two Pecten maximus (L.) populations from Brittany. J. Exp. Mar. Bio. Ecol. 119, 145-156.
Paulet Y. M., Lorrain A., Richard J. and Pouvreau S. (2006) Experimental shift in diet 13C: A potential tool for ecophysiological studies in marine bivalves. Org. Geochem. 37, 1359-1370. Pazos A. J., Román G., Acosta C. P., Abad M. and Sánchez J. L. (1997) Seasonal changes in
condition and biochemical composition of the scallop Pecten maximus L. from suspended culture in the Ria de Arousa (Galicia, N.W. Spain) in relation to environmental conditions. J. Exp. Mar. Bio. Ecol. 211, 169-193.
Poulain C., Lorrain A., Mas R., Gillikin D. P., Dehairs F., Robert R. and Paulet Y.-M. (2010) Experimental shift of diet and DIC stable carbon isotopes: Influence on shell δ13
C values in the Manila clam Ruditapes philippinarum. Chem. Geol. 272, 75-82.
21
R development Core Team (2005) R : a language and environment for statistical computing, R Foundation for Statistical Computing, Vienna, Austria.
Romanek C. S., Grossman E. L. and Morse J. W. (1992) Carbon isotopic fractionation in synthetic aragonite and calcite: Effects of temperature and precipitation rate. Geochim. Cosmochim. Acta
56, 419-430.
Saout C., Quéré C., Donval A., Paulet Y.-M. and Samain J.-F. (1999) An experimental study of the combined effects of temperature and photoperiod on reproductive physiology of Pecten maximus from the Bay of Brest (France). Aquaculture 172, 301-314.
Schöne B. R., Lega J., Flessa K. W., Goodwin D. H. and Dettman D. L. (2002) Reconstructing daily temperatures from growth rates of the intertidal bivalve mollusk Chione cortezi (northern Gulf of California, Mexico). Palaeogeogr. Palaeoclimatol. Palaeocol. 184, 131-146.
Schöne B. R., Oschmann W., Rössler J., Castro A. D. F., Houk S. D., Kröncke I., Dreyer W., Janssen R., Rumohr H. and Dunca E. (2003) North Atlantic Oscillation dynamics recorded in shells of a long-lived bivalve mollusk. Geology 31, 1037-1040.
Schöne B. R., Fiebig J., Pfeiffer M., Gleβ R., Hickson J., Johnson A. L., Dreyer W. and Oschmann W. (2005) Climate records from a bivalve Methuselah (Arctica islandica, Mollusca; Iceland). Palaeogeogr. Palaeoclimatol. Palaeocol. 228, 130-148.
Shackleton N. J. (1967) Oxygen isotope analyses and Pleistocene temperatures re-assessed. Nature
215, 15-17.
Shackleton N. J., Wiseman J. D. H. and Buckley H. A. (1973) Non-equilibrium isotopic fractionation between seawater and planktonic foraminiferal tests. Nature 242, 177-179.
Stanton J., Robert J and Dodd J. R. (1970) Paleoecologic techniques: comparison of faunal and geochemical analyses of Pliocene paleoenvironments, Kettleman Hills, California. J. Paleontol. 44, 1092-1121.
Swart P. K. (1983) Carbon and oxygen isotope fractionation in scleractinian corals: a review. Earth Sci. Rev. 19, 51-80.
Tanaka N., Monaghan M. C. and Rye D. M. (1986) Contribution of metabolic carbon to mollusc and barnacle shell carbonate. Nature 320, 520-523.
Urey H. C. (1947) The thermodynamic properties of isotopic substances. J. Chem. Soc. 1947, 562-581.
22
Utting S. D. and Millican P. F. (1998) The role of diet in hatchery conditioning of Pecten maximus (L).: a review. Aquaculture 165, 167-178.
Vander Putten E., Dehairs F., Keppens E. and Baeyens W. (2000) High resolution distribution of trace elements in the calcite shell layer of modern Mytilus edulis: environmental and biological controls. Geochim. Cosmochim. Acta 64, 997-1011.
Wanamaker A. D., Jr, Kreutz K. J., Borns Jr H. W., Introne D. S., Feindel S., Funder S., Rawson P. D. and Barber B. J. (2007) Experimental determination of salinity, temperature, growth, and metabolic effects on shell isotope chemistry of Mytilus edulis collected from Maine and Greenland. Paleoceanography 22, 1-12.
Wilbur K. M. and Saleuddin A. S. M. (1983) Shell Formation, in: Saleuddin, A.S.M., Wilbur, K.M. (Eds.), The Mollusca. Academic Press, Inc., pp. 235-287.
23
Figure legends
Figure 1: Location of Tinduff bivalve hatchery, Sainte-Anne du Portzic where Pecten maximus scallops were raised for their first year, Argenton shellfish laboratory where the experiment was conducted, and of the Lanvéoc site where “field” scallops were collected.
Figure 2: Seawater parameters recorded for the three treatments during the experiment: (A) seawater temperatures into the three tanks, (B) number of algal cells measured whithin (solid lines) and at the inlet of the experimental tanks (dashed lines), and (C) δ13CDIC interpolated (dashed lines) between
measured values (solid points) from linear regression (13CDIC = -1.32×10⁵ × (algal concentration at
tank inlet) + 0.068, R2 = 0.68, p < 0.01, n = 23). Light grey: 15°C treatment (T15), grey: 21°C treatment (T21), black: 25°C treatment (T25). : beginning of laboratory experiment, : beginning of water temperature increase, : water temperature stable for T21, : water temperature stable for T25, : end of experiment.
Figure 3: Average δ13Cshell ± S.D. (n = 3 individuals per treatment and n = 9 before onset of
experimental temperature conditions) and δ13CDIC inside the tanks during the experiment. Dashed
line: 13Cshell of scallops under natural conditions, solid lines: δ13Cshell from laboratory experiment,
dotted lines: 13CDIC. Light grey: 15°C treatment (T15), grey: 21°C treatment (T21), black: 25°C
treatment (T25). Arrows: end of shell growth. : beginning of laboratory experiment, : beginning of water temperature increase, : water temperature stable for T21, : water temperature stable for T25, : end of experiment.
Figure 4: δ13Cshell values for three “field” scallops growing throughout the year 2011 along with
surface seawater δ13CDIC at Lanvéoc station. The three “field” scallops were collected on October
24th, 2011. Black solid circles: δ13Cshell of “field” scallops, grey dashed line: 13CDIC. Arrows: end of
shell growth.
Figure 5: (A) δ13Cshell versus δ13CDIC values plotted relative to the empirically determined
relationship between inorganic calcite and bicarbonate (black line; Romanek et al., 1992). (B) Isotopic fractionation between calcite and DIC versus daily growth rate. Open circles: “field” scallops, solid circles: laboratory experiment scallops during steady-state period (from July 19th,
24
2011 to August 16th, 2011), light grey: T15 treatment, grey: T21 treatment, crosses: centre of each scatter plot on graph A.
Figure 6: Field scallop data compiled in order to estimate percentage of organic carbon integrated into the shell over four periods of the year (2011), defined according to variation in food sources: (1) periods of very low food concentration, from January to the end of February and from mid-October to the end of December, (2) period when microphytobenthos bloomed and phytoplankton were present, from March to the end of April, (3) period during which phytoplankton bloomed and microphytobenthos were still productive, from May to the end of May and (4) period when only phytoplankton were present, from June to mid-October. (a) Chlorophyll a data (microphytobenthos and phytoplankton) sampled at Lanvéoc in 2011 (Chatterjee et al., 2013). (b) Daily growth rate for class I great scallop shells (grey line, average ± confidence interval at 5%, n = 22 individuals) sampled October 24th, 2011 at Lanvéoc, sea surface temperature (dashed grey line) measured at Sainte-Anne du Portzic (see Fig. 1), data provided by Marel buoy (IUEM-IFREMER/UBO/INSU-CNRS, agreement n° 11/2-210922) and CM (black line, average ± S.D.) estimated by equation 2
using 13Cmuscle as a proxy for 13CR. (c) Surface water δ13CDIC and δ13Cshell of great scallops (age
class I; average ± S.D.) sampled in 2011 at Lanvéoc (from Fig. 4) for each of the four periods. (d) δ13
Cmuscle (annual average ± S.D.) of age class III great scallop sampled at Roscanvel (Bay of Brest)
in 2000 (data from Lorrain et al., 2002). (e) 13CPOM (average ± S.D.) of sub-surface water sampled
at Sainte-Anne du Portzic (Fig. 1) for each of the four periods (data from Service d’Observation en Milieu Littoral (SOMLIT), INSU-CNRS, station de Brest). (f) CM (average ± S.D.) estimated from
equation 2 using δ13CDIC andδ13Cshell from 2011 and δ13Cmuscle (as proxy for 13CR) from 2000. (g) CM
(average ± S.D.) estimated from equation 2 using δ13CDIC, δ13Cshell and δ13CPOM (as proxy for 13CR)
ARGENTON IFREMER Shellfish laboratory Brest Sainte-Anne du Portzic Tinduff Lanvéoc Iroise sea Bay of Brest 5 km 4°48’ W 4° W 48°30’ N 48°12’ N France N S E W
δ 13C D IC (‰) Time
B
Time 31/05 22/06 07/07 17/07 27/07 06/08 16/08A
10 20 30 N um be r o f a lg al ce lls (x 10 4 ce lls.m L -1) 0 5 15 25 35 28/06 1 2 3 4 5 0 -1 -2 -3 -4 31/05 22/0628/0607/07 17/07 27/07 06/08 16/08 1 2 3 4 5 Temperature (°C) 30 25 20 15 10 Time 31/05 22/0628/0607/07 17/07 27/07 06/08 16/08 1 2 3 4 5C
2 0 -2 -4 -6 δ 13C (‰) 01/05 31/05 22/06 28/06 07/07 01/08 16/08 Time 1 2 3 4 5 15 °C stable temperature
01/04 01/05 01/06 01/07 01/08 01/09 01/10 Time 01/03 -1 -0.5 0.5 1 1.5 δ 1 3C ( ‰) 01/11 0
+
+
+
0 -2 -4 -6 δ 13C shell (‰) -3 -2 -1 0 1 2 δ13C DIC (‰) Offset = 1.7 ± 0.6 ‰ Offset = 2.5 ± 0.5 ‰ Offset = 3.2 ± 0.9 ‰ 5 4 3 2 1 0 50 100 150 200 250daily growth rate (µm.jour-1) A B 300 350 Of fse t ( ‰)
Time microphytobenthos phytoplankton δ13C DIC - 0.5 ± 0.8 ‰ 0.1 ± 0.5 ‰ 0.7 ± 0.3 ‰ 0.6 ± 0.2 ‰ - 15.3 ± 0.3 ‰ δ13C muscle δ13C shell 0.1 ± 0.2 ‰ - 0.3 ± 0.2 ‰ - 0.4 ± 0.2 ‰ 7.2 ± 3.4 % 12.4 ± 1.6 % 11.4 ± 0.6 % CM with δ13C muscle
daily growth rate (µm.day
-1) 0.4 ± 0.6 ‰ - 15.3 ± 0.3 ‰ - 0.1 ± 0.3 ‰ 10.5 ± 3.5 % Annual average (± S.D.) a a c d b f 10.6 ± 3.7 % 0.1 ± 0.1 ‰ 0.7 ± 0.6 ‰ 100 200 150 300 8 10 12 14 16 18 Temperature (°C) 877.7 mg Chl-a.m-2 511.3 mg Chl-a.m-2 e Total quantity 250 50 0 J F M A M J J A S O N D - 22.4 ± 0.8 ‰ - 21.7 ± 1.1 ‰ - 19.7 ± 0.6 ‰ - 20.6 ± 0.8 ‰ - 21.7 ‰ - 20.9 ± 1.1 ‰ δ13C POM CM with δ13C POM 5.8 ± 2.2 % 7.9 ± 2.7 % 9.2 ± 1.5 % 8.1 ± 0.4 % 7.9 ± 2.4 % Year 2000 2011 2011 2011 2011 2011 2011 2011 2011 c g Ref. 20 15 10 5 0 CM (%)
Table 1: Average carbon isotopic ratio (δ13C) in four scallop tissues (muscle, mantle, gills and digestive gland) and phytoplankton for each treatment, and contribution (in percentage) of metabolic carbon (% CM) in δ13Cshell calculated with δ13Ctissues and δ13Cphytoplankton as 13CR
estimates. All values were calculated when δ13Ctissues was in steady-state with δ13Calgae (from
19 July to 16 August 2011). The sample size is given in brackets.
Tissues δ13C mean ± S.D. (number of samples) % CM mean ± S.D. (number of samples)
Treatment T15 Treatment T21 Treatment T25 Treatment T15 Treatment T21
muscle -37.9 ± 3.4 (15) -37.5 ± 3.0 (15) -36.2 ± 2.6 (15) 6.0 ± 1.3 (4) 6.8 ± 2.5 (5)
mantle -39.3 ± 2.8 (15) -39.7 ± 2.3 (15) -37.3 ± 2.6 (15) 5.9 ± 1.2 (4) 6.4 ± 2.4 (5)
gills -45.0 ± 1.7 (15) -45.5 ± 1.5 (15) -39.8 ± 3.3 (15) 5.1 ± 1.0 (4) 5.5 ± 2.0 (5)
digestive gland -52.5 ± 2.0 (15) -52.1 ± 1.6 (15) -48.1 ± 3.8 (15) 4.3 ± 0.9 (4) 4.8 ± 1.8 (5)