HAL Id: hal-01324409
https://hal.archives-ouvertes.fr/hal-01324409
Submitted on 13 Jul 2018HAL is a multi-disciplinary open access archive for the deposit and dissemination of sci-entific research documents, whether they are pub-lished or not. The documents may come from teaching and research institutions in France or abroad, or from public or private research centers.
L’archive ouverte pluridisciplinaire HAL, est destinée au dépôt et à la diffusion de documents scientifiques de niveau recherche, publiés ou non, émanant des établissements d’enseignement et de recherche français ou étrangers, des laboratoires publics ou privés.
Influence of edge conditions on material ejection from
periodic grooves in laser shock-loaded tin
T. de Rességuier, C. Roland, G. Prudhomme, E. Lescoute, D. Loison, P.
Mercier
To cite this version:
T. de Rességuier, C. Roland, G. Prudhomme, E. Lescoute, D. Loison, et al.. Influence of edge condi-tions on material ejection from periodic grooves in laser shock-loaded tin. Journal of Applied Physics, American Institute of Physics, 2016, 119 (18), �10.1063/1.4949483�. �hal-01324409�
1 Influence of edge conditions on material ejection from periodic grooves
in laser shock-loaded tin
T. de Rességuier1, C. Roland1, G. Prudhomme2, E. Lescoute2, D. Loison3, P. Mercier2
1 Institut PPRIME, UPR 3346, CNRS, ENSMA, Université de Poitiers, 1 ave. Clément Ader,
86961 Futuroscope Cedex, France
2 CEA, DAM, DIF, 91297 Arpajon, France
3 Institut de Physique de Rennes, CNRS, Université de Rennes 1, 35042 Rennes, France
Abstract. In a material subjected to high dynamic compression, the breakout of a shock
wave at a rough free surface can lead to the ejection of high velocity debris. Anticipating the
ballistic properties of such debris is a key safety issue in many applications involving shock
loading, including pyrotechnics and inertial confinement fusion experiments. In this paper,
we use laser driven shocks to investigate particle ejection from calibrated grooves of
micrometric dimensions and approximately sinusoidal profile in tin samples, with various
boundary conditions at the groove edges, including single groove and periodic patterns. Fast
transverse shadowgraphy provides ejection velocities after shock breakout. They are found
to depend not only on the groove depth and wavelength, as predicted theoretically and
already observed in the past, but also, unexpectedly, on the edge conditions, with a jet tip
velocity significantly lower in the case of a single groove than behind a periodic pattern.
PACS 62.50.Ef – High pressure and shock wave effects in solids and liquids PACS 47.40.Nm – Shock-wave interactions and shock effects
2 I. Introduction
When a shock wave propagating in a material subjected to dynamic compression breaks out at
a free surface, it is reflected into a rarefaction wave and the surface undergoes a sharp
acceleration. If the free surface presents geometrical defects such as scratches, pits or grooves,
high velocity debris can be ejected from these defects, ahead of the main surface. Distinct
defects may generate thin jets (which is sometimes referred to as microjetting) while a global
roughness can lead to the expansion of a cloud of fine particles (sometimes called material
ejection). Because this cloud may disrupt surface diagnostics used in shock physics (velocity
interferometry, pyrometry, reflectivity) and because the impact of the ejecta can cause severe
damage to nearby equipment in practical, engineering applications, this process has been widely
studied both theoretically and experimentally under impact or explosive loading [1-13]. In a
recent paper, we used laser driven shock loading to investigate microjetting from triangular,
individual grooves of micrometric dimensions in several metals, both below and above
shock-induced melting [14]. In particular, transverse shadowgraphy allowed measuring jet tip
velocities over a range of experimental conditions. Then the question arose whether such
velocities might be different in the case of periodic grooves, more representative of machined
or rolled surfaces of practical interest, i.e. would depend on the boundary conditions at the
groove edges. Here, we report further laser shock experiments on tin samples with calibrated
grooves of approximately sinusoidal shape and different edge conditions. They show
unambiguously that ejection velocity does depend on these edge conditions, with clear
differences between single groove and periodic pattern, and even between small and high
3 II. Experimental techniques
Samples were cut from (rolled) tin foils of high purity (99.99%) and 230 µm-thickness,
with grain size ranging from about 40 µm to about 200 µm. Their surface was polished to
mirror-like finish, then straight grooves of approximately sinusoidal profile were engraved by
laser ablation. Groove depth 2h (peak to valley) was either 10 µm or 18 µm, controlled by
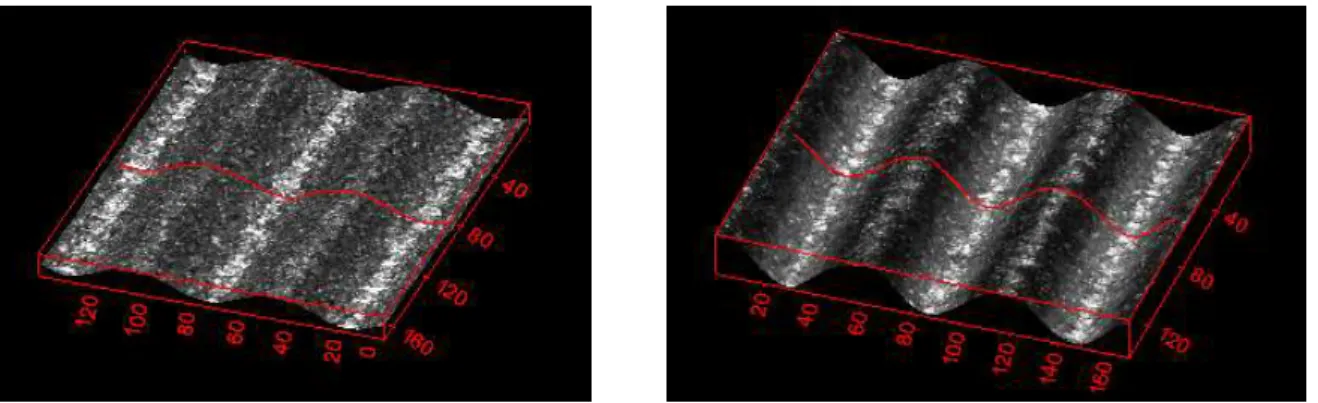
three-dimensional optical microscopy (Fig. 1). For both depths, two types of targets were prepared:
(i) regular periodic pattern of 17 parallel grooves, with an intergroove wavelength λ=58 µm
(Fig. 2a), and (ii) three zone-pattern with 3 grooves, 1 groove and 20 grooves, with the same
wavelength of 58 µm (Fig. 2b). A dimensionless parameter widely used to characterize such
periodic geometry and to model subsequent ejection dynamics is the product kh = 2πh / λ. Here,
the kh products are 0.5 and 1 for 10 µm-deep and 18 µm-deep grooves, respectively.
Fig. 1. Three-dimensional reconstruction from optical microscopy of the sinusoidal grooves
engraved in the surface of tin samples, with depths of 10 µm (left) and 18 µm (right). Scales
4
(a) (b)
Fig. 2. Scanning electron micrographs of grooved surfaces with a single periodic pattern (a),
with a closer view in the inset, and a three zone-pattern (b). Transverse shadowgraphy will be
performed along the horizontal direction.
The experiments were performed in the LULI2000 facility of the Laboratoire pour
l’Utilisation des Lasers Intenses (LULI, UMR 7605, France). A high power laser pulse of
1.055 µm-wavelength, 3.4 ns-duration, about 700 J-energy, was focused on a 3.1 mm-diameter
spot opposite to the grooved surface (Fig. 3). The resulting intensity was about 2.8×10¹² W/cm².
The sample was set in secondary vacuum to avoid laser breakdown in air. A thin layer of
material is ablated into a plasma cloud, which expansion toward the laser source drives by
reaction a short compressive pulse onto the loaded spot. The amplitude Pload, about 86 GPa, and
temporal profile of this pulse were inferred at each shot from one-dimensional (1D)
computations of laser-matter interaction with the ESTHER hydrocode [15], using the measured
profile of laser intensity as input condition, and assuming spatial uniformity of the laser energy
distribution over the irradiated spot. The compression front rapidly steepens into a shock wave
followed by gradual release, so that the pressure profile becomes roughly triangular (load
(A)
(B)
(C) 1 mm
5 usually referred to as unsupported shock) and peak pressure decays with propagation distance
(Fig. 4). Shock breakout pressure PSB after propagation throughout the sample thickness was
inferred from the same 1D computations, since radial release waves from the periphery of the
loaded spot do not affect wave propagation during this transit. 2D effects inside the grooves,
over the last 10 or 18 µm before breakout, were neglected. In the shots reported here, PSB = 30.4
GPa ± 1.1 GPa. It is higher than the threshold pressure of about 20 GPa above which tin starts
melting upon release [16, 6], so that ejection processes upon shock breakout are expected to
occur in a mixed solid-liquid state.
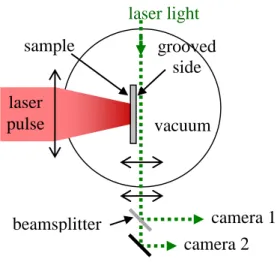
Fast transverse shadowgraphy provides sequences of quasi-instantaneous images of
material ejection behind the grooved free surface, using two high speed cameras and a wedge
beamsplitter as depicted in Fig. 3. Illumination is supplied by a continuous laser of 527
nm-wavelength, divided by a wedge beamsplitter, and four images are recorded by two high speed
cameras with different delay times (two images each), which allows to reduce, adapt and control
the interframe time at each shot. Short exposure times of 5 ns ensure minimum motion blur
(typically 10 µm for a particle travelling at 2 km/s). Images are 1360×1024 pixels with
equivalent size of 3.5 µm/pixel. All velocity values mentioned next are derived from initial
positions and four successive positions recorded at times 250, 500, 850 and 1100 ns after the
laser shot (see Appendix). Error bars in these values, essentially due to uncertainties in
determining the positions of the diffuse fronts in the pictures, are estimated to about ± 3 %. All
measured velocities are found to be constant within experimental uncertainty, which is
6 Fig. 3. Schematic of the experimental setup. Grooves in the sample free surface are parallel to
the laser probe direction (vertical dotted line).
Fig. 4. One-dimensional simulation of laser shock loading for a 2.79 TW/cm² laser intensity
(inset), showing the evolution of the pressure pulse with increasing propagation distance from
the irradiated surface (bold numbers). Shortly before shock breakout, 30 µm-deep beneath the
grooved surface, peak pressure has decayed down to 32 GPa and the pulse duration at half
maximum is about 10 ns. 0 20 40 60 80 100 0 10 20 30 40 50 60 70 80 pre ss ure ( G P a) time (ns) 10 ns 14 µm 50 µm 100 µm 150 µm 200 µm laser light sample vacuum laser pulse camera 1 grooved side camera 2 beamsplitter 0 1 2 3 0 2 4 6 las er i nt ens it y ( T W /cm ²) time (ns)
7 III. Experimental results
Fig. 5 shows three frames recorded behind the regular pattern of 18 µm-deep grooves
(kh = 1), opposite to the centre of the loaded spot. A seemingly continuous cloud is observed to
expand from this central pattern with a front velocity Vj(18) = 3.70 km/s. Outside this grooved
zone, the smooth, planar surface is seen to break up into a slower, diffuse front which is typical
of the cloud of droplets (sometimes called microspall) resulting from dynamic fragmentation
of the liquid metal over a thick layer beneath the free surface, about 40 µm-thick in our loading
conditions, where the reflected rarefaction wave interacts with the incident unloading wave
[17-19]. The measured velocities of this initially smooth free surface are VFS = 1.88 km/s ± 50 m/s
in all shots reported in this paper. They are fully consistent with the 1D computations and PSB
values mentioned above. The correct planarity near the central axis shortly after shock breakout
and the overall symmetry assess to some extent the uniformity of the pressure load applied onto
the irradiated spot. Similar images recorded behind the regular pattern of 10 µm-deep grooves
(kh = 0.5) indicate a slower front velocity Vj(10) = 3.22 km/s. Such dependence on the
perturbation geometry is consistent with all previous observations and theoretical expectations
[5-14]. In particular, the velocity values are close to those measured in explosive-loaded tin
with a slightly lower shock breakout pressure of 26.7 GPa, where free surface velocity was 1.85
km/s and jet tip velocities were 2.99 km/s and 3.45 km/s for kh = 0.5 and kh = 1, respectively
[6]. Such consistency is worth noting because both spatial and temporal scales are very different
between both experiments. Thus, sample thickness (230 µm) and diameter of the loaded zone
(3.1 mm) were about 4 mm and several cm, respectively, in Ref. [6]. Besides, in our laser shock
experiments, the pressure pulse emerging at the grooved surface has a width at half maximum
of about 10 ns (Fig. 4), whereas the duration of pressure application in explosive-driven shock
8 by two orders of magnitude. Finally, this longer duration of Taylor shockwave loading also
implies a much slower decaying rate with propagation distance than in the laser-driven shock.
Fig. 5. Shadowgraphs recorded behind the free surface of a 230 µm-thick tin sample subjected
to a laser shock applied onto its left surface (not shown, hidden by the target holder). At the
periphery of the loaded zone, a microspall is seen to expand at about 1.91 km/s from the initially
smooth free surface, while a cloud of faster particles is ejected from the central, periodic pattern
of 18 µm-deep grooves, with a front velocity of 3.70 km/s.
Fig. 6 shows successive shadowgraphs recorded behind the three zone-patterns, with 10
µm-deep grooves (top) and 18 µm-deep grooves (bottom). Distinct particle clouds expand from
each grooved zone, with different tip velocities listed in the figure. Labels (A), (B), (C) refer to
the same three zones as in Fig. 2b. Again, ejection velocity consistently increases with
perturbation amplitude (i.e. groove depth). For a given shot, assuming homogeneous pressure
loading in the central region as inferred from Fig. 5, the only difference between the three zones
is the number of grooves, i.e. the boundary conditions at the edges of the zone. Unexpectedly,
these edge conditions are shown to strongly affect peak ejection velocity, which is significantly
lower for a single defect than for a periodic pattern, and which increases with groove number
to approach the values Vj(10) and Vj(18) reported above for the regular patterns.
3.70 km/s 1.91 km/s
9 Fig. 6. Shadowgraphs recorded behind laser shock-loaded tin samples with a three zone-pattern
engraved in their free surface, for a groove depth of 10 µm (top) or 18 µm (bottom).
IV. Discussion
While ejecta production is known to depend on the loading conditions (i.e. shock
breakout pressure and temporal profile of the drive) and on the geometry (wavelength and
amplitude of surface perturbations), the influence of boundary conditions reported here had
never been evidenced yet. In most phenomenological pictures of material ejection, including
the widely used Richtmyer-Meshkov Instability (RMI) approach [6, 9, 10], the spike raising
from each concave segment (i.e. the bottom of the groove) is fed by matter flowing from the
convex edges, forming bubbles on both sides. Meanwhile, rarefaction waves are induced upon
breakout of the compression front at every free surface, either curved (groove edge) or planar
(Fig. 7). Interactions between these waves cause tension, which will lead to fracture in a solid
sample (as discussed and evidenced in Ref. [14]), or produce cavitation in a liquid metal
[17-19]. Such cavitation is expected to bound the amount of material to be excavated into each jet,
so that this amount would be less in a periodic pattern (Fig. 7a) than in the case of a single 3.09 km/s 2.83 km/s 2.97 km/s 3.66 km/s 2.94 km/s 3.30 km/s (A) (B) (C) (A) (B) (C)
10 groove (Fig. 7b). Assuming a same incoming kinetic energy in both cases, globally transferred
to the ejecta, resulting velocities would then be higher in the periodic case (lower jetted mass)
than behind a single groove, which qualitatively agrees with our observations. The apparent
thickness of the central (single) jet in the pictures, about 200 µm, tends to confirm that ejecta
probably include material flowing from well outside the initial groove (of much smaller width,
about 50 µm). Interestingly, radiographs of ejection from explosive-loaded tin, both proton [6]
and x-rays [10], often exhibit skew “cuts” growing from the edges of the grooved regions
backward into the bulk of the sample, which look very similar to the final picture in Fig. 7b.
Throughout the pulse reflection process, additional contribution of the incident unloading wave
produces further cavitation and “micro-spall” [17-19], not represented in Fig. 7 for clarity.
Finally, in the periodic case, neighbouring jets might interact with each other at later stages,
which might limit transverse expansion and subsequent particle dispersion, and enhance axial
velocity. Logically, the three-groove pattern seems to correspond to an intermediate regime
between the single groove and the fully periodic case.
Fig. 7. Schematic picture of jetting upon shock breakout in the case of a periodic pattern (a) or
a single groove (b). Arrows represent rarefaction waves propagating from free surfaces, either
curved or flat. Their interaction produces cavitation (white dotted lines) which is expected to
bound the mass source (hatched area) to be excavated into the jet.
11 V. Conclusion
High power laser shock experiments on tin samples with various types of approximately
sinusoidal grooves in their free surface have shown that peak ejection velocities depend not
only on the groove depth and aspect ratio (which is consistent with jetting theories and former
experiments) but also on the number of grooves (which was not anticipated). This dependence
has been attributed to boundary effects at the groove edges, which have been qualitatively
discussed in terms of cavitation caused by wave interactions, ejected mass, kinetic energy, and
possible interactions between adjacent jets. Although edge effects on material ejection were
evidenced under explosive loading in the past, their influence on jet tip velocity has not been
clearly observed in such conditions yet. Thus, further work is still needed for a full
characterization and a quantitative interpretation of these edge effects. Finally, those laser shock
experiments involving periodic, approximately sinusoidal perturbations and shock-induced
melting should be directly comparable with theoretical predictions based on the RMI approach.
Acknowledgements
The access to the LULI facility was allocated by the Institut Laser Plasma (ILP, FR # 2707).
We thank all the LULI staff for technical support, as well as Patrick Combis and Laurent Videau
(CEA Arpajon) for providing the ESTHER code.
Appendix : analysis of the shadowgraphs
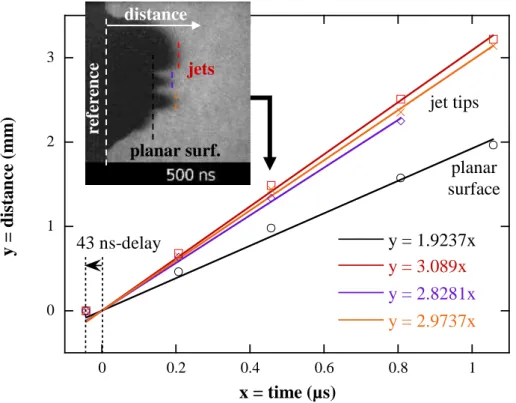
In the raw images recorded behind the sample surface at successive delay times (e.g. Fig. 5 and
6), the positions of all fronts (planar surface and jet tips) were determined in pixels, converted
to mm, then plotted versus time (Fig. 8), taking into account the transit time of 43 ns, inferred
from the simulations, between laser shot (camera trigger) and shock breakout (beginning of
12 the time of observation, was used as a fixed reference for both cameras. The velocities were
derived from a linear fit (forced to pass through the origin) of the front positions (Fig. 8).
Fig. 8. Example of velocity determination from the shadowgraphs (shot shown in Fig. 6, top).
References
[1] J. R. Asay, L. P. Mix and F. Perry, Ejection of material from shocked surfaces, Appl.
Phys. Lett. 29, 284, 1976.
[2] P. Andriot, P. Chapron and R. Olive, Ejection of material from shocked surfaces of tin,
tantalum and lead-alloys, AIP Conf. Proc. 78, pp. 505-508, 1981.
[3] D.S. Sorenson, R.W. Minich, J.L. Romero, T.W. Tunnell and R.M. Malone, Ejecta
particle size distributions for shock loaded Sn and Al metals, J. Appl. Phys. 92(10), 5830,
2002. 0 1 2 3 0 0.2 0.4 0.6 0.8 1 y = 1.9237x y = 3.089x y = 2.8281x y = 2.9737x y = di st a n ce ( m m ) x = time (µs) jet tips planar surface 43 ns-delay re fe re n ce planar surf. jets distance
13 [4] M. B. Zellner, J. E. Hammerberg, R. S. Hixson, K. B. Morley, A. W. Obst, R. T. Olson,
J. R. Payton, P. A. Rigg, W. T. Buttler, M. Grover, G. S. Macrum, G. D. Stevens, W.
D. Turley, L. Veeser, A. J. Iverson and N. Routley, Effects of shock-breakout pressure
on ejection of micron-scale material from shocked tin surfaces, J. Appl. Phys. 102,
013522, 2007.
[5] M.B. Zellner, W. Vogan McNeil, J.E. Hammerberg, R.S. Hixson, A.W. Obst, R.T.
Olson, J.R. Payton, P.A. Rigg, N. Routley, G.D. Stevens, W.D. Turley, L. Veeser and
W.T. Buttler, Probing the underlying physics of ejecta production from shocked Sn
samples, J. Appl. Phys. 103, 123502, 2008.
[6] W.T. Buttler, D.M. Oro, D.L. Preston, K.O. Mikaelian, F.J. Cherne, R.S. Hixson, F.G.
Mariam, C. Morris, J.B. Stone, G. Terrones and D. Tupa, Unstable Richtmyer-Meshkov
growth of solid and liquid metals in vacuum, J. Fluid Mech. 703, pp. 60-84, 2012.
[7] O. Durand and L. Soulard, Large-scale molecular dynamics study of jet breakup and
ejecta production from shock-loaded copper with a hybrid method, J. Appl. Phys. 111,
044901, 2012.
[8] J.L. Shao, P. Wang, A.M. He, S.Q. Duan and C.S. Qin, Atomistic simulations of
shock-induced microjet from a grooved aluminium surface, J. Appl. Phys. 113, 153501, 2013.
[9] G. Dimonte, G. Terrones, F.J. Cherne and P. Ramaprabhu, Ejecta source model based
on the nonlinear Richtmyer-Meshkov instability, J. Appl. Phys. 113, 024905, 2013.
[10] S.K. Monfared, D.M. Oro, M. Grover, J. E. Hammerberg, B.M. LaLone, C.L. Pack,
M.M. Schauer, G.D. Stevens, J.B. Stone, W.D. Turley and W.T. Buttler, Experimental
observations on the links between surface perturbation parameters and shock-induced mass ejection, J. Appl. Phys. 116, 063504, 2014.
[11] S.K. Monfared, W.T. Buttler, D.K. Frayer, M. Grover, B.M. LaLone, G.D. Stevens, J.B.
14
scattering in high explosive driven shockwave experiments, J. Appl. Phys. 117, 223105,
2015.
[12] O. Durand and L. Soulard, Mass-velocity and size-velocity distributions of ejecta cloud
from shock-loaded tin surface using atomistic simulations, J. Appl. Phys. 117, 165903,
2015.
[13] F.J. Cherne, J.E. Hammerberg, M.J. Andrews, V. Karkhanis and P. Ramaprabhu, On
shock driven jetting of liquid from non-sinusoidal surfaces into a vacuum, J. Appl. Phys.
118, 185901, 2015.
[14] T. de Rességuier, E. Lescoute, A. Sollier, G. Prudhomme, P. Mercier, Microjetting from
grooved surfaces in metallic samples subjected to laser driven shocks, J. Appl. Phys.
115, 043525, 2014.
[15] J. F. Colombier, P. Combis, F. Bonneau, R. Le Harzic, and E. Audouard, Hydrodynamic
simulations of metal ablation by femtosecond laser irradiation, Phys. Rev. B 71, 165406,
2005.
[16] C. Mabire and P.L. Hereil, Shock-induced polymorphic transition and melting of tin,
AIP Conf. Proc. 505, pp. 93-96, 2000.
[17] T. de Rességuier, L. Signor, A. Dragon, M. Boustie, G. Roy, F. Llorca, Experimental
investigation of liquid spall in laser shock-loaded tin, J. Appl. Phys. 101, 013506, 2007.
[18] T. de Rességuier, L. Signor, A. Dragon, M. Boustie, L. Berthe, On the dynamic
fragmentation of laser shock-melted tin, Appl. Phys. Lett. 92, 131910, 2008.
[19] D. Loison, T. de Rességuier, A. Dragon, P. Mercier, J. Bénier, G. Deloison, E. Lescoute,
A. Sollier, Skew Photonic Doppler Velocimetry to investigate the expansion of a cloud
of droplets created by micro-spalling of laser shock-melted metal foils, J. Appl. Phys.