HAL Id: hal-00302199
https://hal.archives-ouvertes.fr/hal-00302199
Submitted on 12 Oct 2006HAL is a multi-disciplinary open access
archive for the deposit and dissemination of sci-entific research documents, whether they are pub-lished or not. The documents may come from teaching and research institutions in France or abroad, or from public or private research centers.
L’archive ouverte pluridisciplinaire HAL, est destinée au dépôt et à la diffusion de documents scientifiques de niveau recherche, publiés ou non, émanant des établissements d’enseignement et de recherche français ou étrangers, des laboratoires publics ou privés.
Performance of Chemical Ionization Reaction
Time-of-Flight Mass Spectrometry (CIR-TOF-MS) for
the measurement of atmospherically significant
oxygenated volatile organic compounds
K. P. Wyche, R. S. Blake, A. M. Ellis, P. S. Monks, T. Brauers, R.
Koppmann, E. Apel
To cite this version:
K. P. Wyche, R. S. Blake, A. M. Ellis, P. S. Monks, T. Brauers, et al.. Performance of Chemical Ionization Reaction Time-of-Flight Mass Spectrometry (CIR-TOF-MS) for the measurement of atmo-spherically significant oxygenated volatile organic compounds. Atmospheric Chemistry and Physics Discussions, European Geosciences Union, 2006, 6 (5), pp.10247-10274. �hal-00302199�
ACPD
6, 10247–10274, 2006 Measurement of atmospherically significant oxygenated volatile organic compounds K. P. Wyche et al. Title Page Abstract Introduction Conclusions References Tables Figures J I J I Back Close Full Screen / EscPrinter-friendly Version Interactive Discussion
Atmos. Chem. Phys. Discuss., 6, 10247–10274, 2006 www.atmos-chem-phys-discuss.net/6/10247/2006/ © Author(s) 2006. This work is licensed
under a Creative Commons License.
Atmospheric Chemistry and Physics Discussions
Performance of Chemical Ionization
Reaction Time-of-Flight Mass
Spectrometry (CIR-TOF-MS) for the
measurement of atmospherically
significant oxygenated volatile organic
compounds
K. P. Wyche1, R. S. Blake1, A. M. Ellis1, P. S. Monks1, T. Brauers2, R. Koppmann2,*, and E. Apel3
1
Department of Chemistry, University of Leicester, Leicester, UK
2
Institut f ¨ur Chemie und Dynamik der Geosph ¨are II, Forschungszentrum J ¨ulich, J ¨ulich, Germany
3
National Centre for Atmospheric Research, Boulder, CO, USA
*
now at: Bergische Universit ¨at Wuppertal, Fachbereich C, Atmosph ¨arenphysik, Wuppertal, Germany
Received: 25 September 2006 – Accepted: 10 October 2006 – Published: 12 October 2006 Correspondence to: P. S. Monks (p.s.monks@le.ac.uk)
ACPD
6, 10247–10274, 2006 Measurement of atmospherically significant oxygenated volatile organic compounds K. P. Wyche et al. Title Page Abstract Introduction Conclusions References Tables Figures J I J I Back Close Full Screen / EscPrinter-friendly Version Interactive Discussion
Abstract
The performance of a new chemical ionization reaction time-of-flight mass spectrom-eter (CIR-TOF-MS) utilising the environment chamber SAPHIR (Simulation of Atmo-spheric Photochemistry In a large Reaction Chamber – Forschungzentrum J ¨ulich, Ger-many) is described. The work took place as part of the ACCENT (Atmospheric
Com-5
position and Change the European NeTwork for excellence) supported oxygenated volatile organic compound (OVOC) measurement intercomparison during January 2005. The experiment entailed the measurement of 14 different atmospherically sig-nificant OVOCs at various mixing ratios in the approximate range 10.0–0.6 ppbV. The CIR-TOF-MS operated throughout the exercise with the hydronium ion (H3O+) as the
10
primary chemical ionization (CI) reagent in order to facilitate proton transfer to the an-alyte OVOCs. The results show the CIR time-of-flight mass spectrometer is capable of detecting a wide range of atmospheric OVOCs down to sub-ppbV mixing ratios with high accuracy and precision. It is demonstrated that the technique has rapid multi-channel response at the required sensitivity, accuracy and precision for atmospheric
15
OVOC measurements.
1 Introduction
Oxygenated volatile organic compounds (OVOCs) are ubiquitous in the troposphere (Singh et al., 1995). They have both primary and secondary sources, being emitted by anthropogenic and biogenic processes, as well as being formed from the gas-phase
20
oxidation of parent hydrocarbons. OVOCs exist in the atmosphere at trace levels in the parts per trillion to parts per billion (by volume) range and are key players in many atmospheric processes from the production of tropospheric ozone (Monks, 2005) to secondary organic aerosol formation (Kalberer et al., 2004).
Current methods for measuring OVOCs and VOCs (volatile organic compounds)
in-25
ab-ACPD
6, 10247–10274, 2006 Measurement of atmospherically significant oxygenated volatile organic compounds K. P. Wyche et al. Title Page Abstract Introduction Conclusions References Tables Figures J I J I Back Close Full Screen / EscPrinter-friendly Version Interactive Discussion
sorption spectroscopy (DOAS) (e.g. Sinreich et al., 2005) and more recently proton transfer reaction mass spectrometry (PTR-MS) (e.g. Lindinger et al., 1993; Warneke et al., 2001). The modus operandi of PTR-MS is the chemical ionization, by proton transfer, of a gas sample inside a drift tube. The fixed length of the drift tube provides a fixed reaction time for the ions as they pass along the tube: the reaction time can
5
be measured or it can be calculated from ion transport properties. If the proton donor is present in large excess over the acceptor molecules, then a measurement of the ratio of donor/protonated acceptor ion signals allows the concentration of the acceptor molecules to be calculated. The PTR-MS method allows fast real-time measurements of a range of VOCs in air including OVOCs. On-line methods offer a new dimension to
10
VOC analysis as they can begin to assess the rapid fluctuations in concentration with time.
In conventional PTR-MS, the mass spectrometer has been a quadrupole (e.g. War-necke et al., 2001) or more recently an ion-trap (WarWar-necke et al., 2005). Our group (Blake et al., 2003) demonstrated the first PTR-MS system using TOF-MS. More
re-15
cently Ennis et al. (2005) and Inomota et al. (2006) have developed similar systems. TOF-MS comes into its own when dealing with complex mixtures since an entire spec-trum is, in effect, captured in an instant. Furthermore, there is no upper mass limit and the standard resolution in TOF-MS is usually far higher than in quadrupole mass spec-trometers. These characteristics confer a number of potentially important advantages
20
for the analysis of complex mixtures. More recently, PTR-TOF-MS has been gener-alised to include other chemical ionization reagents, such as NO+ and O+2 (Wyche et al., 2005; Blake et al., 2006). Consequently, this more general technique has been referred to as chemical ionization reaction mass spectrometry, or CIR-MS for short.
A number of extensive intercomparison exercises have been carried out for the
mea-25
surement of non-methane hydrocarbons (NMHCs) (e.g. Apel et al., 2003; Plass-D ¨ulmer et al., 2006, and references therein). The aim of these intercomparison campaigns have been to assess the accuracy and comparability of NMHC measurements from groups around the globe. Many of these exercises have concentrated on varying
multi-ACPD
6, 10247–10274, 2006 Measurement of atmospherically significant oxygenated volatile organic compounds K. P. Wyche et al. Title Page Abstract Introduction Conclusions References Tables Figures J I J I Back Close Full Screen / EscPrinter-friendly Version Interactive Discussion
component mixtures and canister sampling of ambient air, looking at non-oxygenated hydrocarbons. These comparisons have been useful in highlighting a wide range of sampling and analytical problems. However, to date there have been no similar exer-cises for OVOCs, which present a particular analytical challenge owing to their polar nature and the potential for interference from various sampling artefacts (e.g. Northway
5
et al., 2004).
As part of the ACCENT QA/QC project (see http://www.accent-network.org), an OVOC comparison exercise was organised in January 2005 (Koppmann et al., 20061). Fourteen atmospherically significant OVOC species were selected for intercomparison including aldehydes, ketones and alcohols, of both biogenic and anthropogenic origin
10
(see Table 1). Two NMHC compounds (n-butane and toluene) were also included in the study to act as tracers in order to monitor the dilution of the chamber air, with toluene specifically chosen for the benefit of PTR-MS instruments, which are unable to detect short chain alkanes. The experiment used a large atmospheric simulation chamber as the sample reservoir, giving the ability to alter sample matrix, humidity and ambient
15
ozone levels.
This paper details the results, performance and validation of a real-time sampling chemical ionization reaction time-of-flight mass spectrometry system, operating in the proton transfer mode for the determination of OVOC concentrations. As will be de-scribed, this study demonstrates that CIR-TOF-MS is a highly effective tool for
quan-20
tifying a multitude of OVOCs with good time resolution. This is an important finding which provides a firm foundation for the real-time analysis of OVOCs in complex trace gas mixtures such as atmospheric air. The multi-institution comparison is the subject of another paper (Koppmann et al., 20061).
1
Koppmann, R., Brauers, T., Bossmeyer, J., et al.: Intercomparison of Oxygenated Volatile Organic Compounds (OVOC) Measurements, in preparation, 2006.
ACPD
6, 10247–10274, 2006 Measurement of atmospherically significant oxygenated volatile organic compounds K. P. Wyche et al. Title Page Abstract Introduction Conclusions References Tables Figures J I J I Back Close Full Screen / EscPrinter-friendly Version Interactive Discussion
2 Experimental
2.1 The CIR-TOF-MS instrument
The chemical ionisation reaction time-of-flight mass spectrometer used in this work has been described in detail elsewhere (Wyche et al., 2005; Blake et al., 2006), hence only a brief account is provided here. The instrument comprises a radioactive ion source,
5
an analyte gas inlet and a drift cell region coupled to an orthogonal time-of-flight mass spectrometer equipped with reflectron array. Operating in proton transfer mode, water vapor was delivered to the ion source by bubbling N2 carrier gas (purity grade 7.0) through a glass vessel containing high purity deionized water (15 MΩ) at a total flow rate of 52 sccm. The sample gas containing the OVOCs was delivered from the
cham-10
ber to the drift cell at a flow rate of 275 sccm via a common insulated glass manifold and a 2 m long Teflon tube, heated to 40◦C. The combined reagent and sample gas flows provided a drift cell operational pressure of 8 mbar and with a potential gradient of 2700 V applied along the cell an E/N ratio (where E is the electric field and N is the gas number density) of ∼165 Td was achieved, where 1 Td=10−17V cm2. For the
15
duration of the OVOC intercomparison all mass spectra were recorded for an averaging period of 60 s and over the mass range 0–143 Da.
2.2 The OVOC intercomparison experimental design
The SAPHIR smog chamber in which the intercomparison experiments were con-ducted is an outdoor facility consisting of a double-lined cylindrical bag constructed
20
from FEP Teflon, with a wall thickness of 150 µm and a volume of 270 m3 (20 m in length with a diameter of 5 m) (Karl et al., 2004). The surface area to volume ratio in SAPHIR (0.88 m−1) is relatively small when compared to other environment chambers, allowing wall effects to be minimized. The chamber bag is held by a large metal frame incorporating a staged series of louvers that shield the sample gas matrix from solar
25
ACPD
6, 10247–10274, 2006 Measurement of atmospherically significant oxygenated volatile organic compounds K. P. Wyche et al. Title Page Abstract Introduction Conclusions References Tables Figures J I J I Back Close Full Screen / EscPrinter-friendly Version Interactive Discussion
pressure and temperature; the facility employs no internal heating system.
For the intercomparison experiments, trace gas delivery to the chamber took place via syringe injection of the liquid OVOCs2 into a heated injector port, which facilitated their volatilisation before entry into the bag. Total time for OVOC injection was of the order of 1 h. Once inside the chamber, all gases were mixed by a series of
mechan-5
ical fans with chamber characterisation suggesting a minimum mixing time of 30 min required in order for the sample matrix to become homogeneous. The precision of OVOC addition via this method is at best 20% (Wegener and Holzke, personal com-munication, 2004).
Ozone used in chamber experiments was supplied from a silent discharge ozonator
10
held under pure O2in order to reduce possible impurities and contamination. Chamber humidification was facilitated by vaporising (Dampf-O-Mat) ultra pure deionised water (Milli-Q, Millipore), through which a continuous stream of high purity nitrogen (purity grade 7.0) was passed to remove dissolved trace impurities.
The OVOC measurement intercomparison exercise was designed such that four
15
main experiments would be conducted, each approximately a single day in duration. The conditions of the synthetic air sample matrix were varied between experiments in order to explore the effects of humidity and ozone on the ability of the instruments to reliably monitor the target compounds. The details of conditions employed during each experiment were as follows:
20
– Experiment 1 (Chamber blank): Dry synthetic air (N2:O2 ratio of 80:20, purity grade 7.0) followed by humidification (approximately 80–90%) and ozone addition (approximately 50 ppbV). No OVOC injection.
– Experiment 2: Target OVOCs sampled from a dry synthetic air matrix. No
humid-ification or ozone addition.
25
– Experiment 3: Target OVOCs sampled from a moist synthetic air matrix (relative
2
ACPD
6, 10247–10274, 2006 Measurement of atmospherically significant oxygenated volatile organic compounds K. P. Wyche et al. Title Page Abstract Introduction Conclusions References Tables Figures J I J I Back Close Full Screen / EscPrinter-friendly Version Interactive Discussion
humidity 60–100%). No ozone addition.
– Experiment 4: Target OVOCs sampled from a moist synthetic air matrix (relative
humidity 50–80%) containing approximately 40–50 ppbV ozone.
All experiments were conducted under dark conditions with the louvers closed.
In order to allow the instruments to measure the OVOCs at various mixing ratios,
5
the synthetic air sample matrix was diluted twice during each day. Consequently, each experiment was composed of three individual sub-experiments termed A, B and C, during which the OVOCs were sampled at mixing ratios of roughly 6–10, 2–3 and 0.6– 1 ppbV, respectively (for example, see Fig. 1). Because of constraints imposed by SAPHIR and the minimum sampling time required by some instruments present, the
10
minimum length of each sub-experiment was set to 3 h. The total length of each daily experimental period was of the order of 12 h.
During each experiment chamber relative humidity was monitored using a frost point hygrometer (General Eastern model Hygro M4) and ozone concentrations were mea-sured “on-line” (ca. 90 s) through UV absorption (Ansyco O341M). In order to maintain
15
a given relative humidity and ozone mixing ratio throughout the entire day and hence to account for the effects of dilution, compensation injections were made during the flushing phases between sub-experiments. Ozone and OVOC concentrations and ex-periment duration were all designed to be sufficiently low to ensure that ozonolysis reactions, and hence loss of susceptible OVOCs, would be insignificant.
20
2.3 Calibration
In order to facilitate absolute quantification of OVOCs detected during the intercom-parison experiments, the CIR-TOF-MS was calibrated using three separate multi-component gas mixtures containing compounds of known concentration (Air Environ-mental, Inc., courtesy of University of Bristol, UK and Paul Scherrer Institut, Ch.). Two
25
separate phases of calibration were conducted, first of all during and then subsequently after the intercomparison, from which an instrument sensitivity was determined for each
ACPD
6, 10247–10274, 2006 Measurement of atmospherically significant oxygenated volatile organic compounds K. P. Wyche et al. Title Page Abstract Introduction Conclusions References Tables Figures J I J I Back Close Full Screen / EscPrinter-friendly Version Interactive Discussion
of the target OVOCs, excluding acetic acid methyl ester for which no calibration stan-dard was available.
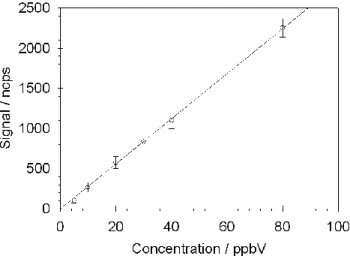
As an example, Fig. 2 shows a methanol calibration curve acquired by the CIR-TOF-MS. The data presented therein has been normalised to 106 primary reagent ion counts and the instrument background signal has been subtracted. One-minute
5
precision during calibration was of the order 5–30% over the mixing ratio range 80– 5 ppbV. These values are typical for OVOC calibration of the CIR-TOF-MS.
Following Warneke et al. (2001), the instrument sensitivity is defined as the number of ion counts acquired by the instrument, following normalisation of the entire mass scan to 106primary CI reagent ion counts per second per ppbV (units: ncps ppbV−1),
10
of each test compound under inspection (under a given, constant set of measurement conditions), viz:
Sensitivity = (Norm. MH
+ counts per second)
(Concentration of M in ppbV) (1)
With knowledge of the reaction kinetics inside the drift cell, e.g. reaction rate constant, time and fragmentation behaviour, it is possible to determine an instrument sensitivity
15
for a given compound, without an experimentally derived calibration curve. With no such experimentally derived sensitivity value available for the quantification of acetic acid methyl ester, a theoretical sensitivity was calculated using the steady state ap-proximation in Eq. (2). Equation (2) can be derived from Reaction (R1) assuming that the proton transfer reaction obeys pseudo first order conditions:
20
i (MH+) ≈ i (H3O+)0[M]kt (2)
H3O++ M → MH++ H2O (R1)
In Eq. (2), i (MH+) = normalised protonated analyte ion signal (ncps), i(H3O+)0 = normalised hydronium signal (106 counts per second), [M] = analyte concentration (molecule cm−3), k= proton transfer rate constant (cm3molecule−1s−1) and t= reac-tion time (s) (e.g. Blake et al., 2003; Hansel et al., 1995).
ACPD
6, 10247–10274, 2006 Measurement of atmospherically significant oxygenated volatile organic compounds K. P. Wyche et al. Title Page Abstract Introduction Conclusions References Tables Figures J I J I Back Close Full Screen / EscPrinter-friendly Version Interactive Discussion
3 Results and discussion
3.1 Preliminary observations
All mass scans recorded during the intercomparison exercise have been normalised to 106H3O+ ion counts and have been processed by subtracting an appropriate nor-malised background scan. The resultant residual spectrum therefore contains only
5
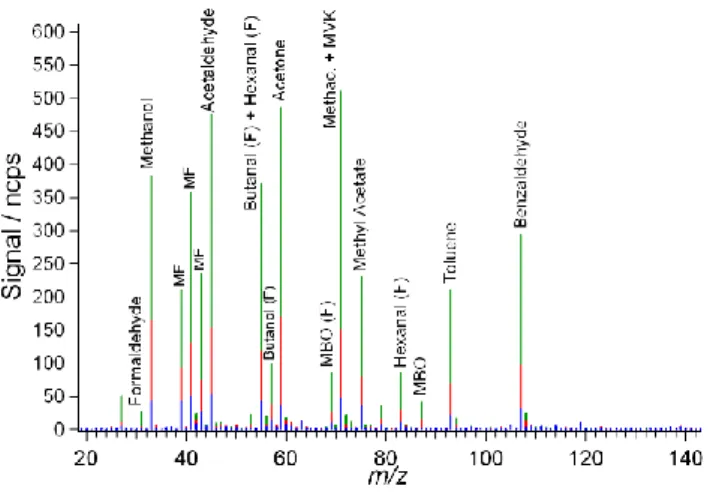
those peaks produced by reaction of H3O+ with the target OVOCs. Figure 3 shows an example mass spectrum from experiment 2, in which the data have been grouped by sub-experiment.
Initial inspection of the spectrum shows the clear presence of 13 out of the 16 in-tercompared compounds, 10 of which were unambiguously observed as protonated
10
parent ion peaks. n-butane was not observed in the mass spectra which was ex-pected given the unfavorable proton affinity. More suprisingly, ethanol was not tected. As subsequent investigations have proven the CIR-TOF-MS is capable of de-tecting ethanol, its absence from all spectra recorded during the OVOC intercompari-son remains unexplained.
15
Figure 3 also shows that along with generation of MH+ ions, a substantial degree of fragmentation occurs in the drift cell, with a further 7 major spectral peaks present owing to the formation of daughter ions. Compound characterization has enabled iden-tification of each fragment peak and has revealed substantial population of mass chan-nels 39, 41 and 43 with daughter ions derived from most carbonyl species (Wyche et
20
al., 2005). The significant fragmentation, and the subsequent spectral congestion, has been attributed to the heightened translational kinetic energies applied to the ions by the drift cell electric field. Under current operating conditions the average centre of mass kinetic energy of the ions in collisions with the neutral molecules is typically of the order 0.32–0.36 eV (Blake et al., 2006).
25
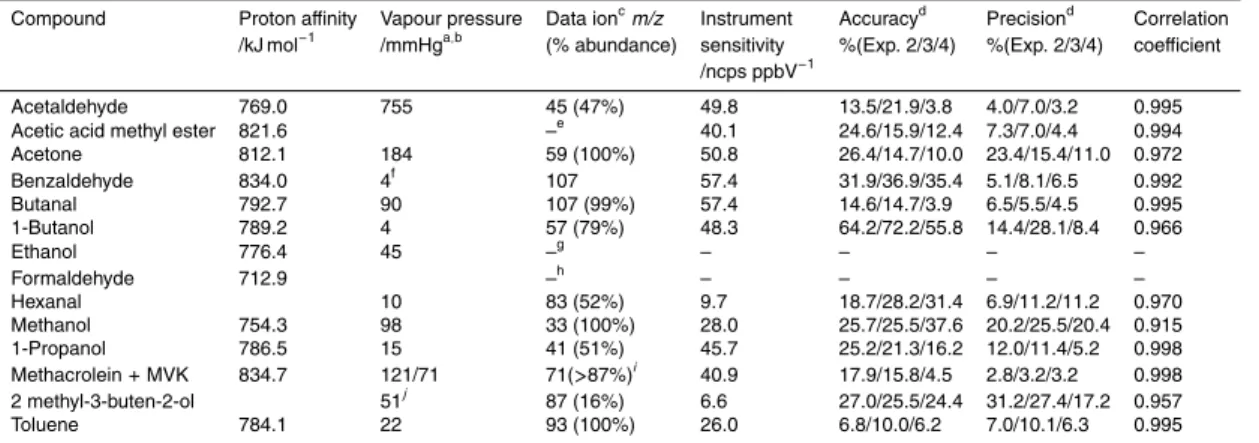
The specific analyte ion used for compound quantification (generally the most abun-dant product), its relative abundance and corresponding sensitivity is listed in Table 1. In the case of butanal (fragment m/z=55) and propanal (fragment m/z=41),
contri-ACPD
6, 10247–10274, 2006 Measurement of atmospherically significant oxygenated volatile organic compounds K. P. Wyche et al. Title Page Abstract Introduction Conclusions References Tables Figures J I J I Back Close Full Screen / EscPrinter-friendly Version Interactive Discussion
butions to the spectral peak from daughter ions of other compounds had first to be removed.
The general observations for experiment 2 also apply to experiments 3 and 4. 3.2 Comparison with chamber values: measurement accuracy, precision and linearity In order to ascertain information regarding the ability of the CIR-TOF-MS to
quantita-5
tively measure the detected OVOCs both reliably and reproducibly, a comparison has been made between measured concentrations and estimated chamber values, which have been determined from knowledge of the amount of liquid OVOC initially injected into SAPHIR and the air dilution rates over time. It should be noted however that such estimated chamber values are not definitive and may vary from the actual ambient
10
concentration of any given OVOC in the chamber at any point by no more than 20%. Effectively, the estimated chamber OVOC concentrations represent an upper limit of the true values (Wegener and Holzke, personal communication, 2004).
For the purpose of comparison between measured and estimated chamber concen-trations, the CIR-TOF-MS data have been integrated over periods of approximately
15
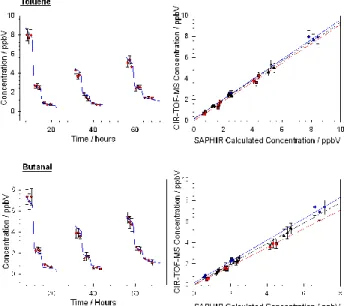
50 min for each sub-experiment, producing three repeat measurements at each con-centration. The only exception to this are the data for all part C sub-experiments, where the integration time was approximately 90 min. Figure 4 shows such a comparison for toluene and butanal, in which measured concentrations are displayed as red points with error bars and chamber values are shown with a blue line. Close inspection of
20
Fig. 4 reveals that there is a small slope in the OVOC concentration profile throughout each measuring period owing to dilution as the chamber is kept at a constant pressure. Corresponding correlation plots for experiments 2, 3 and 4 for both toluene and butanal are also given in Fig. 4.
Table 1 shows the accuracies, precisions and correlation coefficients that have been
25
obtained for each of the detected compounds (excluding formaldehyde, a special case discussed later). In this instance we define the compound specific instrument accuracy as the modulus of the percentage excursion of the CIR-TOF-MS measured
concentra-ACPD
6, 10247–10274, 2006 Measurement of atmospherically significant oxygenated volatile organic compounds K. P. Wyche et al. Title Page Abstract Introduction Conclusions References Tables Figures J I J I Back Close Full Screen / EscPrinter-friendly Version Interactive Discussion
tion from the estimated chamber value, simply calculated from the ratio of the former to the latter. The precision values quoted here have been calculated from the ratio of the standard error of the mean in a given data set of repeats to that of the specific mean value. Again the resultant figure is expressed as a percentage. All values have been averaged over the nine measurements taken during the three sub-experiments of
5
a single day. Correlation coefficients (r2) are given as an average over experiments 2, 3 and 4.
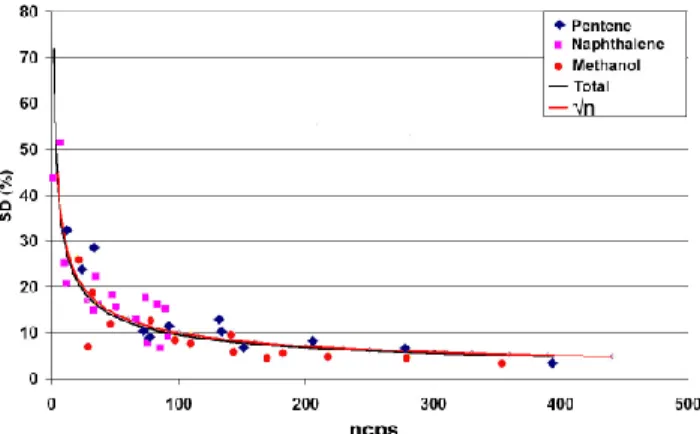
Ion count rates for the target OVOCs, integrated over a specific time period as de-tailed above, had a good signal-to-noise ratio (S/N)3, generally far in excess of 3:1 (the usual criterion employed in order to determine whether a signal is discernable). The
10
compound specific S/N ratios presented by the OVOC peaks shown in Fig. 3 for sub-experiments A, B and C lay within the ranges 17–270, 19–178 and 3–50, respectively. These values were typical across all experiments. It is worth noting, as shown in Fig. 5, that the data have an inherent√n dependence with respect to the standard deviation
of the count rate with decreasing signal count.
15
Generally, most species were measured by the CIR-TOF-MS with an average accu-racy of around 25% or better, with the compounds acetaldehyde, butanal and toluene consistently measured with the greatest accuracy throughout the exercise. Particu-larly high measurement accuracies were achieved for these three compounds during all part A sub-experiments, where values were on average 5.5% for mixing ratios of the
20
order ≈10 ppbV.
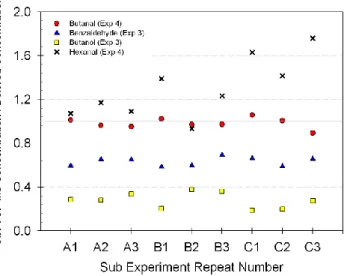
Of the 14 compounds detected, hexanal, 1-butanol and benzaldehyde proved the most difficult to monitor with respect to accuracy. The data in Fig. 6 suggests that the poor accuracy values achieved for hexanal could be attributed to an inadequate esti-mation of the instrument base line. Figure 5 shows an increase in the ratio of measured
25
to estimated chamber concentrations as the chamber air was diluted, which tends to imply that data extracted from the hexanal peak at m/z=83 contained a residual, un-known quantity of contamination not fully removed during background subtraction.
3
ACPD
6, 10247–10274, 2006 Measurement of atmospherically significant oxygenated volatile organic compounds K. P. Wyche et al. Title Page Abstract Introduction Conclusions References Tables Figures J I J I Back Close Full Screen / EscPrinter-friendly Version Interactive Discussion
In the case of 1-butanol and benzaldehyde, the CIR-TOF-MS consistently underes-timated the derived chamber concentrations. Figure 6 demonstrates this and verifies a roughly constant percentage difference between calculated values and those mea-sured. Such findings are consistent with the presence of an unknown sink for these compounds on route to detection.
5
Table 1 shows that benzaldehyde and 1-butanol have the lowest vapor pressures of the target compounds (4 mmHg at 45 and 20◦C, respectively), making these the most likely candidates to undergo condensation out of the vapour phase. The possibility of sink/loss via this route is reinforced by consideration of the average ambient tempera-tures throughout the campaign, which were consistently low, in the range −1 to+4◦C.
10
With compound loss not accounted for in the estimated chamber concentrations, de-position in this manner could lead to the poor measurement accuracy obtained in this instance.
As can been seen in Fig. 3 the CIR-TOF-MS, operating in PTR mode, was able to detect only a minor formaldehyde signal. As demonstrated by Hansel et al. (1997),
15
formaldehyde is difficult to measure using the PTR-MS technique. This difficulty results from the kinetics of the proton transfer reaction, the exothermicity of which is relatively low, as is the endothermicity of the backwards reaction between the HCHO.H+ion with the neutral water molecule. As noted by Hansel and co-workers, energy supplied to the reactant ions by the drift cell electric field is sufficiently large to allow loss of the
20
protonated formaldehyde ion via the back reaction, and hence reduce the detected formaldehyde signal. With the CIR-TOF-MS not yet fully characterised for detection of formaldehyde, no values are reported within this work for its accuracy and precision of measurement.
Measurement reproducibility throughout each experiment was generally high, with
25
compound specific instrument precision of the order 10% or better for most species. However, the results for acetone and methanol are an exception to this statement, where the greater scatter can be attributed to minor internal instrument contamination of these species during the intercomparison campaign. Such problems could easily be
ACPD
6, 10247–10274, 2006 Measurement of atmospherically significant oxygenated volatile organic compounds K. P. Wyche et al. Title Page Abstract Introduction Conclusions References Tables Figures J I J I Back Close Full Screen / EscPrinter-friendly Version Interactive Discussion
removed by a better estimation of the instrument baseline at the time of measurement. The CIR-TOF-MS response was found to be strongly linear over the concentration range investigated, with correlation coefficients (r2) ranging between 0.975 and 0.998 for the chosen set of compounds under dry sample conditions.
3.3 Effect of humidity and ozone
5
In proton transfer reaction mass spectrometry compound detection is generally insen-sitive to the presence of water vapour if the compound in question is able to react at a collision-limited rate with hydrated hydronium ions H3O+.(H2O)n, where n≥1, via lig-and switching, dissociative or otherwise. In order to do so the compound in question must possess a proton affinity greater than that of the cluster ion and/or have a
suffi-10
ciently large dipole moment ( ˆSpan ˆel and Smith, 1995; Warneke et al., 2001; Smith and ˆ
Span ˆel, 2000). These are criteria which some of the test compounds do not satisfy. However, with application of a relatively large electric field along the drift cell (and hence a large E/N ratio), the water cluster ion abundance with respect to that of the primary reagent ion is small. In the present experiments (E /N=165 Td) under dry
sam-15
ple conditions the monohydrate yield was typically ∼0.4% of the hydronium ion, which increased to only ∼0.9% when sample humidity was raised to 100%. Correspondingly, little variation was observed in the hydronium abundance between dry and moist condi-tions, with the mean count rate at 100% relative humidity within one standard deviation of that seen during dry sampling.
20
With no significant increase in abundance of cluster species the incorporation of wa-ter vapour into the sample matrix had little effect on the compound specific instrument accuracies when using “dry” instrument sensitivities to facilitate absolute quantification. Additionally no significant detrimental effect was noted in the accuracy and precision of the CIR-TOF-MS system when the test OVOCs were sampled from a matrix
con-25
taining ozone. With sample gas residence time on route to the drift cell of the order of seconds, ozone/surface effects are expected to be minimal.
ACPD
6, 10247–10274, 2006 Measurement of atmospherically significant oxygenated volatile organic compounds K. P. Wyche et al. Title Page Abstract Introduction Conclusions References Tables Figures J I J I Back Close Full Screen / EscPrinter-friendly Version Interactive Discussion
unaffected by sample humidity or ozone, with very similar precision and r2values seen under wet conditions as those obtained during experiment 2 (where no humidification was used). For example, the precision during experiment 3 was of the order 10% and
r2values lay in the range 0.945–0.999 for the various compounds. 3.4 Real-time monitoring and time-of-flight mass spectrometry
5
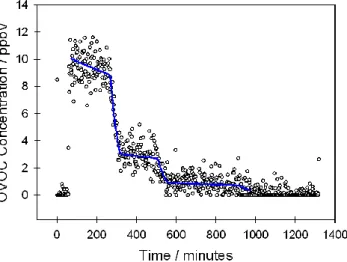
One major advantage of the CIR-TOF-MS technique is its ability to monitor a multi-tude of trace compounds in real-time, which we define as time scales of one minute or less. This is exemplified in Fig. 1, which displays the real-time data recorded for acetaldehyde during experiment 2 alongside the estimated chamber concentrations.
As expected the typical signal-to-noise ratio for all one-minute data was substantially
10
lower than the equivalent value achieved following fifty-minute integration, across all values of mixing ratio. For example the one-minute acetaldehyde data recorded during experiment 2 possessed S/N ratios of 8:1, 5:1 and 4:1 at concentrations of around 10, 3 and 1 ppbV, respectively. With the exception of hexanal and MBO, for which sensitivities were considerably low, one-minute data for all compounds were recorded
15
with S/N ratios in excess of 3 for both sub-experiments A and B.
During sub-experiment 2A, where mixing ratios were of the order of 10 ppbV, average one-minute accuracy for acetaldehyde over the entire three-hour period was exception-ally good at 12.5%, comparing remarkably well with the fifty-minute data. One-minute precision was also comparable, at 15.4%.
20
However, as the chamber air was diluted and mixing ratios decreased, accuracy and precision both fell. In the case of acetaldehyde, accuracy and precision val-ues were 32.4% and 66.7% for experiment 2B and 37.7% and 76.3% for sub-experiments 2C.
Combining the benefits of fast reliable data acquisition with time-of-flight mass
spec-25
trometry allows the construction of a highly detailed picture of the sample matrix, in which all mass channels are observed simultaneously, unlike conventional quadrupole
ACPD
6, 10247–10274, 2006 Measurement of atmospherically significant oxygenated volatile organic compounds K. P. Wyche et al. Title Page Abstract Introduction Conclusions References Tables Figures J I J I Back Close Full Screen / EscPrinter-friendly Version Interactive Discussion
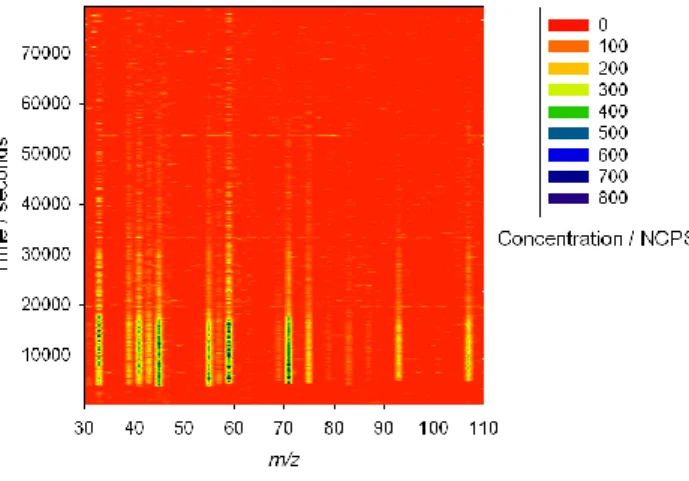
instruments where only a single mass channel is monitored at any instant in time. As a result this technique allows even the most complex and transient events to be mon-itored in high detail. This is exemplified in Fig. 7, which shows the normalised ion count acquired in each mass channel of the CIR-TOF-MS throughout experiment 2 of the intercomparison. Close inspection of Fig. 7 reveals features typical to each of the
5
intercomparison experiments (e.g. see Fig. 1), including three distinct measurement periods and the two dilution events.
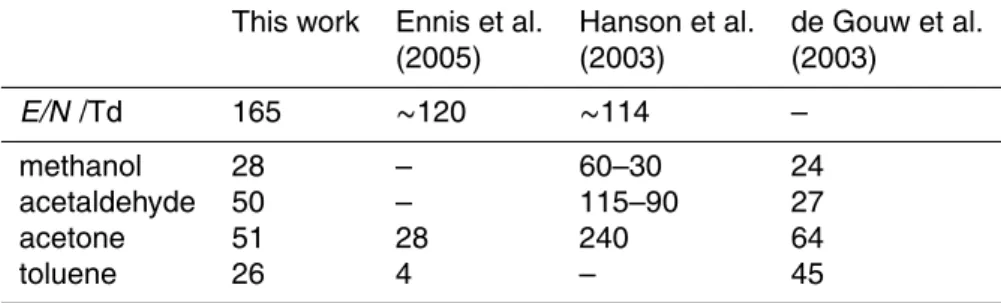
3.5 Sensitivity intercomparison
In order to present a measure of relative instrument performance a brief comparison is made between sensitivities acquired by the CIR-TOF-MS for a number of common
10
atmospheric VOCs with published experimental sensitivities obtained by several other PTR-MS instruments. Included in this comparison are findings by Ennis et al. (2005), Hanson et al. (2003) and de Gouw et al. (2003) for the detection of methanol, ac-etaldehyde, acetone and toluene (see Table 2). The relative normalised sensitivity values given in Table 2 were obtained by the various authors under a range of drift cell
15
conditions (E/N from ∼110–∼165 Td), with each instrument individually optimised for the detection of such trace species.
The CIR-TOF-MS sensitivities for acetone and toluene obtained in this work are significantly larger than those obtained by Ennis and co-workers, who operate a similar time-of-flight instrument (Kore Technology Ltd), which is coupled to a hollow cathode
20
ion source. Our instrument sensitivity also compares favourably with results from de Gouw et al. (2003), obtained during the New England Air Quality Study in 2002, using a conventional discharge ion source/quadrupole device (Ionicon Analytik). The CIR-TOF-MS sensitivity is slightly greater in the cases of methanol and acetaldehyde than was achieved by de Gouw, but slightly lower in the case of acetone and toluene.
25
Sensitivities obtained by the CIR-TOF-MS also compare reasonably with results from the PTR-MS of Hanson et al. (2003), which comprises a similar radioactive ion source which is coupled to a quadrupole mass spectrometer. Results taken from Hanson et
ACPD
6, 10247–10274, 2006 Measurement of atmospherically significant oxygenated volatile organic compounds K. P. Wyche et al. Title Page Abstract Introduction Conclusions References Tables Figures J I J I Back Close Full Screen / EscPrinter-friendly Version Interactive Discussion
al. (2003) (Table 2) are given as a range in order to cover the different sensitivities achieved under various sample humidity values, with the larger sensitivities achieved under less humid conditions. Our (dry) compound sensitivities were around 3–4 times lower than Hanson’s with the major differences being attributed to the higher working pressure of Hanson’s drift tube.
5
4 Conclusions
The data presented demonstrate that chemical ionisation reaction time-of-flight mass spectrometery is capable of providing highly accurate and reproducible measurements of a wide range of atmospherically important OVOCs. The performance with respect to the measurement of a range of OVOCs has been quantified. It has been demonstrated
10
that a time-of-flight device is capable of providing on-line measurements of atmo-spheric trace species, with relative sensitivities entirely comparable to similar commer-cial quadrupole based instruments. The potential benefits of using a TOF based device for atmospheric monitoring are considerable, with the sample matrix being probed in more depth and detail than has been possible previously.
15
Acknowledgements. The EU project ACCENT and the NERC and EPSRC funding councils are
gratefully acknowledged for providing funds to carry out this work. The authors would also like to thank C. Schieferstein, K. Wilkinson and J. Weal for technical support in preparation for the intercomparison campaign.
References
20
Apel, E. C., Calvert, J. G., Gilpin, T. M., Fehsenfeld, F., and Lonneman, W. A.: Nonmethane Hydrocarbon Intercomparison Experiment (NOMHICE): Task 4, ambient air, J. Geophys. Res.-Atmos., 108(D12), 4300, doi:10.1029/2003JD003783, 2003.
ACPD
6, 10247–10274, 2006 Measurement of atmospherically significant oxygenated volatile organic compounds K. P. Wyche et al. Title Page Abstract Introduction Conclusions References Tables Figures J I J I Back Close Full Screen / EscPrinter-friendly Version Interactive Discussion
Blake, R. S., Whyte, C., Hughes, C. O., Ellis, A. M., and Monks, P. S.: Demonstration of proton-transfer reaction time-of-flight mass spectrometry for real-time analysis of trace volatile or-ganic compounds, Analytical Chemistry, 76(13), 3841–3845, 2004.
Blake, R. S., Wyche, K. P., Ellis, A. M., and Monks, P. S.: Chemical ionization reaction time-of-flight mass spectrometry: Multi-reagent analysis for determination of trace gas composition,
5
Int. J. Mass Spectr., 254(1–2), 85–93, 2006.
de Gouw, J. A., Goldan, P. D., Warneke, C., Kuster, W. C., Roberts, J. M., Marchewka, M., Bertman, S. B., Pszenny, A. A. P., and Keene, W. C.: Validation of proton transfer reaction-mass spectrometry (PTR-MS) measurements of gas-phase organic compounds in the at-mosphere during the New England Air Quality Study (NEAQS) in 2002, J. Geophys.
Res.-10
Atmos., 108(D21), 4682, doi:10.1029/2003JD003863, 2003.
Ennis, C. J., Reynolds, J. C., Keely, B. J., and Carpenter, L. J.: A hollow cathode proton transfer reaction time of flight mass spectrometer, Int. J. Mass Spectr., 247(1–3), 72–80, 2005. Hansel, A., Jordan, A., Holzinger, R., Prazeller, P., Vogel, W., and Lindinger, W.: Proton-Transfer
Reaction Mass-Spectrometry – Online Trace Gas-Analysis At The Ppb Level, Int. J. Mass
15
Spectr., 150, 609–619, 1995.
Hansel, A., Singer, W., Wisthaler, A., Schwarzmann, M., and Lindinger, W.: Energy dependen-cies of the proton transfer reactions H3O++ CH2O ⇔ CH2OH++ H2O, Int. J. Mass Spectr.,
167, 697–703, 1997.
Hanson, D. R., Greenberg, J., Henry, B. E., and Kosciuch, E.: Proton transfer reaction mass
20
spectrometry at high drift tube pressure, Int. J. Mass Spectr., 223(1–3), 507–518, 2003. Inomata, S., Tanimoto, H., Aoki, N., Hirokawa, J., and Sadanaga, Y.: A novel discharge source
of hydronium ions for proton transfer reaction ionization: design, characterization, and per-formance, Rapid Communications In Mass Spectrometry, 20, 1025–1029, 2006.
Kalberer, M., Paulsen, D., Sax, M., Steinbacher, M., Dommen, J., Pr `ev ˆot, A. S. H., Fisseha, R.,
25
Weingartner, E., Frankevich, V., Zenobi, R., and Baltensperger, U.: Identification of polymers as major components of atmospheric organic aerosols, Science, 303(5664), 1659–1662, 2004.
Karl, M., Brauers, T., Dorn, H. P., Holland, F., Komenda, M., Poppe, D., Rohrer, F., Rupp, L., Schaub, A., and Wahner, A.: Kinetic Study of the OH-isoprene and O3-isoprene
reac-30
tion in the atmosphere simulation chamber, SAPHIR, Geophys. Res. Lett., 31(5), L05117, doi:10.1029/2003GL019189, 2004.
ACPD
6, 10247–10274, 2006 Measurement of atmospherically significant oxygenated volatile organic compounds K. P. Wyche et al. Title Page Abstract Introduction Conclusions References Tables Figures J I J I Back Close Full Screen / EscPrinter-friendly Version Interactive Discussion
Sources and sinks of acetone, methanol, and acetaldehyde in North Atlantic marine air, Atmos. Chem. Phys., 5, 1963–1974, 2005.
Lindinger, W., Hirber, J., and Paretzke, H.: An Ion/Molecule-Reaction Mass-Spectrometer Used For Online Trace Gas-Analysis, Int. J. Mass Spectr. Ion Processes, 129, 79–88, 1993. Monks, P. S.: Gas-phase radical chemistry in the troposphere, Chem. Soc. Rev., 34(5), 376–
5
395, 2005.
Northway, M. J., de Gouw, J. A., Fahey, D. W., Gao, R. S., Warneke, C., Roberts, J. M., and Flocke, F.: Evaluation of the role of heterogeneous oxidation of alkenes in the detection of atmospheric acetaldehyde, Atmos. Environ., 38(35), 6017–6028, 2004.
Plass-D ¨ulmer, C., Schmidbauer, N., Slemr, J., Slemr, F., and D’Souza, H.: European
hydro-10
carbon intercomparison experiment AMOHA part 4: Canister sampling of ambient air, J. Geophys. Res.-Atmos., 111(D4), D04306, doi:10.1029/2005JD006351, 2006.
Singh, H. B., Kanakidou, M., Crutzen, P. J., and Jacob, D. J.: High-Concentrations And Photo-chemical Fate of Oxygenated Hydrocarbons In The Global Troposphere, Nature, 378(6552), 50–54, 1995.
15
Sinreich, R., Frieß, U., Wagner, T., and Platt, U.: Multi axis differential optical absorption spec-troscopy (MAX-DOAS) of gas and aerosol distributions, Faraday Discuss., 130, 153–164, 2005.
ˆ
Span ˆel, P. and Smith, D.: Reactions of Hydrated Hydronium Ions And Hydrated Hydroxide Ions, With Some Hydrocarbons And Oxygen-Bearing Organic-Molecules, J. Phys. Chem., 99(42),
20
15 551–15 556, 1995. ˆ
Span ˆel, P. and Smith, D.: Influence of water vapour on selected ion flow tube mass spectro-metric analyses of trace gases in humid air and breath, Rapid Communications In Mass Spectrometry, 14(20), 1898–1906, 2000.
Warneke, C., Holzinger, R., Hansel, A., Jordan, A., Lindinger, W., P ¨oschl, U., Williams, J., Hoor,
25
P., Fischer, H., Crutzen, P. J., Scheeren, H. A., and Lelieveld, J.: Isoprene and its oxidation products methyl vinyl ketone, methacrolein, and isoprene related peroxides measured online over the tropical rain forest of Surinam in March 1998, J. Atmos. Chem., 38(2), 167–185, 2001.
Warneke, C., van der Veen, C., Luxembourg, S., de Gouw, J. A., and Kok, A.: Measurements
30
of benzene and toluene in ambient air using proton-transfer-reaction mass spectrometry: calibration, humidity dependence, and field intercomparison, Int. J. Mass Spectr., 207(3), 167–182, 2001.
ACPD
6, 10247–10274, 2006 Measurement of atmospherically significant oxygenated volatile organic compounds K. P. Wyche et al. Title Page Abstract Introduction Conclusions References Tables Figures J I J I Back Close Full Screen / EscPrinter-friendly Version Interactive Discussion
Warneke, C., Kato, S., De Gouw, J. A., Goldan, P. D., Kuster, W. C., Shao, M., Lovejoy, E. R., Fall, R., and Fehsenfeld, F. C.: Online volatile organic compound measurements us-ing a newly developed proton-transfer ion-trap mass spectrometry instrument durus-ing New England Air Quality Study – Intercontinental Transport and Chemical Transformation 2004: Performance, intercomparison, and compound identification, Environ. Sci. Technol., 39(14),
5
5390–5397, 2005.
Wayne, R. P.: Chemical Instrumentation, Oxford, Oxford University Press, 1995.
Wyche, K. P., Blake, R. S., Willis, K. A., Monks, P. S., and Ellis, A. M.: Differentiation of isobaric compounds using chemical ionization reaction mass spectrometry, Rapid Communications In Mass Spectrometry, 19(22), 3356–3362, 2005.
ACPD
6, 10247–10274, 2006 Measurement of atmospherically significant oxygenated volatile organic compounds K. P. Wyche et al. Title Page Abstract Introduction Conclusions References Tables Figures J I J I Back Close Full Screen / EscPrinter-friendly Version Interactive Discussion
Table 1. Physical data and CIR-TOF-MS performance statistics for target compound.
Compound Proton affinity Vapour pressure Data ionc
m/z Instrument Accuracyd Precisiond Correlation
/kJ mol−1 /mmHga,b (% abundance) sensitivity %(Exp. 2/3/4) %(Exp. 2/3/4) coefficient
/ncps ppbV−1
Acetaldehyde 769.0 755 45 (47%) 49.8 13.5/21.9/3.8 4.0/7.0/3.2 0.995
Acetic acid methyl ester 821.6 –e 40.1 24.6/15.9/12.4 7.3/7.0/4.4 0.994
Acetone 812.1 184 59 (100%) 50.8 26.4/14.7/10.0 23.4/15.4/11.0 0.972 Benzaldehyde 834.0 4f 107 57.4 31.9/36.9/35.4 5.1/8.1/6.5 0.992 Butanal 792.7 90 107 (99%) 57.4 14.6/14.7/3.9 6.5/5.5/4.5 0.995 1-Butanol 789.2 4 57 (79%) 48.3 64.2/72.2/55.8 14.4/28.1/8.4 0.966 Ethanol 776.4 45 –g – – – – Formaldehyde 712.9 –h – – – – Hexanal 10 83 (52%) 9.7 18.7/28.2/31.4 6.9/11.2/11.2 0.970 Methanol 754.3 98 33 (100%) 28.0 25.7/25.5/37.6 20.2/25.5/20.4 0.915 1-Propanol 786.5 15 41 (51%) 45.7 25.2/21.3/16.2 12.0/11.4/5.2 0.998 Methacrolein+ MVK 834.7 121/71 71(>87%)i 40.9 17.9/15.8/4.5 2.8/3.2/3.2 0.998 2 methyl-3-buten-2-ol 51j 87 (16%) 6.6 27.0/25.5/24.4 31.2/27.4/17.2 0.957 Toluene 784.1 22 93 (100%) 26.0 6.8/10.0/6.2 7.0/10.1/6.3 0.995 a
Vapor pressures measured at 20◦C unless otherwise noted,bhttp://www.sigmaaldrich.com,
c
Ion employed for compound quantification, value given as a percentage contribution to the total ion count of that compound,dSee text for details,eCalculated sensitivity employed (see text for details),fVapor pressure measured at 45◦C,g Compound not detected, hCompound measurements not reported upon within this paper,iMethacrolein relative abundance 87% and methyl vinyl ketone relative abundance 95%,jVapor pressure measured at 25◦C.
ACPD
6, 10247–10274, 2006 Measurement of atmospherically significant oxygenated volatile organic compounds K. P. Wyche et al. Title Page Abstract Introduction Conclusions References Tables Figures J I J I Back Close Full Screen / EscPrinter-friendly Version Interactive Discussion
Table 2. Sensitivity comparison between four different PTR-MS instruments (all sensitivities are given in ncps/ppbV).
This work Ennis et al. Hanson et al. de Gouw et al.
(2005) (2003) (2003) E/N /Td 165 ∼120 ∼114 – methanol 28 – 60–30 24 acetaldehyde 50 – 115–90 27 acetone 51 28 240 64 toluene 26 4 – 45
ACPD
6, 10247–10274, 2006 Measurement of atmospherically significant oxygenated volatile organic compounds K. P. Wyche et al. Title Page Abstract Introduction Conclusions References Tables Figures J I J I Back Close Full Screen / EscPrinter-friendly Version Interactive Discussion
Fig. 1. Comparison of the CIR-TOF-MS measured concentration of acetaldehyde (circle points) versus time with the estimated chamber concentrations (blue line) during experiment 2.
ACPD
6, 10247–10274, 2006 Measurement of atmospherically significant oxygenated volatile organic compounds K. P. Wyche et al. Title Page Abstract Introduction Conclusions References Tables Figures J I J I Back Close Full Screen / EscPrinter-friendly Version Interactive Discussion
Fig. 2. Typical methanol calibration curve, derived from 10-min data acquisition per calibrant concentration at an E/N of 165 Td. Correlation coefficient (r2)=0.998.
ACPD
6, 10247–10274, 2006 Measurement of atmospherically significant oxygenated volatile organic compounds K. P. Wyche et al. Title Page Abstract Introduction Conclusions References Tables Figures J I J I Back Close Full Screen / EscPrinter-friendly Version Interactive Discussion
Fig. 3. Mass spectra for the OVOCs recorded during experiment 2. Compound names followed by the letter F indicate fragment ions and the identifier MF signifies a mass channel occupied by a number of fragment ions originating from more than one parent compound. Green peaks give data recorded from experiment 2A, red from 2B and blue from 2C (see text for details).
ACPD
6, 10247–10274, 2006 Measurement of atmospherically significant oxygenated volatile organic compounds K. P. Wyche et al. Title Page Abstract Introduction Conclusions References Tables Figures J I J I Back Close Full Screen / EscPrinter-friendly Version Interactive Discussion
Fig. 4. Comparison of CIR-TOF-MS measured concentrations (red circles) with chamber val-ues (blue line) throughout all experiments for toluene and butanal and their corresponding regression plots (In regression plots blue circles= experiment 2, red squares = experiment 3 and black triangles = experiment 4). Correlation (r2) coefficients: toluene 0.993, 0.996 and 0.997, butanal 0.995, 0.995 and 0.996 for experiments 2, 3 and 4.
ACPD
6, 10247–10274, 2006 Measurement of atmospherically significant oxygenated volatile organic compounds K. P. Wyche et al. Title Page Abstract Introduction Conclusions References Tables Figures J I J I Back Close Full Screen / EscPrinter-friendly Version Interactive Discussion
ACPD
6, 10247–10274, 2006 Measurement of atmospherically significant oxygenated volatile organic compounds K. P. Wyche et al. Title Page Abstract Introduction Conclusions References Tables Figures J I J I Back Close Full Screen / EscPrinter-friendly Version Interactive Discussion
Fig. 6. Concentration versus sub-experiment number scatter plot for butanal, benzaldehyde, butanol and hexanal. Experiment sub-number refers to the individual sub-experiment (for ex-ample, A1, A2 and A3 represent the 3 repeat measurements taken for each sub-experiment A) conducted during either experiment 3 or 4 (see legend).
ACPD
6, 10247–10274, 2006 Measurement of atmospherically significant oxygenated volatile organic compounds K. P. Wyche et al. Title Page Abstract Introduction Conclusions References Tables Figures J I J I Back Close Full Screen / EscPrinter-friendly Version Interactive Discussion