HAL Id: hal-03210052
https://hal.archives-ouvertes.fr/hal-03210052
Submitted on 27 Apr 2021
HAL is a multi-disciplinary open access
archive for the deposit and dissemination of
sci-entific research documents, whether they are
pub-lished or not. The documents may come from
teaching and research institutions in France or
abroad, or from public or private research centers.
L’archive ouverte pluridisciplinaire HAL, est
destinée au dépôt et à la diffusion de documents
scientifiques de niveau recherche, publiés ou non,
émanant des établissements d’enseignement et de
recherche français ou étrangers, des laboratoires
publics ou privés.
Distributed under a Creative Commons Attribution - NonCommercial - NoDerivatives| 4.0
Northeastern Kansas Based on Their Elemental
Contents and Strontium Isotopic Signatures
Norbert Clauer, Sam Chaudhuri, Isabelle Techer, René Boutin
To cite this version:
Norbert Clauer, Sam Chaudhuri, Isabelle Techer, René Boutin. Distinction between Natural and
Anthropogenic Contaminants of Atmospheric Precipitates from Northeastern Kansas Based on Their
Elemental Contents and Strontium Isotopic Signatures. Geology, Earth and Marine Sciences, Research
Open World, 2021, 3 (1), pp.2021311. �10.31038/GEMS.2021311�. �hal-03210052�
Introduction
Myriads of complex chemical reactions between vapor-liquid molecules and dust particles of multifarious types of organic and inorganic origin constitute important links in the atmosphere between continental land and ocean mass. The survey of the solute compositions of such wet atmospheric precipitations during successive seasons or years as monitoring experiments is of high practical value to various human issues. In fact, the contents of rain solutes vary temporally and spatially in most cases due to interactions between moisture often of marine source and local nanometer-sized solid particles of natural and/or anthropogenic sources. Much information about these parameters provides sound bases for a critical understanding of the bio-geochemical influences in ecological standings on the continents and in the oceans, often on the basis of anion analyses. In fact, identification and quantification of such interactions in a given temporal and spatial setting helps understand atmospheric responses to changes in continental and oceanic conditions impacted more and more heavily by human activities. Finding the nature
Research Article
Distinction between Natural and Anthropogenic
Contaminants of Atmospheric Precipitates from
Northeastern Kansas Based on Their Elemental
Contents and Strontium Isotopic Signatures
Norbert Clauer1*, Sam Chaudhuri2, Isabelle Techer3 and René Boutin4
1Institut de Physique du Globe, University of Strasbourg (UdS-CNRS), 1 rue Blessig, 67084-Strasbourg, France 2Department of Geology, Kansas State University, Manhattan, Kansas 66506, USA
3Equipe Associée 7352 CHROME, Université de Nîmes, rue du Dr. Georges Salan, 30021 Nîmes, France 4Laboratoire d’Hydrologie et de Géochimie de Strasbourg, (UdS-CNRS), 1 rue Blessig, 67084-Strasbourg, France
*Corresponding author: Dr. Norbert Clauer, Institut de Physique du Globe, University of Strasbourg (UdS-CNRS), 1 rue Blessig, 67084-Strasbourg, France; E-mail:
nclauer@unistra.fr
Received: November 29, 2020; Accepted: December 07, 2020; Published: January 15, 2020
of the chemical imprints of atmospheric rainwaters may, therefore, increase the identification of the contributors influencing and possibly modifying the interactions between solid particles and atmospheric moist. Reconstructing chemical paths of solute atmospheric precipitations remains a challenging task as the components of rain solutes can be, even during a single precipitation event, of multiple sources including sea-spay, a wide variety of land-derived aerosols (fine erosional debris of organic and inorganic origins from land surfaces, cultivated or not), a mix of aerosols from local and regional industrial activity, together with secondary aerosols resulting from reactions in the cloudy atmosphere. In fact, nearly similar chemical and isotopic signatures may correspond to different sources, and different sources may combine to produce the same effects. The main interest, if not the only one, in the selection of specific effects in natural processes should be in the identification of the natural and anthropogenic contributors with as many criteria as possible to identify and evaluate all side impacts. The challenge is then in the identification of specific geochemical signatures that are the keys to shed light on the source or the sources of solutes in diverse atmospheric
Abstract
This study was designed to identify and possibly evaluate the changing occurrence of major pollutants in different atmospheric precipitates (rain, snow and hail) that were collected in northeastern Kansas next to the Konza Prairie Preservation site by analyzing their elemental and Sr isotope compositions. Potential pollutants like the local soils and their clay material, as well as the fly ash of a nearby coal-burning power plant were also analyzed. Positively correlated with K in the analyzed precipitates, the Na contents suggest a supply of fertilizers and/or natural plant organics. Combining the four identified pollutants of the precipitates that is to say the soils, the fly ash, the fertilizers and the plants allows evaluation of their changing contribution during a single precipitation event. The duration of the rain events monitors also the changing contribution of the identified pollutants. Variations of the 87Sr/86Sr ratio from precipitates during lasting events are confirmed by changing distribution patterns of the REEs. In fact, soil minerals contribute
mostly at the beginning of the precipitation events and are replaced progressively by the industrial fly ash that becomes dominant towards the end of the precipitation events, depending on the duration and wind directions. At last not least, the different contaminants are recognizable by changing elemental contributions, REE distribution patterns and 87Sr/86Sr ratios. Their variable occurrence can be followed in the wet solutes, but a strict quantification cannot
be provided due to elemental and isotopic interconnections between the natural and the anthropogenic contributors.
Keywords: Wet precipitates; Major, Trace and rare-earth elemental contents; Sr isotopic compositions; Soil particles; Fly ash from a power plant; Fertilizers; Plant organics;
precipitations over a given region and during a given period of time. Of course, the literature is abundant with documents on the significance of the currently analyzed anions [1,2], as well as on the presence of metals and non-metals, of atmospheric precipitations for the reconstruction of their chemical evolution [3]. In many instances, they have been used to portray the potential sources of the solutes and to contribute to the understanding of elementary fluxes.
However, not speaking about organic aerosols that have been identified often in wet clouds [4], another type of rain components was seldom mentioned in the identification process, for instance the organic remnants of the plants from the Earth surface. In turn, the contours of the components from rain solutes include potentially: (1) sea-spray (and hence sea-derived solutes), (2) continental dust consisting of soil minerals, (3) industrial aerosols including atmospheric condensation products formed from industrial-derived reactants, and (4) various chemical aerosols carried by solid compounds [5]. Therefore, organic pollutants of rainwaters collected in cities [6] or in mountain snow [7] represent apparently additional components that can help identifying and evaluating the degree of natural relative to industrial pollution. However, to the best of our
knowledge, an identification of natural organics deriving strictly from terrestrial plants and contaminating wet precipitations has not been addressed often until now, excluding the organics of the clouds [8] and those integrating dissolved organic carbon [9,10]. Exploring this potential organic contribution is one of the challenges of the present attempt based on elemental contents and Sr isotopic signature from varied local atmospheric precipitates, not including intentionally the anionic components. In fine, another purpose here was the use of less-conventional tools susceptible to balance the supply of varied natural or anthropogenic contaminants of organic or inorganic origin in order to explore another way to analyze wet precipitates than by their anionic compositions. In addition to the major- and trace-element analyses as origin markers, the potentials of rare-earth elements (REEs) and
87Sr/86Sr isotopic ratios were also addressed to decrypt the chemical
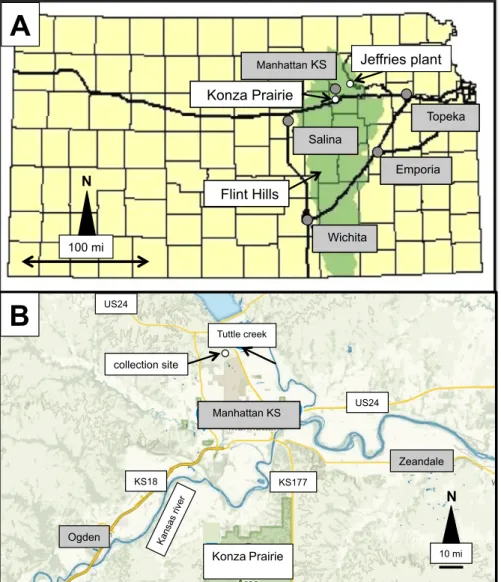
characteristics of atmospheric solutes that were collected over a local area to the NW of the city of Manhattan in eastern Kansas, U.S.A. (Figure 1A). The REE data of rainwaters, for instance, were already used as tracers of natural and anthropogenic pollution [11-14] and were included in studies of continental and oceanic aquatic systems [15]. The sampling of snow, rain and hail precipitates was completed
Jeffries plant Manhattan KS Konza Prairie Salina Topeka Emporia Flint Hills Wichita Manhattan KS Tuttle creek Ogden KonzaPrairie Zeandale collection site
A
B
US24 KS18 KS177 US24 10 mi 100 mi N NFigure 1: (A) The extend of the Flint Hills in Kansas and the locations of the Konza Prairie and the Jeffries power plant with the names of the nearby cities highlighted in grey (modified from
on the site of the Kansas State University at the northwestern part of the city of Manhattan in northeastern Kansas (U.S.A.), not as a long-term monitoring experiment but as a comparative delong-termination of the chemical compositions of precipitate solutes in order to identify the major “contaminants”, natural and anthropogenic, organic and inorganic. This sampling location was chosen because it is close to the Konza National Preservation Site and about 40 km to the SWS of the operational Jeffries coal-powered electric plant of Pottawatomie. The ash rejections of this power plant were also collected and analyzed, as well as soil samples of nearby agricultural fields outside the city of Manhattan. A reason of the location choice is also the nearby occurrence of the Flint Hills that represent a huge natural space that extends from Nebraska to the N to Oklahoma to the S (Figure 1A) as alternating limestones and shales covered by surficial soils, especially along valley cuts. The basement rocks and the associated soils contain large amounts of cherts that rendered difficult crop cultivation, which explains in turn why this regional landscape is mostly covered by grass for cattle ranching [16]. Some land is also farmed next to the Flint Hills, on which the farmers spread fertilizers, another temporary pollutant of the atmosphere and the wet precipitations.
Materials and Methods
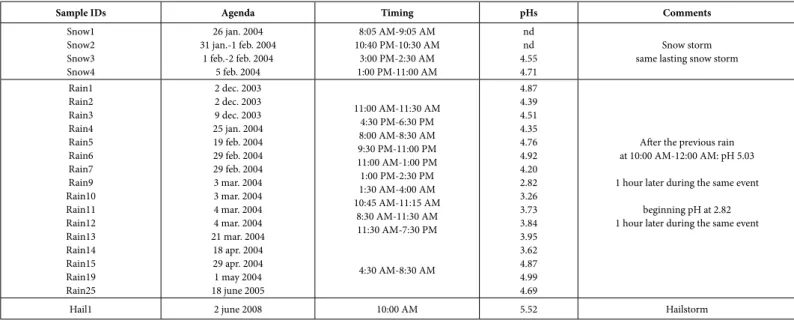
The collection period of the precipitates for the present study started at the end of 2003 until the middle of 2005 with, even, a hail event in June 2008 (Table 1). The successive wet samples were stored after collection in large super-clean polyethylene containers rinsed first with the ambient rainwaters before collection, and were analyzed right after. In the case of the long-lasting rainfalls, individual sets of samples were collected successively and were analyzed (Table 1). The pHs were measured immediately after collection and before analysis. Then, the precipitates were filtered through Gelman 0.4 μm filters and stored in super clean polyethylene bottles that were rinsed with purified nitric acid solution, and several times afterwards with deionized water. An aliquot of each precipitate was pored into a 100 cm3 clean bottle for storage, and the remainder kept in the acidified
state at a pH of approximately 2.5 by adding a few drops of highly purified, vacuum distilled concentrated HNO3 acid. As the rainwaters were filtered at a 0.4 μm cut-off size, it is assumed that the analyses were completed on the total contents of the rain solutes, that is to say on the dissolved compounds and the nanometer-sized solids. A given amount of filtered and acidified rains, snow and hail-melts (generally 1500 to 2000 ml with 15 to 20 ml of highly purified 1.5N HNO3 acid) was transferred into super-clean Teflon© bottles for evaporation to dryness and re-dissolution of the evaporated mass at a known volume. The contents of the major elements were measured by inductively coupled plasma atomic emission spectrometry (ICP-AES) and those of the rare-earth elements were determined by inductively coupled plasma mass spectrometry (ICP-MS). The contents of the other metals were measured either by ICP-MS or ICP-AES, depending on their concentrations. Based on a weakly analysis of the international geo-standards like GL-O and BE-N, the analytical precisions are at a ±3.5% precision level for the concentrations of the major-elements, whereas that of the trace metals is better than ±5% and that of the REEs better than ±10% on the basis of Samuel [17] procedure. The procedural blanks for the analyses were typically below 1%, while the blank solutions were systematically below detection limit. The nanometer-sized solids that could have potentially contaminated the wet precipitations, such as minerals and organics of the local soils and the fly ash released by the coal power plant were also analyzed for their chemical contents and their 87Sr/86Sr ratios. Conversely, due
to the large variety of fertilizers available on the marked [18], which obscures any average composition, this component was deliberately not analyzed, as its composition might not correspond to the local/ regional situation. Alternatively, the contribution of the fertilizers was evaluated by the P contents of the precipitates, based also on the fact that fertilizers from carbonatites yield higher contents of REE, Sr, Ba and Th than fertilizers from phosphorites that are characterized by higher contents of metals, such as Cd, U and As [18]. As for the rainwaters, the major elements of the potential solid contaminants were analyzed following the same sample preparation and analysis
Sample IDs Agenda Timing pHs Comments
Snow1 Snow2 Snow3 Snow4 26 jan. 2004 31 jan.-1 feb. 2004 1 feb.-2 feb. 2004 5 feb. 2004 8:05 AM-9:05 AM 10:40 PM-10:30 AM 3:00 PM-2:30 AM 1:00 PM-11:00 AM nd nd 4.55 4.71 Snow storm same lasting snow storm
Rain1 Rain2 Rain3 Rain4 Rain5 Rain6 Rain7 Rain9 Rain10 Rain11 Rain12 Rain13 Rain14 Rain15 Rain19 Rain25 2 dec. 2003 2 dec. 2003 9 dec. 2003 25 jan. 2004 19 feb. 2004 29 feb. 2004 29 feb. 2004 3 mar. 2004 3 mar. 2004 4 mar. 2004 4 mar. 2004 21 mar. 2004 18 apr. 2004 29 apr. 2004 1 may 2004 18 june 2005 11:00 AM-11:30 AM 4:30 PM-6:30 PM 8:00 AM-8:30 AM 9:30 PM-11:00 PM 11:00 AM-1:00 PM 1:00 PM-2:30 PM 1:30 AM-4:00 AM 10:45 AM-11:15 AM 8:30 AM-11:30 AM 11:30 AM-7:30 PM 4:30 AM-8:30 AM 4.87 4.39 4.51 4.35 4.76 4.92 4.20 2.82 3.26 3.73 3.84 3.95 3.62 4.87 4.99 4.69
After the previous rain at 10:00 AM-12:00 AM: pH 5.03 1 hour later during the same event
beginning pH at 2.82 1 hour later during the same event
Hail1 2 june 2008 10:00 AM 5.52 Hailstorm
by ICP-AES and/or ICP-MS depending on the contents. As stated, the analytical accuracy of the method was controlled routinely by the weekly analysis of the glauconite (GL-O) and basalt (BE-N) international geo-standards. The REE concentrations of the solids and precipitates were normalized relative to either the contents of the Post-Archean Average Shale [19] or compared among each other. The
87Sr/86Sr ratios of the wet precipitates and of two soil samples, their
extracted <2 μm clay fractions and the ash falls were also determined. Approximately 3 to 5 μg of Sr of each liquid and solid sample were separated prior to Sr isotope analysis following a standard ion chromatography procedure on a clean cation-exchange column with double-distilled 2N HCl as the eluent [20]. Total blank Sr was less than 0.5 ng for the entire procedure including filtration, storage and chemical separation. After the column separation, about 1 μg of Sr was loaded onto a Ti filament and analyzed for the 87Sr/86Sr ratio on
a multi-collector mass spectrometer. To compensate for any isotope
fractionation during the isotope measurements, the measured 87Sr/86Sr
ratios were normalized to an 86Sr/88Sr ratio of 0.11940. The external
reproducibility of the 87Sr/86Sr ratio was controlled by periodic analysis
of the NBS 987 standard that provided a mean ratio of 0.710227 ± 0.000017 (2σ of the mean for n = 70) at the time of the study. The internal precision of the 87Sr/86Sr ratio was close to 10 x 10-6 expressed
as 2σ errors. Also to consolidate best the analytical database, the analyses of the soil and fly ash samples were systematically duplicated.
Results
The Chemical Composition of the Solids
The contents of most major elements from soils are significantly different from those of the fly ash (Table 2). Some of these differences can be helpful to distinguish these two major contributors to the precipitates with a Si/Al ratio of the soil samples about 8 times higher
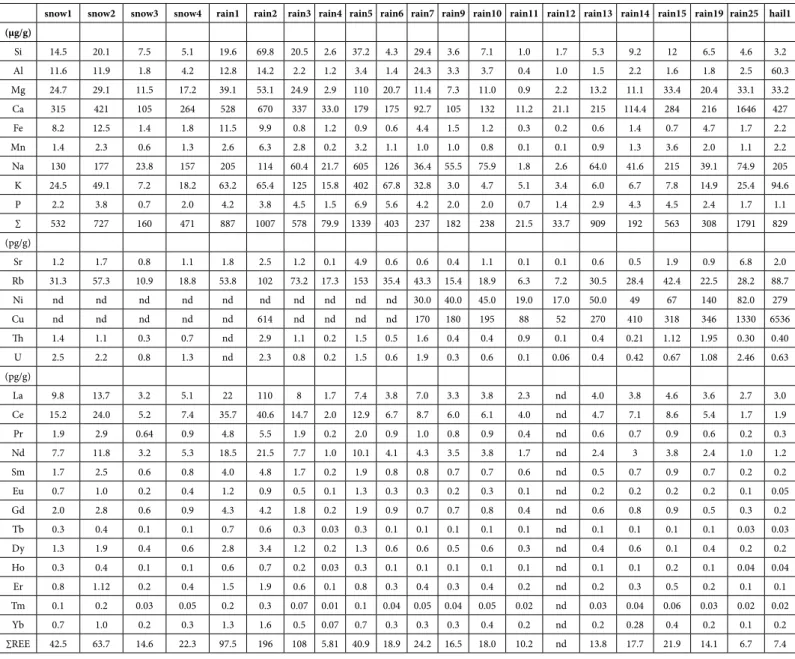
snow1 snow2 snow3 snow4 rain1 rain2 rain3 rain4 rain5 rain6 rain7 rain9 rain10 rain11 rain12 rain13 rain14 rain15 rain19 rain25 hail1 (μg/g) Si 14.5 20.1 7.5 5.1 19.6 69.8 20.5 2.6 37.2 4.3 29.4 3.6 7.1 1.0 1.7 5.3 9.2 12 6.5 4.6 3.2 Al 11.6 11.9 1.8 4.2 12.8 14.2 2.2 1.2 3.4 1.4 24.3 3.3 3.7 0.4 1.0 1.5 2.2 1.6 1.8 2.5 60.3 Mg 24.7 29.1 11.5 17.2 39.1 53.1 24.9 2.9 110 20.7 11.4 7.3 11.0 0.9 2.2 13.2 11.1 33.4 20.4 33.1 33.2 Ca 315 421 105 264 528 670 337 33.0 179 175 92.7 105 132 11.2 21.1 215 114.4 284 216 1646 427 Fe 8.2 12.5 1.4 1.8 11.5 9.9 0.8 1.2 0.9 0.6 4.4 1.5 1.2 0.3 0.2 0.6 1.4 0.7 4.7 1.7 2.2 Mn 1.4 2.3 0.6 1.3 2.6 6.3 2.8 0.2 3.2 1.1 1.0 1.0 0.8 0.1 0.1 0.9 1.3 3.6 2.0 1.1 2.2 Na 130 177 23.8 157 205 114 60.4 21.7 605 126 36.4 55.5 75.9 1.8 2.6 64.0 41.6 215 39.1 74.9 205 K 24.5 49.1 7.2 18.2 63.2 65.4 125 15.8 402 67.8 32.8 3.0 4.7 5.1 3.4 6.0 6.7 7.8 14.9 25.4 94.6 P 2.2 3.8 0.7 2.0 4.2 3.8 4.5 1.5 6.9 5.6 4.2 2.0 2.0 0.7 1.4 2.9 4.3 4.5 2.4 1.7 1.1 ∑ 532 727 160 471 887 1007 578 79.9 1339 403 237 182 238 21.5 33.7 909 192 563 308 1791 829 (pg/g) Sr 1.2 1.7 0.8 1.1 1.8 2.5 1.2 0.1 4.9 0.6 0.6 0.4 1.1 0.1 0.1 0.6 0.5 1.9 0.9 6.8 2.0 Rb 31.3 57.3 10.9 18.8 53.8 102 73.2 17.3 153 35.4 43.3 15.4 18.9 6.3 7.2 30.5 28.4 42.4 22.5 28.2 88.7 Ni nd nd nd nd nd nd nd nd nd nd 30.0 40.0 45.0 19.0 17.0 50.0 49 67 140 82.0 279 Cu nd nd nd nd nd 614 nd nd nd nd 170 180 195 88 52 270 410 318 346 1330 6536 Th 1.4 1.1 0.3 0.7 nd 2.9 1.1 0.2 1.5 0.5 1.6 0.4 0.4 0.9 0.1 0.4 0.21 1.12 1.95 0.30 0.40 U 2.5 2.2 0.8 1.3 nd 2.3 0.8 0.2 1.5 0.6 1.9 0.3 0.6 0.1 0.06 0.4 0.42 0.67 1.08 2.46 0.63 (pg/g) La 9.8 13.7 3.2 5.1 22 110 8 1.7 7.4 3.8 7.0 3.3 3.8 2.3 nd 4.0 3.8 4.6 3.6 2.7 3.0 Ce 15.2 24.0 5.2 7.4 35.7 40.6 14.7 2.0 12.9 6.7 8.7 6.0 6.1 4.0 nd 4.7 7.1 8.6 5.4 1.7 1.9 Pr 1.9 2.9 0.64 0.9 4.8 5.5 1.9 0.2 2.0 0.9 1.0 0.8 0.9 0.4 nd 0.6 0.7 0.9 0.6 0.2 0.3 Nd 7.7 11.8 3.2 5.3 18.5 21.5 7.7 1.0 10.1 4.1 4.3 3.5 3.8 1.7 nd 2.4 3 3.8 2.4 1.0 1.2 Sm 1.7 2.5 0.6 0.8 4.0 4.8 1.7 0.2 1.9 0.8 0.8 0.7 0.7 0.6 nd 0.5 0.7 0.9 0.7 0.2 0.2 Eu 0.7 1.0 0.2 0.4 1.2 0.9 0.5 0.1 1.3 0.3 0.3 0.2 0.3 0.1 nd 0.2 0.2 0.2 0.2 0.1 0.05 Gd 2.0 2.8 0.6 0.9 4.3 4.2 1.8 0.2 1.9 0.9 0.7 0.7 0.8 0.4 nd 0.6 0.8 0.9 0.5 0.3 0.2 Tb 0.3 0.4 0.1 0.1 0.7 0.6 0.3 0.03 0.3 0.1 0.1 0.1 0.1 0.1 nd 0.1 0.1 0.1 0.1 0.03 0.03 Dy 1.3 1.9 0.4 0.6 2.8 3.4 1.2 0.2 1.3 0.6 0.6 0.5 0.6 0.3 nd 0.4 0.6 0.1 0.4 0.2 0.2 Ho 0.3 0.4 0.1 0.1 0.6 0.7 0.2 0.03 0.3 0.1 0.1 0.1 0.1 0.1 nd 0.1 0.1 0.2 0.1 0.04 0.04 Er 0.8 1.12 0.2 0.4 1.5 1.9 0.6 0.1 0.8 0.3 0.4 0.3 0.4 0.2 nd 0.2 0.3 0.5 0.2 0.1 0.1 Tm 0.1 0.2 0.03 0.05 0.2 0.3 0.07 0.01 0.1 0.04 0.05 0.04 0.05 0.02 nd 0.03 0.04 0.06 0.03 0.02 0.02 Yb 0.7 1.0 0.2 0.3 1.3 1.6 0.5 0.07 0.7 0.3 0.3 0.3 0.4 0.2 nd 0.2 0.28 0.4 0.2 0.1 0.2 ∑REE 42.5 63.7 14.6 22.3 97.5 196 108 5.81 40.9 18.9 24.2 16.5 18.0 10.2 nd 13.8 17.7 21.9 14.1 6.7 7.4
Table 2: Major, trace and rare-earth elemental contents of the collected precipitate samples. The contents of the major elements are in μg/g, and those of the trace and rare-earth elements are in
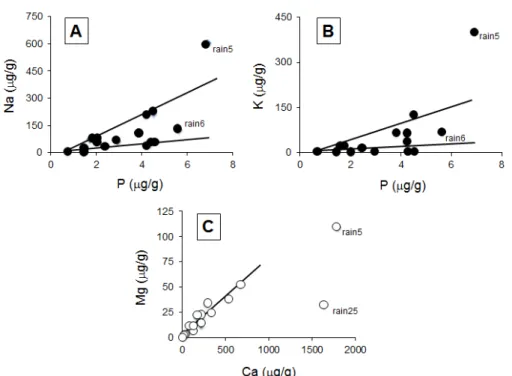
than that of the fly ash, a Si/Mg ratio about 21 times higher, a Si/Ca ratio 30 to 50 times higher, a Si/Fe ratio about 9 times higher, and a Si/P ratio 40 to 50 times higher. The comparison of the major elemental contents of the rain1 and rain2 precipitates with the solid particles that passed the 0.4 μm diameter of the filter pores, with those of the elemental contents of the fly ash show about 2 to 12 times more major oxides in the wet solutes than in the fly ash(Table 3). Some precipitates contain up to 10 times more Si than Al, while others yield 4 times more Si than Al or as much Si as Al (Figure 2A). Others remain with the same Si/Al ratio during the whole length of the event (rain6 and rain7, or rain9 and rain10) unless their Si content increases. As for the Si and Al contents, those of Mg and Ca vary in the precipitates (Figure 2B), but the contents may also remain constant during a single event such as for rain6 and rain7, or for rain1 and rain2, while the ratio Na/K can change from a factor 2 during the event rain6 to rain7, to a factor 22 in rain9 to rain10 episode (Figure 2C). Similar significant
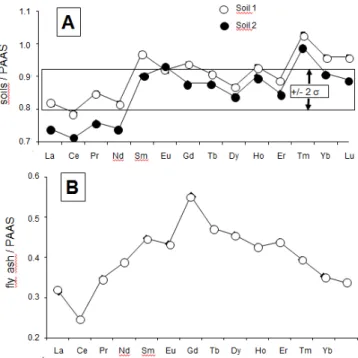
differences are also visible for the trace elements with, for instance, about 7 times more Sr in the fly ash than in the soils or 43 times more Cu (Table 3). The REE contents of the fly ash are about 4 times higher than in the soils, also with different distribution patterns relative to the PAAS reference: that of the soils is irregularly increasing from La to Lu with a somewhat intermediate flat pattern from Sm to Er (Figure 3A). The REE pattern of the fly ash shows also a somewhat strong up and down centered on a positive Eu anomaly.
The pH Values of the Wet Precipitations
Systematically below 5.0 except for the hail1 precipitates, the pH was as low as 2.82 in rain9 (Table 1). Such low values are commonly attributed to industrial effects, primarily to sulfuring acid production from coal-burning sulfur dioxide production [21]. Significant SO4 concentrations represent a complementary lowering impact on pH values of rainwaters (e.g., [22], but as the anion concentrations in the
Sample IDs SiO2 Al2O3 MgO CaO Fe2O3 Mn3O4 TiO2 Na2O K2O P2O5 LoI Total
Soil 1 61.4 9.27 1.52 2.90 3.00 0.08 0.58 0.92 2.39 0.24 17.71 100.0 Soil 1 Duplicate 64.4 10.1 1.76 3.31 3.32 0.09 0.63 0.97 2.51 0.28 11.75 99.12 Soil 2 65.4 9.73 1.44 4.62 3.13 0.07 0.67 1.10 2.48 0.17 11.37 98.73 Soil 2 Duplicate 65.5 10,0 1.48 4.70 3.25 0.07 0.69 0.92 2.46 0.18 9.44 98.73 Fly ash 17,0 20.5 8.53 37.3 6.35 0.03 1.41 2.64 0.35 2.44 3.79 100.3 Fly ash duplicate 17,0 20.8 9.08 37.1 5.99 0.03 1.41 2.32 0.36 2.53 2.21 98.82
Sample IDs Sr Cu Ni Rb Th U Soil 1 266 bdl 66 81.8 8.86 2.53 soil 1 duplicate 286 16.0 30 nd nd nd soil 2 140 17.0 73 nd nd nd soil2 duplicate 141 20.0 42 69.7 9.71 2.85 fly ash 7420 360 144 13.9 34.8 17.4
fly ash duplicate 6670 422 129 nd nd nd
Sample IDs La Ce Pr Nd Sm Eu Gd Tb Dy Ho Er Tm Yb Lu Total
Soil 1 28.1 56.8 6.74 25.0 4.98 1.00 4.09 0.68 3.95 0,90 2.41 0.40 2.56 0.39 138.0 Soil 2 31.3 63.2 7.54 27.7 5.40 1.00 4.38 0.71 4.09 0,93 2.55 0.42 2.72 0.42 156.2 Fly ash 117 198 29.2 114 22.7 6.62 19.7 2.96 16.3 3,57 8.96 1.34 8.25 1.17 549.8 sample IDs 87Sr/86Sr (±2σ) soil 1 soil <2 μm fly ash 0.708607 0.708890 0.712912 11 (10-6) 46 (10-6) 14 (10-6)
Ratios Soil 1 Soil 2 Fly ash
SiO2/Al2O3 SiO2/MgO SiO2/CaO SiO2/Fe2O3 Na2O/K2O SiO2/P2O5 Sr/Ca (10-3) Rb/K (10-3) U/Th 6.62 40.4 21.2 20.5 0.38 256 92.0 34.0 0.29 6.72 45.4 14.2 20.9 0.44 385 31.0 28.0 0.29 0.83 1.99 0.46 2.68 7.54 6.97 199 40.0 0.50
Table 3: 87Sr/86Sr ratios of 5 rainwater samples with some information about the collection day, the timing of the rain event and their pH values.
solutes were not investigated in the present study, this aspect will not be discussed further hereunder. According to a regional correlation between rainwater pHs and the corresponding implemented type of the wet precipitations by [23], the pHs obtained here suggest that 90% of the precipitations are within the “acid rains” category from beginning of the 2000 decade.
The Major Elemental Contents of the Wet Precipitate Solutes
In the Snow Crystals
The contents of the major elements range from 160 to 726 μg/g in the four snow solutes (Table 2). Two samples (snow2 and snow3) were collected successively during the same event with progressively decreasing contents of all major elements. Most elements are also correlated: Si with Al, Na with K and Mg, and Fe with Ca. The fact that P decreases significantly during the progress of the snowfall suggests that some major elements could have originated from fertilizers. The two other snow solutes yield major elemental contents that are systematically between those of snow2 and snow3, often with lower contents of the correlative Si, Al, Fe, Na and K elements. Only Na yields higher contents relative to P for the snow1 and snow4 samples, suggesting a complementary contamination. Sample snow3 yields also the highest Mg/Ca and Sr/Ca ratios, probably resulting from a pronounced decrease in Ca, and the lowest K/Rb ratio due to an even more pronounced decrease in K.
In the Rainwaters
The total contents of the major elements are extremely variable in the rain precipitates: from as low as 21.5 μg/g to as high as 1339 μg/g. In fact, from sixteen analyzed solutes eight yield less than 400 μg/g of solute loads and only three yield more than 1000 μg/g. Most of them contain limited amounts of major elements: less than 2.5 μg/g Al, 5 μg/g Si, 10 μg/g Mg, 2 μg/g Fe, more than 20 μg/g Na and K, and often more than 250 μg/g Ca. This high Ca content is not surprising in a vast region characterized by outcropping Paleozoic carbonate-rich sediments and amended by fertilizers that could be of carbonated type. When two samples were collected during the same rain episode, the Si and Al contents increase systematically when the event lasted, significantly from rain1 to rain2 and from rain6 to rain7 solutes, much less from rain9 to rain10 and from rain11 to rain12 (Figure 2A). Alternatively, the Ca and Mg contents are not significantly modified during the same rain event (Figure 2B), whereas the Na content decreases significantly at least in two cases (Figure 2C). In fact, the decrease of the K and Na contents, together with P, ends close to the intersection of the two coordinates of the diagram in which the correlative contents of both elements are plotted (Figures 4A and 4B). This implies a positive relationship between these three elements, as well as between K and Na when P is absent. In turn, the correlations between P and Na, and P and K suggest that the supplies of Na and K do not originate from a single donor, because the correlation is either driven by high or by low Na and K contents. The correlations between Si and Al, Mg and Ca, and Ca and Fe are similar, as 5 ng/g of Si are detected in the solutes when Al is lacking, Ca of 60 ng/g when Fe is lacking, and Mg of 6 ng/g when Ca is lacking. In the case of the Ca vs. Mg correlation, it looks like there is only one supplier for both, except Figure 2: (A) Si contents of the rain solutes relative to the corresponding Al contents; (B)
Mg contents in the rain solutes relative to Ca contents; (C) K contents in the rain solutes relative to Na contents.
Figure 3: (A) Rare-earth elemental distribution in the soil samples relative to that in the
PAAS reference with the 2σ uncertainty; (B) REE distribution in the fly ash of the power plant relative to that in the PAAS reference; (C) REE distribution in the fly ash of the power plant relative to that in the local soils.
for the rain5 and rain25 samples (Figure 4C).
In the Hail
The Si contents of the hail1 sample are within those of the rain samples and above those of the snow samples. Their Mg and Ca contents are within those of the rain- and snowfalls. Potassium and Na yield both contents on the high side of the results (Table 2).
The Trace Elemental Contents of the Precipitates
The unexpected contents of trace elements from precipitates are those of Cu. Ranging between 52 and 1330 pg/g, they reach even 6536 pg/g in the hail1 sample. With only one hail analysis it is difficult to give any further thought to this high content, but it suggests a periodic and significant Cu pollution (Table 2). A study [24] showed that superphosphate is the fertilizer that contains the highest concentrations of Cd, Co, Cu and Zn impurities. As a matter of fact, all rain solutes, except two, yield far more than 100 pg/g Cu, especially during spring and can be suspected to have been supplied by fertilizers. The Sr, Th and U contents are generally low in the precipitates (Table 3), between 0.1 and 6.8 pg/g of Sr with two values beyond 5 pg/g. Those of Th vary between 0.9 and 2.9 pg/g with two values above 2 pg/g, while those of U vary from 0.1 to 2.5 pg/g with the high contents in the snow samples. The U/Th ratios vary between 1.8 and 2.7 in the snow samples, while only 5 times (less than one third of the sampling) above 2.0 in the rain solutes. The other trace elements were not determined systematically. However the contents of Zn are also very high: as much as 7472 pg/g in the rain2 and 7268 pg/g in the hail1 samples. Also, six Pb analyses appear quite high between 40 and 510 pg/g, half being below 60 and half above 150 pg/g. For Zn and Pb, a contamination by fertilizers can also be suspected on the basis of Gimeno-Garcia et al. study [24].
The Distribution Patterns of the Rare-Earth Elements from
Precipitates
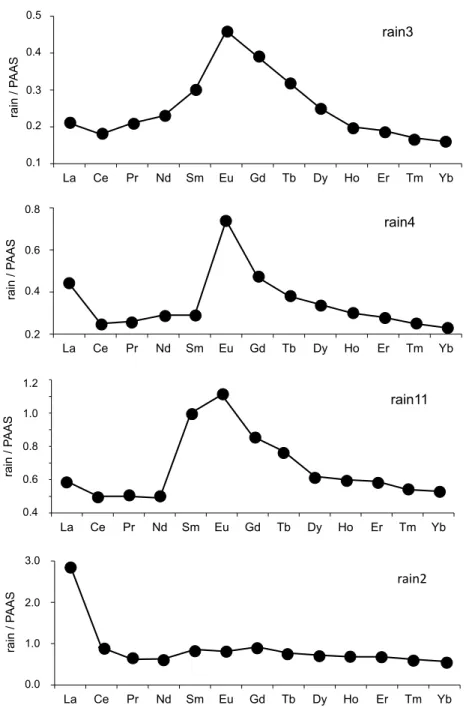
The REE contents of the precipitates were normalized relative to those of the Post-Archean Australian Shales [25] that are often used as a reference for materials from Earth-surface environments. This kind of comparison with the PAAS is visually accurate: those of the PAAS reference yield a higher, however flat distribution relative to the precipitates analyzed here with a fractionation of any of the REEs subsequently detected easily. The REE distribution patterns of the wet solutes were also compared to those of the soil particles and of the fly ash. The reason is that if rain solutes carry soil particles and/or fly ash from power plant, the normalization should theoretically also provide flat distribution patterns. Relative to the PAAS pattern, those of the two soil samples are increasing irregularly from La to Lu (Table 2 and Figure 3A). In a similar pattern, the fly ash outlines a significant positive Eu anomaly with progressively increasing light REEs (LREEs) and decreasing heavy REEs (HREEs; Table 2 and Figure 3B). Relative to that of the PAAS reference, the REE distribution patterns of the 4 snow samples display a flat pattern with a marked positive Eu anomaly. Also, a slight but not significant negative Ce anomaly is visible in some of the samples (Figure 5). In the case of the rain samples, the REE distribution patterns organize into three groups and some individual patterns, relative to the PAAS reference. Those of the rain3, rain6 and rain9 samples are similar to those of the three snow samples with a marked positive Eu anomaly, a slight but not significant Ce anomaly and a Gd content slightly higher than that of Sm, which somehow distorts the pattern (Figure 5). The second group consisting of the rain4, rain7 and rain13 samples is similar to the previous one with a supplementary specific marked positive La anomaly (Figure 5). The next group assembles the rain11, rain14, rain15 and rain19 samples with a similar distribution than those of the samples from previous Figure 4: (A and B) Correlation diagrams based on P vs. Na and K contents, respectively, in the rain solutes; (C) Correlation diagram of Ca relative to Mg contents in the rain solutes.
group and the Gd or Sm contents closer to that of Eu, which gives a rounded top to the positive anomaly (Figure 5). Also the positive La anomaly even if not large is easily detectable. This pattern is very similar to that of sample rain1, whereas those of rain2 and of hail1 are very different: none yields a Eu anomaly but they include a significant positive La anomaly (Figure 5). Sample rain5 has a very straight pattern for most REEs except for the Eu anomaly. The two last rain10 and rain25 samples yield patterns with some unexpected data: the abnormally low Eu content in rain25 gives a unique pattern. The rain10 pattern is distorted by a very high Eu content, a significant negative Ce anomaly and an abnormally high Tb content, which all suggest analytical aspects. Therefore, this last sequence of patterns will not be discussed further hereunder.
The
87Sr/
86Sr Ratios of the Rainwaters
Five rainwater samples were analyzed for their 87Sr/86Sr ratios
(Table 4). The ratios range quite widely from 0.708599 ± 0.000004 (2σ) for rain7 to 0.710278 ± 0.000005 (2σ) for rain12. It has been shown
0.1 0.2 0.3 0.4 0.5 La Ce Pr Nd Sm Eu Gd Tb Dy Ho Er Tm Yb S A AP / ni ar rain3 0.4 0.5 0.6 0.7 0.8 0.9 1 1.1 1.2 La Ce Pr Nd Sm Eu Gd Tb Dy Ho Er Tm Yb S A AP / ni ar rain11 1.2 1.0 0.8 0.6 0.4 0 1 2 3 La Ce Pr Nd Sm Eu Gd Tb Dy Ho Er Tm Yb S A AP / ni ar rain2 3.0 2.0 1.0 0.0 0.5 0.4 0.3 0.2 0.1 0.2 0.4 0.6 0.8 La Ce Pr Nd Sm Eu Gd Tb Dy Ho Er Tm Yb S A AP / ni ar rain4 0.8 0.6 0.4 0.2
Figure 5: Some characteristic rare-earth elemental distribution patterns of rain solutes relative to the PAAS reference.
Sample IDs Dates Timing pHs 87Sr /86Sr (±2σ in 10-6)
Rain7 29 feb. 2004 1:00 PM-2:30 PM 4.20 0.708599 (3.7) Rain9 3 mar. 2004 1:30 AM-4:00 AM 2.82 0.708341 (4.9) Rain10 3 mar. 2004 10:45 AM-11:15 AM 3.26 0.709167 (4.3) Rain11 4 mar. 2004 8:30 AM-11:30 AM 3.73 0.710278 (5.0) Rain12 4 mar. 2004 11:30AM-7:30 PM 3.84 0.709529 (4.7)
Table 4: Table combining the pertinent information on the contaminants, the determining
that rainwaters of successive local events can display quite large ranges of 87Sr/86Sr ratios [26] and that they may vary away from 87Sr/86Sr ratio
of nearby marine waters, as is the case for those analyzed over the French territory that borders an ocean to the W and a large sea to the S [27]. Also, 87Sr/86Sr ratios of rainwaters do not necessarily remain
constant during a single event [28] with values again away from nearby marine sources. Therefore, it looks like the original marine sea-spray can be discarded as a contributing component of the Kansas precipitates. The results suggest rather a changing 87Sr/86Sr ratio with
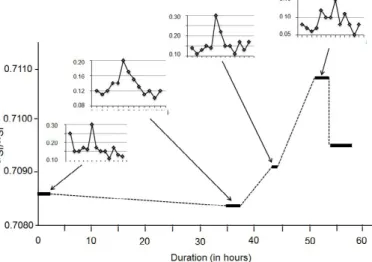
a tendency to increase when the events last, such as in the case of the rain10 and rain12 samples (Figure 6). Conversely, the 87Sr/86Sr ratios of
the land soil (soil 1) and of its <2 μm size fraction are quite constant at 0.708607 ± 0.000011 (2σ) and 0.708890 ± 0.000046 (2σ), respectively. This suggests that the soil supplies to the wet precipitations mostly consists of constant <2 μm sized minerals. As these values are also within those of the rainwaters, most of the soil supply being probably of carbonate origin, unless the supply of fertilizers of carbonated origin predominate. The same ratio of the fly ash is significantly higher at 0.712912 ± 0.000014 (2σ), which is clearly outside the rainwater values, and therefore not a determining argument for an identification of the major contributor to the local precipitates.
Discussion
The relatively monotonous geological and environmental context of the State of Kansas makes that three major contaminants can be suspected to pollute the precipitates collected and analyzed here. These consist of soil particles, fly ash of the power plant and fertilizers spread periodically by the farmers to which plant organics issued from regional tall grass covering most of the Flint Hills may be added and possibly other long-distance materials transported by the winds. Considered are also the chemical components adsorbed on the potentially polluting nanometer-sized soil particles, especially on clays but also soluble carbonate crystals. In fact, while the chemical compositions of the soil particles and the fly ash were detailed, those of the fertilizers and the plant organics were only evaluated on the basis of the P contents and the P/Na, P/K and K/Rb ratios of the precipitates for reasons invoked above. If the collected wet precipitates would be polluted only by fly ash, their REE patterns should be rigorously flat. As this is not the case, it can be stated that the rain solutes
incorporated several components at any time during the precipitation event and often not with the fly ash as the predominant contributor. In the detail, two waters yield a positive anomaly of either Eu in rain5, or of La in the rain2, snow2 and hail1, while rain25 yields both. Positive anomalies of La, Ce and Eu were observed in rain7, rain13, rain14, rain15 and rain19, and snow1, in fact in most studied samples.
The Major Elements of the Rain Solutes
Among the major elements dissolved or dispersed in the wet precipitates, three of the obtained correlations are especially informative: Si vs. Al, Mg vs. Ca and K vs. Na. Various correlations were obtained for the first pair with a coefficient of about 1 during the rain6-rain7 event during which both elements increase simultaneously (Figure 2). Alternatively, Si increased much more than Al in the rain1-rain2 episode with a ratio between 1/1 and 3/1. The final correlation for these two elements is at a ratio of 10/1 in favor of Si. In fact, these correlations point towards a contamination of the local outcropping rock minerals: the 10/1 ratio in favor of Si suggests a quartz contribution, whereas the ratio of 3/1 suggests an occurrence of clay-type particles. On the other hand, the ratio of 1/1 in the precipitates is similar to that of the fly ash with a significant contribution in the sample rain7. Of interest is also the changing Si/Al ratio of the rain1-rain2 event that suggests a change in the pollutants during the same episode. Calcium is positively correlated with Mg in all analyzed precipitates (Figure 4C). Its contents are about 10 to 15 times higher than those of Mg, except for one sample in which its content is up to 50 times that of Mg. As a marine origin of the rain solutes can be discarded, Ca of the wet precipitates derives probably also from regional rock outcrops that are mainly of carbonate composition. The Na vs. K correlation is also systematically positive, with the rain9, rain10, rain11, rain12, rain13, rain14 and rain15 sequence of low contents of K and increasing Na contents. In most of the other precipitates, the content of Na is 1.5 to 3.5 times that of K. Rain5 yields an abnormally high K content with a decrease of either Na in the rain1-rain2 episode, or of both Na and K in that of rain6-rain7, when the event lasts. The high alkali contents, especially that of Na, result most probably from a contribution of dissolved chlorides or sulfates to the solutes. The contents of P in the three types of precipitates, snow, water and hail can certainly be considered as representative of a fertilizer supply, supported in turn
by the high contents in Cu, Zn and Pb. In fact, the contents of P are generally low and quite constant in all precipitates (Table 2), ranging from 0.7 to 3.8 μg/g in the snow samples, from 0.7 to 6.9 μg/g in the rain samples, at 1.1 μg/g in the hail sample. In fact, if fertilizers contaminated significantly the wet precipitations, their contribution was limited to those with the high P contents, probably beyond 4.5-5.0 μg/g, that is to say only in a few rain precipitates such as rain3, rain5, rain6 and rain15.
The Trace Elements in the Rain Solutes
Due to their high contents, some trace elements such as Cu and Ni suggest a predominant contamination by fly ash and fertilizers. Indeed, Cu and Ni occur in extremely high concentrations up to 1330 and 140 pg/g in the rain19 for both and in the hail1 for Ni. It could also be the case in the rain solutes with contents arbitrarily set beyond 200 pg/g, that is to say in the rain2, rain13, rain14, rain15 and rain19. High Cu concentrations in atmospheric concentrates of Ireland were, for instance, related to local mining and smelting activities [29]. These trace-elemental concentrates set a further frame for the recurrent contamination of regional precipitates.
The Signatures of the Rare-Earth Elements
The negative Ce anomaly is very typical for components that originated in marine environments due to oxidation conditions,
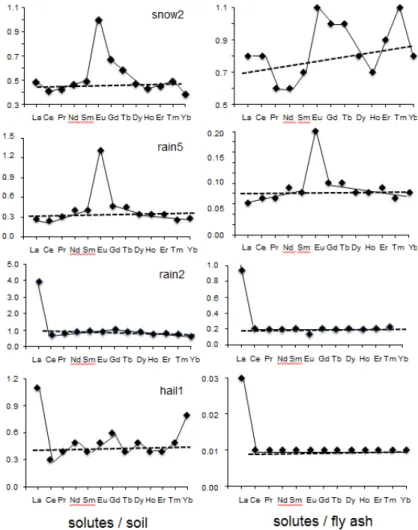
whereas the positive Eu anomaly characterizes usually an impact of feldspar-derived materials, especially of plagioclases, in the mineral world [30,31]. However, it can also result from a diagenetic impact on clay-rich sediments [32]. As a marine supply has not yet been demonstrated on the basis of other data, the reason for the negative Ce remains to be explained. For the Eu anomaly, the presence of nanometer-sized feldspar crystals in the rain solutes can also not be denied, as well as a diagenetic impact in regionally occurring shally sediments. However, the possibility of other soluble contributions to the solutes could be more appropriate. The combined REE patterns of the main potential contributors to the rain solutes, that is to say the soil and fly-ash particles, are quite similar with a negative Ce and a positive Eu anomaly combined with a regular decrease from Gd to Lu (Figure 3C). Suzuki [33] noticed also a Tb positive anomaly with that in Eu in the airborne particulate matter from the Tokyo region, which is not visible here in any of the collected sample. As no determining differences could be evidenced among the distributions, the REE patterns of the precipitates were also compared with those of the soil particles and the fly ash. Among this quite voluminous database, the diagrams of one snow, two rainwaters and the hail were selected to provide more information about the REE patterns of each type of these precipitates (Figure 7). The two diagrams of snow2 are significantly different: that relative to the soil pattern is characterized by a positive Eu anomaly with an almost flat background for most other REEs. This
background is at a precipitation/soil ratio of about 0.2. In the case of the diagram comparing the REE contents of the snow with those of the fly ash, the distribution is more irregular with again a high positive Eu anomaly, but also with a zigzagging increase from light to heavy REEs. The background of the lowest contents remains also quite stable at 0.10 to 0.12 for the comparison with the PAAS. Conversely, the two diagrams of rain5 are somehow similar with a visible positive Eu anomaly, together with increasing LREEs and decreasing HREEs. The differences are in the height of the Eu anomaly of about 1.0 in the case of the rainwater-to-soil comparison and of about 0.1 in that of the rainwater-to-ash comparison. The second difference is in the level of the flat backgrounds of the patterns, which yields an average of 0.3 for the comparison between rain and soil and of 0.8 for the comparison between rain and ash. The rain2 sample yields a different pattern: flat with no Eu anomaly but with a high La anomaly. This abnormally high La content in a few samples raises an analytical problem that relates to the non-correction for Sb-oxide in the analyses by an ICP-MS equipment like is the case here and, in turn, needs to be kept in mind. Therefore, the overall ratio between the rain and the soil as contributor is of 1, while only of 0.2 when ash is the contributor. For the hail, the two patterns relative to the soil and the ash are similar: flat with a significant positive La anomaly and a positive Lu anomaly for the comparison with the soil. As for all other diagrams, the ratios among the solutes and the contributors are up to four times higher than with the ash by comparison with the soil: at 0.04 and 0.01, respectively. No straight interpretation being obvious on the basis of these diagrams, they need to be combined with other parameters such as the metal contents, the timing and duration of the precipitations and the 87Sr/86Sr ratios to sort out the combining contaminants. The
metal contents are especially high in the rain2, rain13, rain14, rain15, and rain19 and in the hail1 that were collected the 2nd of December,
the 21st of March, the 18th of April, the 29th of April, the 1st of May and
the 2nd of June, respectively. In summary, most of the precipitates were
collected during springtime when farmers spray fertilizers on their fields. Also, soil material did probably contribute less to the solutes in wintertime when the ground is frozen, while the nearby power plant is at its highest activity.
The
87Sr/
86Sr Ratios of the Rain Solutes
The long rain event from 29th of February 2004 to the 4th of March
2004 provides an appropriate basis for the interpretation of the
87Sr/86Sr ratio of rain solutes (Figure 6). At the start of the event, the 87Sr/86Sr ratio was of 0.708599 ± 0.000004 (2σ), decreasing slightly to
0.708341 ± 0.000005 about 35 hours later, increasing again to 0.709167 ± 0.000004 about another 10 hours later, continuing to increase at 0.710278 ± 0.000005 about 21 hours later, and ending at a lower 0.709529 ± 0.000005 right after. To be compared to these values are those of the bulk soil at 0.708607 ± 0.000011, of its clay fraction at 0.708890 ± 0.000046, and of the ash fly at 0.712912 ± 0.000014. The bulk rock having the 87Sr/86Sr ratio of the initially collected rainwater,
it was apparently the main or even the sole solid contributor, while ash was progressively added after 35h of rain to reach a maximum supply after about 50h of rain, decreasing afterwards. During this long event, the combined 87Sr/86Sr ratios of the solutes and of the potential
contributors show that soil minerals contributed most at the beginning
of the rain. Later, this natural supply was replaced progressively by released ash until the end of the rain.
The K/Rb Ratio of the Precipitations as the Potential
Contribution of Natural Organics
Before Chaudhuri et al.‘s [34] study, plant-sourced K was not considered as a major contributor in the published models picturing the sources of K in global river [35-37]. This alternative model took into consideration the role of the land plants on the basis of the K/ Rb ratio of all potential contributors. The authors estimated also the amount of K supplied by the vegetables to range between 46 and 68% of the total K contribution to the global river budget, which is significantly more than the 19 to 43% contribution by taking only the weathering of silicate-type rock material into account. On the basis of Chaudhuri et al. [34] calculations, the K/Rb ratio of silicate minerals ranges from 50 to 650, that of plants from 800 to 4,270 and that of fertilizers from 2,700 to 65,000. Here, this ratio is at 786 for the fly ash, at 356 for the soils and between 184 and 2633 for the precipitates. Considering all solutes with K/Rb ratios significantly above the K/Rb ratios attributed to the silicate minerals and the ash, a value of 800 can be viewed as critical to differentiate an organic from a mineral supply. Above 800, the K/Rb ratio of the solutes is then suggesting a contribution of natural plants, while the main contamination becomes as either natural by the silicates from soils or industrial by the rejections from power plant with a value below 800. However, because of the extremely high K/Rb ratios in fertilizers, their contribution cannot be excluded either. In summary, all rain solutes with K/Rb ratios above 800 that is to say in snow2 and snow4, as well as in rain1, rain3, rain4, rain5, rain6, rain25 and hail1, could have been potentially polluted by plant organics, which is reasonable for a collection site in the Flint Hill area that is extensively covered by tall grass and with winds oriented North to South.
How Can Natural Contaminants Differentiated from
Anthropogenic Releases
The available chemical information does not allow here a quantification of the different supplies, or even a distinction between natural and anthropogenic contamination of the precipitates. In turn, the results need to support an identification of: (1) those elements characterizing the soil materials or the ash particles; (2) the abnormal elemental contents in the solutes; (3) the potential contributions of the organics from soil plants; and (4) the relative impact of the rainfall timing in a seasonal calendar. If one sets the limit between “high” and “low” contents of the major elements from different precipitates at 500 μg/g, two snow samples are on the high side (snow1 and snow2) and two are on the low side (snow3 and snow4). Among the rainwaters, nine (rain4, rain6, rain7, rain9, rain10, rain11, rain12, rain14 and rain19) are on the low side with seven even at the very low side of <250 μg/g, the total amount of major elements in hail1 being on the high side. As the SiO2/Al2O3 ratio of the soil particles at 6.7 is about 8 times higher than that of the fly ash at 0.8, wet precipitates with ratios of about 10 (Figure 2A) can then be considered to be potentially loaded with soil materials (snow3, snow5), whereas those with a ratio of 6 to 7 may be contaminated by fly ash (rain4, rain15). The precipitates with Si/Al ratios at about 1 cannot yet be classified
on the basis of these criteria. The Si/Ca ratio can also be of use as it differentiates soil particles of either carbonate or silicate origin. It amounts here from 14 to 21 in the soil samples, whereas only about 0.5 in the ash. In fact, this ratio is far smaller, between 0.03 and 0.1, in the precipitates which means that there is much more Ca in the atmospheric solutes than in natural silicate and/or ash supplies. Another supplier could then be the carbonate outcrops and not the alluvial soils in and close to the study area, unless the overall mass of the locally used fertilizers is carbonated. In fact, the limestones often build low shelters in the landscape and it is then possible that the rainwaters with very low Si/Ca ratios originated outside the area of the Flint Hills. If one sets the limit of local Ca contribution at 100 μg/g in the precipitates, most of it originated clearly outside the mainly carbonated Flint Hills, which points towards the fertilizers. Another selective ratio for comparing here the potential supplies of natural soil materials and fly ash to the rain solutes combines Na and K. This ratio distinguishes the feldspars from clay materials in the geologic materials and soluble salts from solid silicates. Here the Na/K ratio is at about 0.5 for the soil components and at about 7.5 in the ash. Only the rain3, rain11 and rain12 samples yield a lower Na/K ratio. On the other hand, the snow4 and the rain14 yield Na/K ratios far higher at about 7. The P contents of the soil particles with a Si/P ratio of about 320 are even lower in the ash at about 7, while ranging from 3.5 to 10 in the snow, rain and hail samples, which suggests in turn an ash contribution in most precipitates. On the basis of significantly different K/Rb ratios for soil and ash materials, it can reasonably be considered that another contaminating component might yield K/Rb ratios above a value set at 800. As discussed earlier, such high ratios were identified in plant organics at the Earth surface and in global rivers [31]. However, it might also be remembered that fertilizers can yield very high K/Rb ratios depending on their composition [22]. The pollution of the atmospheric precipitates by either natural or industrial supplies can also be traced by their metal contents. Due to their very different contents in soil and ash particles, Cu and Ni, for instance, support an industrial pollution by the fly ash in the present case. For instance, contents arbitrarily set beyond 200 pg/g that is to say for those in rain2, rain13, rain14 and rain15 can also relate to a contamination by fertilizers. The differences in the REE contribution to the rain solutes are more in the contents than in the distribution
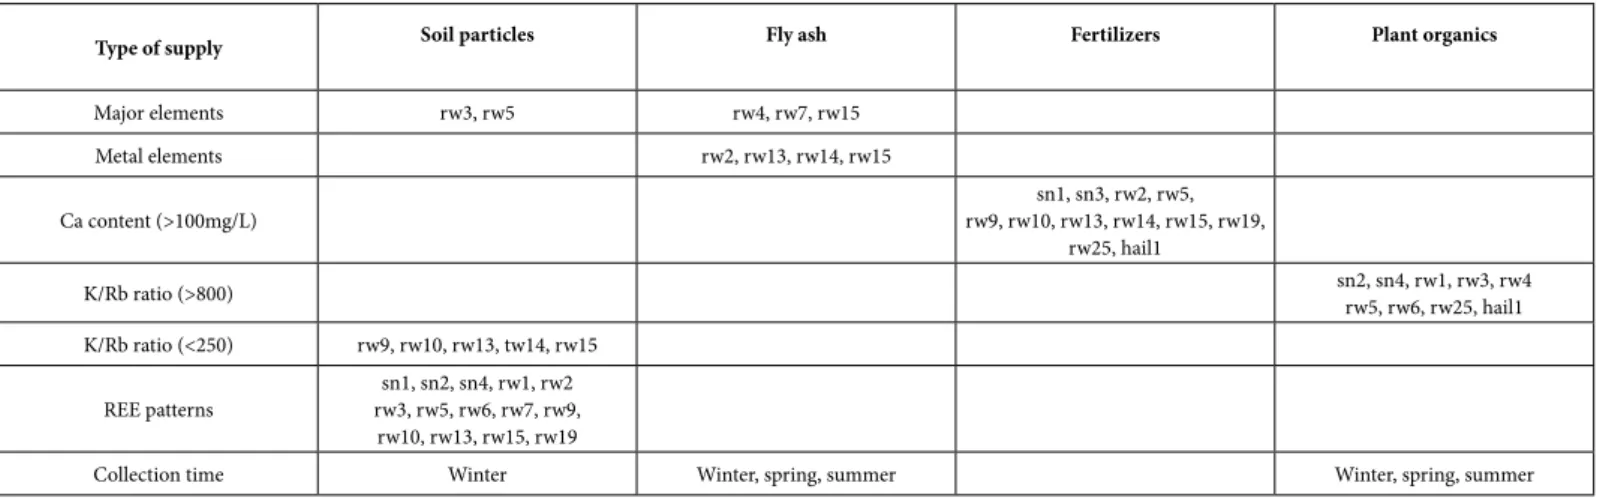
patterns. Indeed, the most characteristic positive anomalies in La and Eu were observed in comparing the REE patterns of the rain solutes and of the potential contributors. The ratios are of 0.04 instead 0.01 when compared to the soils than to the ashes. Therefore, depending if the base line of the REE distribution patterns is lowest or highest, the major contributor can be expected to be either ash or soil materials. In summary, the potential contributions can be identified on the basis of the combined major- and metallic elemental supplies, the K/Rb ratios and the base lines of the REE patterns. Their overall combination does not allow a strict but a reasonable selection (Table 5). In the detail and on the basis of the parameters evaluated here, the compilation of the four potential contributors suggests that the precipitates carried: (1) mostly or even only ash particles in the rain11 and rain12, (2) soil components and fertilizers in the snow1, rain2, rain9 and rain10, (3) soil components and plant organics in the snow2, snow4, rain1, rain3, rain4 and rain6, (4) soil and ash components in the rain7, (5) ash and fertilizers in the snow3 and the rain14, (6) soil components, ash and fertilizers in the rain13, rain15 and rain19, and (7) ash, plant organics and fertilizers in the rain25 and the hail1. Fly ash probably occurred in five groups of precipitates, soil particles and fertilizers in four groups and plant organics in two groups. The occurrence of soil particles in the rain solutes is monitored by the contents of the major elements, the ratios K/Rb above 250 and the REE patterns. The occurrence of the ash is mainly shown by the major and metal contents and by the REE patterns. Supply of fertilizers is related to the high Ca contents (>100 mg/L), which in turn points towards fertilizers of carbonate origin, and that of organics to the high K/Rb ratios (>800).
The timing of the precipitations might be another potential aspect for differentiating the nature of the contaminants. Here, most precipitates were collected during winter (the four snow samples and the rain1 to rain13 samples), which weakens a seasonal comparison as only rain25 was collected in summer. The dominant soil supply detected mostly in the snow and the rain samples during winter appears somewhat surprising, as snow precipitates occur basically when the ground is frozen and, therefore, when the soil particles are not very sensitive to wind actions, while the soil contribution seems to be quite permanent here on the basis of the above evaluated parameters. In other words, either the parameters for identification
Type of supply Soil particles Fly ash Fertilizers Plant organics
Major elements rw3, rw5 rw4, rw7, rw15 Metal elements rw2, rw13, rw14, rw15 Ca content (>100mg/L) rw9, rw10, rw13, rw14, rw15, rw19,sn1, sn3, rw2, rw5, rw25, hail1 K/Rb ratio (>800) sn2, sn4, rw1, rw3, rw4rw5, rw6, rw25, hail1 K/Rb ratio (<250) rw9, rw10, rw13, tw14, rw15 REE patterns rw3, rw5, rw6, rw7, rw9,sn1, sn2, sn4, rw1, rw2 rw10, rw13, rw15, rw19
Collection time Winter Winter, spring, summer Winter, spring, summer
of the soil particles in the atmospheric solutes are not accurate enough, or the soil materials are from beyond the local scale. Fly ash has also been detected in the precipitates of three seasons (winter, spring and summer), which is plausible because the power plant is located near the sample-collection place, and because it is probably in activity all year around as it produces electricity. Normally spread during springtime, fertilizers are also expected in precipitates until summertime. An estimate of the changing contamination during the same precipitation event was also addressed by comparing the contents of successively collected samples from long-lasting event. The snow2-snow3 succession highlights an initial combination of soil particles and organics that are replaced by fertilizers mixed with ash. In the case of the successive rain1 and rain2 precipitations, the organics detected in the starting rain decrease, replaced by fertilizers with soil particles. During the long rain event that was already examined for the changing
87Sr/86Sr signature of the solutes (Figure 6), collection of six successive
precipitates (rain6, rain7, rain9, rain10, rain11, rain12) points towards a variable contamination that started with soil particles mixed with plant organics, continuing with a replacement of the organics by fertilizers mixed with soil particles until rain10, while ash dominates the other supplies of the solutes during the final stage. Beyond the fact that soil particles appear as the most common contaminant in this example, it shall be mentioned that the rain events started often with organics in the solutes, probably the easiest accessible to winds.
Conclusion
The present study focuses on variations of major and metallic elements, and on REE distributions that were combined with Sr isotope compositions of various atmospheric precipitations (rain, snow and hail) from northeastern Kansas. This approach does not allow a quantification of the different contaminants in precipitation solutes, but it allows a clear distinction between the contributing contaminants, which highlights another approach for the rain pollution than the more basic anionic method. In the detail, the Ca contents of the wet precipitates are positively correlated with those of Mg, as well as the Na contents with those of K. The correlation between P and Na or K allows a distinction between a fertilizer and an organic contamination. Combining soil particles, fly ash, fertilizers and plant organics as the four major contributors describes changing supplies during the lasting precipitation events. The duration is also an impacting aspect for the variable contribution of the contaminants. An extended rain event provides a descriptive variation of the 87Sr/86Sr
ratio of the solutes due to the evolving mixture of the contributors, which is confirmed by the changing distribution patterns of the REEs. Combining the elemental contents and the 87Sr/86Sr ratios of
precipitates, as tried here, does not provide straight answers about the respective amounts of the contributing contaminants, because some contributing components yield similar chemical data. However, the approach explored here shows that the soil minerals and natural organics appear to contribute quite systematically, and mostly at the beginning of the precipitation events for the former. When the rain events last, this initial soil supply is replaced by the industrial fly ash from nearby power plant that becomes progressively dominant towards the end of the rain events depending on the duration.
Acknowledgement
We thank the Department of Geology of Kansas State University for having made available the necessary material for the collection of the precipitates. The analyses were made at the Centre de Géochimie de la Surface of the University Louis Pasteur at Strasbourg, France. Our sincere thanks are for the technicians of these places for their help. This study was not specifically funded.
References
1. Khemani LT, Ramana Murty BV (1968) Chemical composition of rain water and rain characteristics at Dehli. Tellus.
2. Sanusi A, Wortham H, Millet M, Mirabel P (1996) Chemical composition of rainwater in eastern France. Atmospheric Environment 30: 59-71.
3. Noguchi I, Kato T, Akiyama M, Otsuka H, Mastxumoto Y (1995) The effect of alkaline dust decline on the precipitation chemistry in northern Japan. Water Air Soil
Pollution 85: 2357-2362.
4. McNeill VF (2015) Aqueous organic chemistry in the atmosphere: sources and chemical processing of organic aerosols. Environmental Science Technology 49: 1237-1244. [crossref]
5. Ervens B, Turpin BJ, Weber RJ (2011) Secondary organic aerosol formation in cloud droplets and aqueous particles (aqSOA): a review of laboratory, field and model studies. Atmospheric Chemistry and Physics 11: 11069-11102.
6. Malik MR, Wang F, Dirpaul JM, Zhou N, Polowick PL, et al. (2007) Transcript profiling and identification of molecular markers for early microspore embryogenesis in Brassica napus. Plant Physiology 144: 134-154. [crossref]
7. Gröllert C, Kasper A, Puxbaum H (1997) Organic compounds in high Alpine snow. International Journal of Environmental. Analytical Chemistry 117: 157-173. 8. Carlton AG, Turpin BJ, Alteri KE, Seitzinger SP, Mathur R, et al. (2008) CMAQ
model performance enhanced when in-cloud secondary organic aerosol is included: Comparisons of organic carbon predictions with measurements. Environmental
Science Technology 42: 8798-8802.
9. Hansen LD, Eatough DJ (1991) Organic chemistry of the atmosphere. CRC-Press, pg: 343.
10. Schwarzenbach RP, Gschwend PM, Imboden DM (2016) Environmental Organic Chemistry. 3rd edition, Wiley & Sons Inc. Hoboken, USA, pg: 1005.
11. Sholkovitz ER, Church TM, Arimoto R (1993) Rare earth element composition of precipitation particles and aerosols. Journal of Geophysical Research 98: 20587-20599. 12. Zhang J, Liu CQ (2004) Major and rare earth elements in rainwaters from Japan and
East China Sea: Natural and anthropogenic sources. Chemical Geology 209: 315-326. 13. Kulkarni P, Chellam S, Fraser MP (2006) Lanthanum and lanthanides in atmospheric
fine particles and their apportionment to refinery and petrochemical operations in Houston, TX. Atmospheric Environment 40: 508-520.
14. Iwashita M, Saito A, Arai M, Furusho Y, Shimamura T (2011) Determination of rare-earth elements in rainwater collected in suburban Tokyo. Geochemical Journal 45: 187-197.
15. Ryu JS, Lee KS, Lee SG, Lee D, Chang HW, et al. (2007) Seasonal and spatial variations of rare earth elements in rainwaters, river waters and total suspended particles in air in South Korea. Journal of Alloys and Compounds 437: 344-350.
16. Reichman OJ (1991) Konza Prairie: A Tallgrass Natural History, University Press of Kansas pg: 240 .
17. Samuel J, Rouault R, Besnus Y (1985) Standardized multi-element analysis of geological materials in plasma emission spectrometry for inductive coupling.
Analysis 13: 312-317.
18. Otero N, Vitoria L, Soler A, Canals A (2005) Fertiliser characterisation: Major, trace and rare earth elements. Applied Geochemistry 20: 1473-1488.
19. Taylor SR, McLennan SM (1985) The continental crust: Its Composition and Evolution. Blackwell, Malden, Mass, pg: 312 .
20. Schaltegger U, Stille P, Rais N, Piqué A, Clauer N. (1994) Nd and Sr isotopic dating of diagenesis and low-grade metamorphism of argillaceous sediments. Geochimica and
21. Srivastava RK, Miller CA, Erickson C, Jambhekar R (2004) Emissions of sulfur trioxide from coal-fired power plants. Journal of the Air and Waste Management
Association 54: 750-762.
22. Charlson RJ, Rohde H (1982) Factors controlling the acidity of natural rainwater.
Nature 295: 683-685.
23. Herut B, Starinsky A, Katz A, Rosenfeld D (2000) Relationship between the acidity and chemical composition of rainwater and climatological conditions along a transition zone between large deserts and Mediterranean climate, Israel. Atmospheric
Environment 34: 1281-1292.
24. Gimeno-García E, Andreu V, Boluda R (1996) Heavy metals incidence in the application of inorganic fertilizers and pesticides to rice farming soils. Environmental
Pollution 92: 19-25.
25. McLennan SM (1989) Rare earth elements in sedimentary rocks; influence of provenance and sedimentary processes. Reviews in Mineralogy and Geochemistry 21: 169-200.
26. Probst A, El Dah’mari A, Aubert D, Fritz B, McNutt R (2000) Strontium as a tracer of weathering processes in a silicate catchment polluted by acid atmospheric inputs, Strengbach, France. Chemical Geology 170: 203-219.
27. Negrel P, Guerrot C, Millot R (2007) Chemical and strontium isotope characterization of rainwater in France: Influence of sources and hydrogeochemical implications.
Isotopes in Environmental Health Studies 43: 179-196.
28. Dupré B, Négrel P, Seimbille F, Allègre CJ (1994) 87Sr/86Sr ratio variation during a rain event. Atmospheric Environment 28: 617-620.
Citation:
Clauer N, Chaudhuri S, Techer I, Boutin R (2021) Distinction between Natural and Anthropogenic Contaminants of Atmospheric Precipitates from Northeastern Kansas Based on Their Elemental Contents and Strontium Isotopic Signatures. Geol Earth Mar Sci Volume 2(3): 1-14.
29. Rosca C, Tomlinson EL, Geibert W, McKenna CA, et al. (2018) Trace element and Pb isotope fingerprinting of atmospheric pollution sources: A case study from the east coast of Ireland. Applied Geochemistry 96: 302-326.
30. Weill DF, Drake MJ (1973) Europium anomaly in plagioclase feldspar: experimental results and semi quantitative model. Science 180: 1059-1060. [crossref]
31. Chaillou G, Anschutz P, Lavaux G, Blanc G (2006) Rare earth elements in the modern sediments of the Bay of Biscay (France). Marine Chemistry 100: 39-52.
32. MacRae ND, Nesbitt HW, Kronberg BI (1992) Development of a positive Eu anomaly during diagenesis. Earth Planetary Science Letters 109: 3-4.
33. Suzuki Y, Suzuki T, Furuta N (2010) Determination of rare earth elements (REE) in airborne particulate matter (APM) collected in Tokyo, Japan, and a positive anomaly of europium and terbium. Analytical Sciences 26: 929-935. [crossref]
34. Chaudhuri S, Clauer N, Semhi K. (2007) Plant decay as a major control of river dissolved potassium: A first estimate. Chemical Geology 243: 178-190.
35. Meybeck M (1987) Chemical weathering of surficial rocks estimated from river dissolved loads. American Journal of Sciences 287: 401-428.
36. Meybeck M (1988) How to establish and use world budgets of river material. In: Physical and Chemical Weathering in Geochemical Cycles. ln: A. Lerman and M. Meybeck, Kluwer, Dordrecht, (eds.). Netherlands pg: 247-272.
37. Berner EK, Berner RA (1996) Global Environment: Water, Air and Geochemical Cycles. Prentice Hall, New Jersey, pg: 376.