HAL Id: hal-00298063
https://hal.archives-ouvertes.fr/hal-00298063
Submitted on 6 Feb 2007
HAL is a multi-disciplinary open access
archive for the deposit and dissemination of
sci-entific research documents, whether they are
pub-lished or not. The documents may come from
teaching and research institutions in France or
abroad, or from public or private research centers.
L’archive ouverte pluridisciplinaire HAL, est
destinée au dépôt et à la diffusion de documents
scientifiques de niveau recherche, publiés ou non,
émanant des établissements d’enseignement et de
recherche français ou étrangers, des laboratoires
publics ou privés.
precipitation extremes over the last three centuries
A. Pauling, H. Paeth
To cite this version:
A. Pauling, H. Paeth. On the variability of return periods of European winter precipitation extremes
over the last three centuries. Climate of the Past, European Geosciences Union (EGU), 2007, 3 (1),
pp.65-76. �hal-00298063�
www.clim-past.net/3/65/2007/
© Author(s) 2007. This work is licensed under a Creative Commons License.
of the Past
On the variability of return periods of European winter
precipitation extremes over the last three centuries
A. Pauling1,*and H. Paeth2
1Institute of Geography, University of Bern, Hallerstrasse 12, 3012 Bern, Switzerland
2Geographical Institute, University of W¨urzburg, Am Hubland, 97074 W¨urzburg, Germany
Received: 22 February 2006 – Published in Clim. Past Discuss.: 24 April 2006
Revised: 3 November 2006 – Accepted: 10 January 2007 – Published: 6 February 2007
Abstract. We investigate the changes of extreme European
winter (December-February) precipitation back to 1700 and show for various European regions that return periods of ex-tremely wet and dry winters are subject to significant changes both before and after the onset of anthropogenic influences. Generally, winter precipitation has become more extreme. We also examine the spatial pattern of the changes of the extremes covering the last 300 years where data quality is sufficient. Over central and Eastern Europe dry winters oc-curred more frequently during the 18th and the second part of the 19th century relative to 1951–2000. Dry winters were less frequent during both the 18th and 19th century over the British Isles and the Mediterranean. Wet winters have been less abundant during the last three centuries compared to 1951–2000 except during the early 18th century in central Europe. Although winter precipitation extremes are affected by climate change, no obvious connection of these changes was found to solar, volcanic or anthropogenic forcing. How-ever, physically meaningful interpretation with atmospheric circulation changes was possible.
1 Introduction
The most prominent aspect of climate change is the global warming trend during the 20th century (IPCC, 2001). Be-side temperature, however, precipitation is a key climate vari-able as well, as it affects both human economies and terres-trial ecosystems in different areas of the globe (e.g. Jones and Mann, 2004; Xoplaki et al., 2004; Touchan et al., 2003, 2005). From a societal point of view it may be even more important than temperature as in past centuries crop fail-ures in central Europe were often connected to precipita-tion anomalies (Pfister, 1999). Even nowadays agricultural Correspondence to: A. Pauling
success strongly depends on the timely availability of water. Over the past 50 years water demand increased strongly as a consequence of the increase of wealth and irrigation, changes in lifestyle, and population growth and is expected to further increase in the future.
Precipitation trends have been observed on both global and hemispheric scales during the 20th century, which may influ-ence future water supply (Easterling et al., 2000; Folland et al., 2001; Mann, 2002; Cullen et al., 2002; Touchan et al., 2003, 2005; Xoplaki et al., 2004). Additionally, water vapour is the most important greenhouse gas and has a strong feed-back mechanism to temperature. Hence, a key question are the future changes of precipitation and its extremes at dif-ferent temporal and spatial scales. Modelling precipitation changes allows to assess possible changes. A coupled cli-mate model applied by Kharin and Zwiers (2000) suggests that extreme daily precipitation will increase almost every-where on the globe. However, more profound understanding of the variability of extreme precipitation may help to im-prove the models and to interpret the model results.
One way to address this question is to analyse past precip-itation anomalies. Apart from changes in the mean, changes in the variability are of great importance as the impact of changes in extremes on societies is larger than in the mean (Katz and Brown, 1992; Schaeffer et al., 2005; Sch¨ar et al., 2004). So far, most studies dealing with changes in precip-itation extremes concentrated on daily data (e.g. Easterling et al., 2000; Frei and Sch¨ar, 2001; Groisman et al., 1999; Heino et al., 1999; Van den Brink et al., 2005; Zhang et al., 2004). Xoplaki et al. (2005) investigated the change of Eu-ropean spring and autumn temperature extremes over the last 500 years. So far, very few studies deal with changes in Eu-ropean seasonal precipitation extremes (e.g. Luterbacher et al., 2006).
Fig. 1. European winter (DJF) precipitation anomaly maps [mm] relative to 1951–2000. The left panels show modern winters that have been very dry in the region marked by the black rectangles. The middle panels show winters taken from the reconstructions (1500–1900) that were anomalously dry in the same region. (a, b): northern Ireland (10–5 W/54–56 N), (c, d): southern Spain (7–1 W/36–40 N), (e, f): north-eastern Europe (26–29 E/55–57 N), (g, h): central Europe (5–10 E/47–49 N). The right panels present the associated RE values.
For the understanding of the climate system, it is crucial to investigate seasonal extremes rather than annual extremes as each season has its specific dynamics and also the im-pacts on the society are season-specific. Central and northern European precipitation extremes in summer affect harvests (Pfister, 1999), while in the Mediterranean region winter pre-cipitation is paramount for water availability over the whole
year (Xoplaki, 2002; Xoplaki et al., 2004). Moreover, Eu-ropean winter precipitation can be linked to large-scale cir-culation, which may help to improve our understanding of the climate system (e.g. Xoplaki et al., 2004; Pauling et al., 2006) whereas summer precipitation is more local and recon-structive skill is lower for that season (Pauling et al., 2006).
A key issue of the present study is whether extremely dry or wet anomalies averaged over Europe and subregions have become more extreme in recent decades in the context of the last few centuries. A similar analysis has been performed for the Mediterranean area over the last 500 years (Luter-bacher et al., 2006) and European spring and autumn tem-perature (Xoplaki et al., 2005). In a first step, we present recent precipitation anomalies and compare them with his-torical analogues. Further, return values of extremely wet and dry winters are estimated and the significance of their changes over the last 300 years is assessed (Paeth and Hense, 2005; Xoplaki et al., 2005; Luterbacher et al., 2006). As cli-mate change may differ regionally, we perform the analyses
on a gridpoint basis (0.5◦
×0.5◦resolution, see below) with
special regard to anomalies during the recent decades (which were presumably influenced by anthropogenic forcing) and seasonal extremes during earlier periods.
This work is structured as follows: Sect. 2 describes the data and the methods. In Sect. 3 the results are presented, in Sect. 4 they are discussed and in Sect. 5 some conclusions are drawn.
2 Data and methods
For our analyses we use the precipitation reconstructions from Pauling et al. (2006). This dataset is seasonally re-solved back to 1500 covering all European land areas (30 W–
40 E/30 N–71 N) on a 0.5◦
×0.5◦grid. It has been developed
using precipitation-sensitive proxies including long instru-mental series, indices based on documentary evidence and natural proxies (tree-rings, ice cores, coral and speleothem data). These proxies served as input to a Principal Com-ponent Regression (PCR) technique which seeks to recon-struct large-scale fields (e.g. Mann et al., 1998, 2005; Jones and Mann, 2004; Luterbacher et al., 2004; Br¨onnimann and Luterbacher, 2004; Casty et al., 2005; Rutherford et al., 2005; Xoplaki et al., 2005; Pauling et al., 2006). As depen-dent variable the Mitchell and Jones (2005) gridded precipi-tation dataset has been used for calibration. Throughout our analyses we use this dataset for the 1901–2000 period and the Pauling et al. (2006) dataset for the 1500–1900 period. This approach allows to study seasonal precipitation patterns and extremes over whole Europe during 1500–2000. We re-strict our analyses to the winter (here defined as the sum of December, January and February) season, as this allows dy-namic interpretation and may contribute most to the under-standing of the climate system. Additionally, reconstructive skill is highest for the winter season (Pauling et al., 2006).
For illustration, Fig. 1 gives some examples of recent and historic precipitation anomaly patterns including their recon-structive skill which is measured by the Reduction of Error (RE) values. Any reconstruction with RE>0 can be consid-ered as skilful (e.g. Cook et al., 1994; Pauling et al., 2006). We selected recent winters that were anomalously dry in
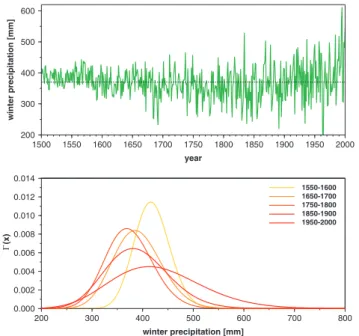
Fig. 2. Time series of winter precipitation over parts of Ireland (10– 5 W/54–56 N) and the corresponding Gamma distributions for 5 dif-ferent subperiods of the 500-year data set by Pauling et al. (2006).
northern Ireland, southern Spain, eastern and central Europe (left panels of Fig. 1) and compared them with winters taken from the reconstruction period (1500–1900; middle panels of Fig. 1) that were drier than normal in the same region. These regions are marked by the black rectangles in Fig. 1. The right panels show the spatial distribution of the associated RE values. In general, the anomaly pattern of the historic examples presented in Fig. 1 are similar to the modern ones. We define climate extremes as k-year return values (RVs) of seasonal sums of precipitation as estimated from Gamma distributions fitted to the data (Paeth and Hense, 2005; Xo-plaki et al., 2005; Luterbacher et al., 2006). The return period (RP) k associated with a given RV is defined as the inverse of the probability that the RV is reached or exceeded assuming Gamma distribution. Seasonal precipitation is generally be-lieved to follow this distribution (Dunn, 2004). We also cal-culated RPs assuming normal distribution. The results were very similar (not shown).
To investigate the changing RPs we selected the four areas mentioned above (see black rectangles in Fig. 1). Figure 2 shows exemplary the time series of winter precipitation over northern Ireland and the corresponding Gamma distributions for five different subperiods of the 500-year dataset. Ireland has been chosen because it is subject to a strong trend in the mean as well as in the extremely wet and dry years. Many more time series of the reconstructions can be found in Paul-ing et al. (2006). The figure illustrates the link between the long-term changes in mean precipitation and changes in the location and shape of the Gamma distributions. The negative rainfall trend between 1500 and 1900 is reflected by a shift of
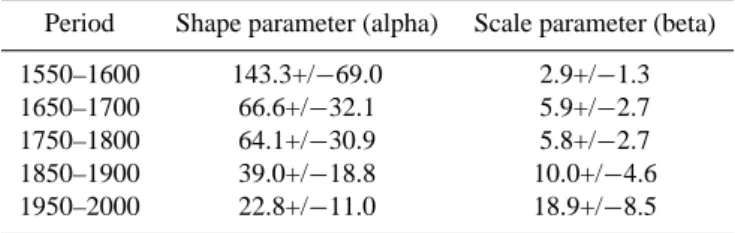
Table 1. Means and 90% confidence intervals of the shape and scale parameter of Gamma distributions estimated for different subperi-ods of the winter precipitation time series over Ireland using 1000 bootstrap samples.
Period Shape parameter (alpha) Scale parameter (beta) 1550–1600 143.3+/−69.0 2.9+/−1.3
1650–1700 66.6+/−32.1 5.9+/−2.7
1750–1800 64.1+/−30.9 5.8+/−2.7
1850–1900 39.0+/−18.8 10.0+/−4.6 1950–2000 22.8+/−11.0 18.9+/−8.5
the Gamma distribution towards a lower mean. The increase in variability results in a broadening of the distribution. The anomalously wet years after 1970 lead to positive skewness for the 1950–2000 period. It is obvious from this figure that changes in the Gamma distributions are coming along with changes in the occurrence of extremely dry and wet years. Table 1 shows the corresponding parameters of the Gamma distributions and their 90% confidence intervals. They are estimated using the Monte Carlo method which is described in more detail below.
Climate reconstructions tend to lose variability during early periods when only few predictors are available (see Fig. 2; Pauling et al., 2006). This leads to biased estimations of the return periods of extremes. Hence, when analyzing changes of the return periods of extremes, which is the main purpose of this article, it is mandatory that the available pre-dictors are able to realistically reconstruct not only the mean (which is often the case) but also the extremes (which is more difficult).
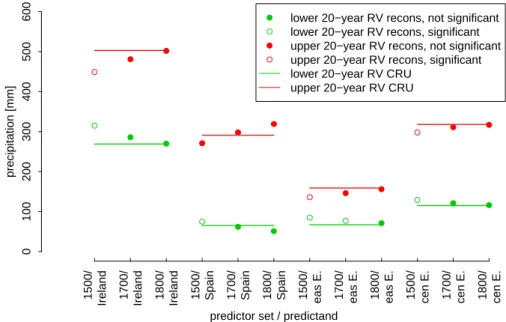
We addressd this issue by reconstructing precipitation dur-ing 1901–1983 usdur-ing just the predictors that are available in 1500 for the four regions (northern Ireland, southern Spain, eastern and central Europe). The consideration of the time period 1901–1983 is motivated by the predictor availability. The reconstruction methods included multiple regression (for fitting) and cross-validation (for achieving the predictions). Then we compared these predictions (reconstructions) with the data from Mitchell and Jones (2005) to verify if there are significant differences between 20-year return values (RVs) of dry/wet extremes of the time series. No significant dif-ference implies correct reconstruction of the RVs by the pre-dictors available in 1500. For estimating the significance we used the Monte Carlo technique that is described in more de-tail below. We repeated this procedure using the predictor sets available in 1700 and 1800 (the predictors available for 1600 are identical with the ones available for 1500). Figure 3 shows the upper and lower 20-year return values of winter precipitation in the four regions using the three predictor sets and the corresponding return values of the Mitchell and Jones
(2005) dataset. Significance was estimated using the Monte Carlo method (for details see below). For the predictor set available in 1500 significant differences were detected for all regions while the predictors available in 1700 and 1800 are able to realistically reconstruct the RVs except for the dry extremes in eastern Europe. However, in eastern Europe the dry extremes were hardly significantly different from the ref-erence period 1951–2000 during the last 300 years anyway (Fig. 5). Therefore, we exclude all data prior to 1700 from our analyses concerning the changes of return periods.
We estimated the RVs for several RPs for a moving 50-year-window over the period 1700–2000. These results pro-vide insight in how variable the recurrence of extreme sea-sonal winter precipitation has been over the last 300 years (Figs. 4 and 6). As the changes of extremes prior to 1700 may be due to predictor availability, the significance of the changes in extremes is estimated for data after 1700 (Figs. 5 and 7).
To analyse the spatial differences of the change in RPs, we performed the following experiment (Figs. 8 and 9): First, we selected all gridpoints that have reconstructive skill (Pauling et al., 2006). Second, we determined the RVs that have a RP of 20 years for every gridpoint during 1951–2000 assuming Gamma distribution. By means of a Kolmogorov goodness of fit test it has been ensured that the Gamma distribution represents a reliable description of the seasonal precipitation data. For most regions and time periods after 1650, the Null-hypothesis, saying that the sample is taken from a Gamma distribution, has been accepted at an error level of 1%. An alternative way would be to start from a non-parametric es-timate of the probability distribution, for instance by using kernel density estimators. The results do not substantially change if other RPs are calculated (not shown). Third, using these RVs we estimated the RPs based on Gamma distribu-tions whose parameters were estimated using 50-year peri-ods back to 1700. We chose periperi-ods of 50 years to ensure that 20-year-events are likely to occur. Fourth, the signifi-cance of these changes were estimated by applying a Monte Carlo sampling approach (Paeth and Hense, 2005).
When fitting a theoretical distribution like the Gamma dis-tribution to a sample of limited size, the estimate of the distri-bution parameters, in this case shape (alpha) and scale (beta) parameter, is subject to uncertainty. This particularly affects the calculation of extreme values with return periods beyond the length of the original time series. Therefore, we con-struct an uncertainty range for each parameter of the Gamma distribution using a parametric bootstrap approach with 1000 iterations (Kharin and Zwiers, 2000; Paeth and Hense, 2005; Xoplaki et al., 2005). The Monte Carlo method is based on random samples which are drawn from the fitted Gamma dis-tribution. One basic assumption is that the individual winter values are independent of each other. Therefore, we have computed the autocorrelation function for all time series and found that the autocorrelation coefficients with time lags of one year and longer are not significantly different from zero
predictor set / predictand precipitation [mm] 0 100 200 300 400 500 600 1500/
Ireland 1700/ Ireland 1800/ Ireland 1500/ Spain 1700/ Spain 1800/ Spain 1500/ eas E. 1700/ eas E. 1800/ eas E. 1500/ cen E. 1700/ cen E. 1800/ cen E. lower 20−year RV recons, not significant lower 20−year RV recons, significant upper 20−year RV recons, not significant upper 20−year RV recons, significant lower 20−year RV CRU
upper 20−year RV CRU
Fig. 3. Estimates of 20-year return values for Ireland, southern Spain, central and eastern Europe of the Mitchell and Jones (2005) dataset (“CRU”) and the reconstructions that were produced using predictors that were available in 1500, 1700 and 1800 respectively. Open (solid) circles denote RVs that are (not) significantly different from the corresponding RV value of the Mitchell and Jones (2005) data at the 5% level. Based on these results, subsequent analyses of the extremes are restricted to the period after 1700 as the predictors available before 1700 appear to be unable to capture the extremes.
at an error level of 1% (not shown). Each random sample leads to a new set of parameters and RVs which are normally distributed over the 1000 bootstraps (Park et al., 2001). Thus, the standard error of the new random sample of Gamma pa-rameters and RVs is a measure of uncertainty of the extreme value estimate. Accordingly, the confidence intervals can be estimated at a given error level. We will use the Monte Carlo method for two issues: First, the confidence intervals of the parameters of the Gamma distribution are estimated (see Ta-ble 1). It is obvious that the uncertainty range is consideraTa-ble. Therefore, the subsequent analysis of extreme values is based on the mean parameters from the bootstrapping rather than on the parameters directly derived from the data. Second, the confidence intervals of return values for different subpe-riods between 1700 and 2000 are compared with each other in order to decide whether a change in the mean RV estimate is statistically significant at a given error level. These confi-dence intervals are based on the standard deviation and the quantiles of the bootstrap samples. A change of RPs signifi-cant at the 1% level is reached if the 90% confidence intervals of the associated RVs do not overlap between two subperiods (Kharin and Zwiers, 2000; Park et al., 2001).
3 Results
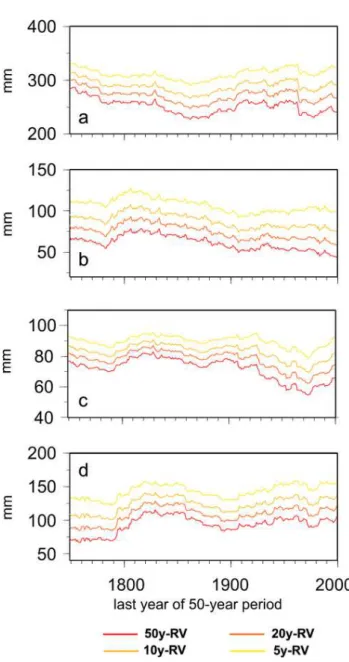
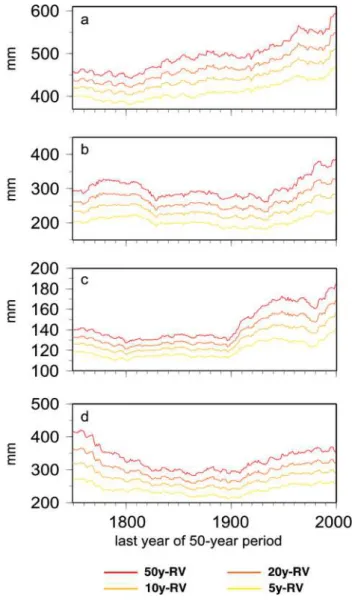
Figure 4 presents the estimated RVs of dry winter extremes in four regions (see rectangles in Fig. 1) with RPs of 5, 10, 20, and 50 years. The RVs are estimated for 50-year windows
from 1700 to 2000 based on 1000 bootstrap samples, taking into account the uncertainty of the estimates of the gamma parameters. Over northern Ireland (Fig. 4a) the RVs gradu-ally decreased since 1700, i.e. extremely dry winters became more severe. Additionally, some interdecadal fluctuations can be observed. The RVs over southern Spain (Fig. 4b) and over north-eastern Europe (Fig. 4c) show a weak overall neg-ative trend since 1700 with superimposed interdecadal fluctu-ations. The temporal evolution of the RVs in central Europe (Fig. 4d) is characterized by a slight increase. Significance estimates of the changes 1700–2000 relative to 1951–2000 are given in Fig. 5. Over northern Ireland the RVs were sig-nificantly different from 1951–2000 only during the first part of the 18th century, while over southern Spain this was the case up to around 1880 (Fig. 5a and b). Over north-eastern Europe (Fig. 5c) the 50-year RVs were different from 1951– 2000 from 1750 to 1900, while the RVs with frequencies of 5–10 years remained the same since 1700. Over central Eu-rope the RVs during the 18th century differed significantly from 1951–2000 (Fig. 5d).
Similar to Fig. 4, Fig. 6 displays the estimated RVs of wet winter extremes. The RVs in northern Ireland (Fig. 6a) are dominated by a positive trend, which is enhanced during the 20th century. The RVs over southern Spain (Fig. 6b) are characterized by a peak during the second half of the 18th century and by a positive trend during the 20th century. The RVs in north-eastern Europe (Fig. 6c) feature similar char-acteristics. In central Europe (Fig. 6d) the RVs are high-est around 1750, sugghigh-esting severe wet extremes during that
Fig. 4. Estimated return values of various dry extremes for 50-year windows over 1700–2000. For details see the text. (a) northern Ireland (10–5 W/54–56 N), (b) southern Spain (7–1 W/36–40 N), (c) north-eastern Europe (26–29 E/55–57 N), (d) central Europe (5–10 E/47–49 N). These areas are marked by black rectangles in Fig. 1. For significance of the changes in the return values relative to 1951–2000 see Fig. 5.
time. Another feature is the positive trend during the 20th century. However, the RVs do not reach the levels of 1750. Significance estimates of the changes 1700–2000 relative to 1951–2000 are given in Fig. 7. All RVs are significantly dif-ferent from 1951–2000 except over southern Spain during the second part of the 18th century and over central Europe during the whole 18th century.
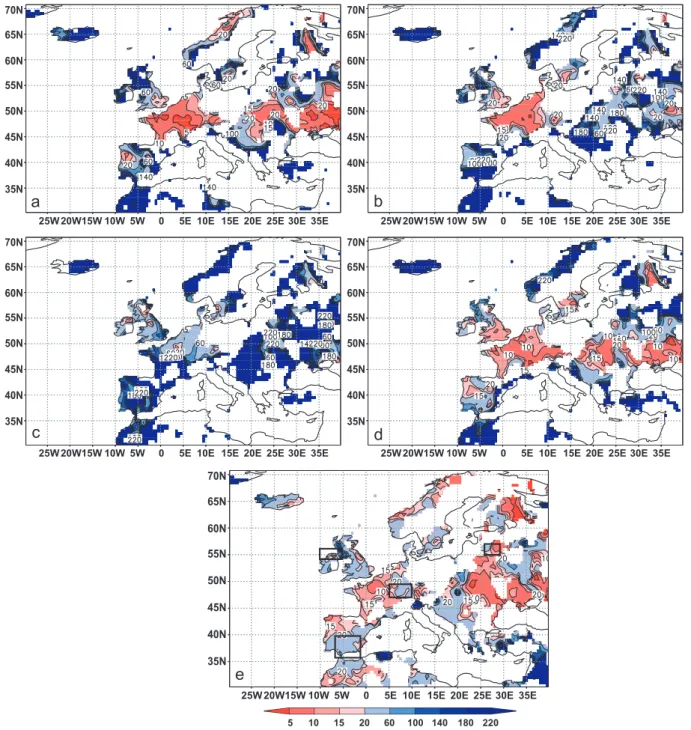
Figure 8 presents the spatio-temporal variation of RPs of dry extremes, which had a RP of 20 years during 1951–
Fig. 5. Statistical significance of changes in extremely dry win-ters 1700–2000. All 50-year periods have been compared against 1951–2000 for various regions. (a) northern Ireland (10–5 W/54– 56 N), (b) southern Spain (7–1 W/36–40 N), (c) north-eastern Eu-rope (26–29 E/55–57 N), (d) central EuEu-rope (5–10 E/47–49 N). The black dots at the 20y-RV line mark the significance of the changes of the RPs displayed in Figs. 8 and 9.
2000. Only areas with reconstructive skill (RE>0) during the 1701–1720 period are considered (therefore the white ar-eas over parts of Europe). We chose this period as benchmark because thereafter the skill generally increases (Pauling et al., 2006). The significance of changes in the displayed RPs rel-ative to the RPs during 1951–2000 for the regions marked by the black rectangles in Fig. 8e can be obtained from Fig. 5. As Fig. 8 is based on the 20-year RVs, the horizontal line with the black dots in Fig. 5 (end of the analysed 50-year periods) can be used to determine the significance.
As seen from Fig. 8a dry winters in western Europe with a RP of 20 years during 1951–2000 occurred every 5-10 years
Fig. 6. As Fig. 4, but for wet winters.
during 1701–1750. This change is significant at the 5% level (see corresponding black dot in Fig. 5d). On the other hand, dry winters were less frequent over the Iberian Peninsula, south-eastern Europe and the British Isles. The same situa-tion persists during 1751–1800 over Europe (Fig. 8b) except that in eastern Europe dry winters were less frequent. Dur-ing 1801–1850 (Fig. 8c) almost over whole Europe dry win-ters were less frequent than during the 1951–2000 reference period. From 1851–1900 (Fig. 8d) the pattern is again very similar to the one during the early 18th century (Fig. 8a). The same holds for 1901–1950 (Fig. 8e), although the magnitude of the changes of the RP is less pronounced.
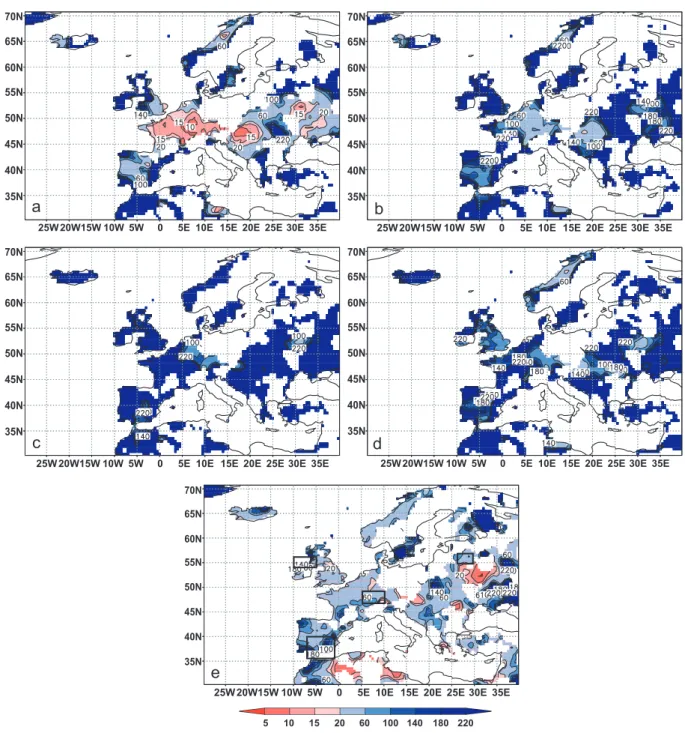
Figure 9 displays the same analysis as Fig. 8 for wet ex-tremes. The significance of the RPs relative to the RPs during 1951–2000 for the regions marked by the black rectangles in Fig. 9e is given by the black dots in Fig. 7. From 1701–1750 wet winters were up to twice as probable over central
Eu-Fig. 7. As Eu-Fig. 5, but for wet winters.
rope and parts of eastern Europe than during the 1951–2000 period (Fig. 9a). This change is, however, not significant at the 10% level (see corresponding black dot in Fig. 7d). From 1750–1950 wet winters were less probable compared to 1951–2000 (Fig. 9b–e) over whole Europe. This change is mostly significant (Fig. 7a–d).
4 Discussion
Interpretation of the observed changes in extreme frequen-cies together with atmospheric circulation may yield insights into important climate mechanisms. Figures 4–7 focus on the temporal evolution of the changes of the RPs. The fluc-tuations of the RVs of dry extremes as displayed by Fig. 4 can be linked to changing prevalence of circulation types. In southern Spain (Fig. 4b) the dry RVs were significantly less severe between 1750 and 1850 than during the most recent 50 years. This may be due to the anomalously dry
condi-Fig. 8. Spatial distribution of return periods for dry winters which had a return period of 20 years during 1951–2000. The displayed return periods are estimated using (a) 1701–1750, (b) 1751–1800, (c) 1801–1850, (d) 1851–1900, (e) 1901–1950. The black rectangles mark the regions for which the significance is given by the black dots in Fig. 5.
tions in the 1990s that were linked to the well-known pos-itive states of the NAO. This feature appeared to be unique for at least the past 300 years in that region (Fig. 4b). An interesting feature are the very severe RVs of dry winter ex-tremes in central Europe at the beginning of the 18th cen-tury. This can be well interpreted as the end of the Maunder Minimum (1645–1715), a period known for its dry and cold winters in central Europe (e.g. Wanner et al., 1995;
Luter-bacher et al., 2001, 2002, 2004). It is well known that during that period the influence of the Russian high increased during some winters which led to persisting advection of cold and dry continental air (e.g. Wanner et al., 1995; Luterbacher et al., 2001, 2002, 2004; Xoplaki et al., 2001; Shindell et al., 2001; Jacobeit et al., 2003). Moreover, this coincides with few extremely dry winters in southern Spain (Fig. 4b). Neg-ative NAO states may provide a physical explanation as they
Fig. 9. As Fig. 6, but for wet winters. For significance of the changes in the regions marked by black rectangles see Fig. 7.
are connected with dry and cold winters in central Europe and wet winters in southern Europe (e.g. Hurrell, 1995; Wan-ner et al., 1995; Luterbacher et al., 2001, 2002, 2004, 2006; Xoplaki et al., 2004). On the other hand, also wet winters became more severe at the end of the Maunder Minimum especially over central Europe (Fig. 6d), leading to the ob-served increase in the year-to-year variability of winter pre-cipitation. The physical mechanism leading to this change is not completely understood. Shindell et al. (2001) conclude from modelling studies that low solar irradiance forces the NAO toward the low index state. Wanner et al. (2000) argue
that sea surface temperatures (SSTs) may have been high in the north Atlantic promoting high pressure over the Atlantic which helped block the westerlies and facilitate the advection of cold and dry continental air to central Europe. Luterbacher et al. (2001) and Shindell et al. (2001) further suggest that in-creasing solar irradiance at the end of the Maunder Minimum might lead to a strengthening of the NAO through complex interactions between the troposphere and stratosphere, and thus to a general continental warming and wetter conditions in northern Europe.
Figures 8 and 9 provide a spatially detailed view of the changes of RPs of 20-year return values the back to 1700. Figure 8 shows that most of western Europe has experi-enced more frequently dry extremes back to 1700 com-pared to 1951–2000 except during the first part of the 19th century. However, only the 1701–1750 period was signifi-cantly different from 1951–2000 (see black dots in Fig. 5d). Other regions such as Iceland, western Norway, parts of eastern Europe and Turkey experienced less frequently dry winters. These results suggest that the circulation changes over the last centuries affected all regions but in a differ-ent way. While in cdiffer-entral and eastern Europe circulation changes caused more frequent dry extremes during the 18th century, over most other European regions dry extremes hap-pened less frequently during the same period. During the 1800–1850 period the dry extremes were less frequent than during the 18th century and the second part of the 19th century in central Europe. This is in line with Jacobeit et al. (2001, 2003) who found north-westerly flow over Europe to be dominant during 1830–1850. This circulation type ad-vects moist and cold air to central Europe which may also have contributed to the marked and well documented ad-vances of Alpine glaciers such as the Lower Grindelwald Glacier, Switzerland (Zumb¨uhl, 1980; Zumb¨uhl et al., 1983; Zumb¨uhl and Holzhauser, 1988; Steiner et al., 2005). How-ever, less dry extremes do not necessarily mean wetter con-ditions on average (Katz and Brown, 1992; Schaeffer et al., 2005) which may be more important for the mass balance of glaciers than changes in the extremes. This argument is
supported by Steiner et al. (2007)1who found from a
sensi-tivity study using neural networks that summer temperature was the dominant factor leading to the advance of the Lower Grindelwald Glacier during the first part of the 19th century. An important issue is the link of observed (reconstructed) changes in extremes to the underlying causes. However, the link to forcing factors such as solar variability, volcanic ac-tivity and greenhouse forcing is hard to establish (Easterling et al., 2000; Wanner et al., 2001; Yoshimori et al., 2005). Solar activity may play a certain role as the above discus-sion on circulation during the end of the Maunder Mini-mum (reduced solar irradiance) has shown. Still, the possible physical mechanisms leading to this is not well understood. Volcanic eruptions may also influence the presented results. However, the influence of volcanic events typically persists for only 1–3 years (Robock, 2002; Shindell et al., 2004). Hence, it is not surprising that there is no obvious connec-tion between volcanic events and the observed changes in the extremes, which are analysed using 50-year periods. Ad-ditionally, all possible influences by the forcing factors are superimposed by internal variability. The clearest interpreta-tion of the influence of the forcing factors is via circulainterpreta-tion
1Steiner, D., Pauling, A., Nesje, A., Luterbacher, J., Wanner, H.,
and Zumb¨uhl, H.J.: Sensitivity of European glaciers to precipitation and temperature – two case studies, Clim. Change, submitted, 2007.
changes as proposed above. As the example of the end of the Maunder Minimum has shown, the increase of cold and dry winters due to circulation changes have affected very much the probability of extremely dry winters. These circulation changes are linked in a complex way to both solar irradi-ance and volcanoes (Shindell et al., 2001) on different time and space scales, but also to other factors such as the dis-tribution of sea surface temperatures (Wanner et al., 2000; Luterbacher et al., 2001). The observed increase in wet ex-tremes during the recent decades appears to be unique for northern Ireland, southern Spain and eastern Europe for the last 300 years (Fig. 6a–c). This may be a result of the inten-sification of the water cycle which can be a result of anthro-pogenic greenhouse forcing. On the other hand the presented analyses have shown that there have been substantial fluctu-ations in extremes before the onset of the human influence on climate. However, establishing the chain of causation is not trivial because many interactive factors influence the oc-currence of extremes. One way to address this task is experi-ments using physical climate models, an objective for further investigations.
5 Conclusions
We investigated the changes of the return periods of seasonal winter precipitation extremes over the last 300 years for var-ious European regions using the reconstructions by Pauling et al. (2006). It was shown that the recurrence of both wet and dry winter precipitation extremes over Europe were sub-ject to significant changes both before and after the onset of human influences on climate. Generally, winter precipitation has become more extreme.
We demonstrated that over central Europe dry winters oc-curred more often during the past 300 years (except 1801– 1850) with respect to 1951–2000. On the other hand, wet winters were less frequent (except 1701–1750). Over many other parts of Europe, extremes happened less frequently over the last 300 years compared to 1951–2000. Most of these changes are highly significant. By limiting our analy-ses spatially and temporally to reconstructions with reliable extremes (all analyses of the extremes are restricted to the pe-riod after 1700), we minimized the bias that may stem from the reduction of skilful predictors back in time.
We discussed possible physical mechanisms to explain the observed changes of extremes. The reasons for these changes may include internal oscillations as well as changes in forcing factors (solar variability, volcanic events, green-house gases). Further studies are needed to attribute the ob-served changes in extremes to forcing factors. Additionally, similar analyses could be performed for other seasons. Also, comparisons with model data could further increase the con-fidence in our conclusions and physical explanations.
Acknowledgements. This work is part of the EU-project SOAP (Simulations, Observations And Palaeoclimate data: climate variability over the last 500 years) the Swiss part being funded by the Staatssekretariat f¨ur Bildung und Forschung (SBF) under contract 01.0560. H. Paeth was supported by the Federal German Ministry of Education and Research (BMBF) under grant No. 07 GWK 02 and by the Ministry of Education, Science and Research (MSWF) of the Federal State Northrhine-Westfalia under grants No. 514-21200200 and No. 223-21200200. The authors also wish to thank J. Luterbacher for fruitful discussions and contributions to this manuscript.
Edited by: J. Guiot
References
Br¨onnimann, S. and Luterbacher, J.: Reconstructing Northern Hemisphere upper-level fields during World War II, Clim. Dy-nam., 22, 499–510, 2004.
Casty, C., Wanner, H., Luterbacher, J., Esper, J., and B¨ohm, R.: Temperature and precipitation variability in the Euro-pean Alps since 1500, Int. J. Climatol., 25, 1855/1880, doi:10.1002/joc1216, 2005.
Cook, E. R., Briffa, K. R., and Jones, P. D.: Spatial regression meth-ods in dendroclimatology – a review and comparison of two tech-niques, Int. J. Climatol., 14, 379–402, 1994.
Cullen, H. M., Kaplan, A., Arkin, P. A., and Demenocal, P. B.: Im-pact of the North Atlantic Oscillation on Middle Eastern climate and streamflow, Clim. Change, 55, 315–338, 2002.
Dunn, P. K.: Occurrence and quantity of precipitation can be mod-elled simultaneously, Int. J. Climatol., 24, 1231–1239, 2004. Easterling, D. R., Meehl, G. A., Parmesan, C., Changnon, A., Karl,
T. R., and Mearns, L. O.: Climate extremes: observations, mod-eling, and impacts, Science, 289, 2068–2074, 2000.
Folland, C. K., Karl, T. P., Christy, J. R., Clarke, R. A., Gruza, G. V., Jouzel, J., Mann, M. E., Oerlemans, J., Salinger, M. J., and Wang, S. W.: Observed climate variability and change, in: Chapter 2 of climate change 2001; the scientific basis, Contri-bution of Working Group I to the Third Assessment Report of the Intergovernmental Panel on Climate Change (IPCC), edited by: Houghton, J. T., Ding, Y., Griggs, D. J., Noguer, M., van der Linden, P. J., and Xiaoxu, D., Cambridge University Press, Cambridge, 99–181, 2001.
Frei, C. and Sch¨ar, C.: Detection probability of trends in rare events: theory and application to heavy precipitation in the Alpine re-gion, J. Clim., 14, 1568–1584, 2001.
Groisman, P. Y., Karl, T. R., Easterling, D. R., Knight, R. W., Jama-son, P. F., Hennessy, K. J., Suppiah, R., Page, C. M., Wibig, J., Fortuniak, K., Razuvaev, N., Douglas, A., Forland, E., and Zhai, P.-M.: Changes in the probability of heavy precipitation: impor-tant indicators of climatic change, Clim. Change, 42, 243–283, 1999.
Heino, R., Brazdil, R., Forland, E., Tuomenvirta, H., Alexanders-son, H., Beniston, M., Pfister, C., Rebetez, M., Rosenhagen, G., R¨osner, S., and Wibig, J.: Progress in the study of climatic ex-tremes in northern and central Europe, Clim. Change, 42, 23–29, 1999.
Hurrell, J.: Decadal trends in the North Atlantic Oscillation: Re-gional temperatures and precipitation, Science, 269, 676–679,
1995.
Intergovernmental Panel on Climate Change (IPCC): Climate change 2001: The scientific basis, edited by: Houghton, J. T., Ding, Y., Griggs, D. J., Noguer, M., Van der Linden, P. J., Dai, X., Maskell, K., and Johnson, C. A., Cambridge University Press, Cambridge, 2001.
Jacobeit, J., J¨onsson, P., B¨arring, L., Beck, C., and Ekstr¨om, M.: Zonal indices for Europe 1780–1995 and running correlations with temperature, Clim. Change, 48, 219–241, 2001.
Jacobeit, J., Wanner, H., Luterbacher, J., Beck, C., Philipp, A., and Sturm, K.: Atmospheric circulation variability in the North-Atlantic-European area since the mid-seventeenth century, Clim. Dynam., 20, 341–352, 2003.
Jones, P. D. and Mann, M. E.: Climate over past millennia, Rev. Geophys., 42 pp., doi:10.1029/2003RG000143, American Geo-physical Union, 2004.
Katz, R. W. and Brown, B. G.: Extreme events in a changing cli-mate: variability is more important than averages, Clim. Change, 21, 289–302, 1992.
Kharin, V. V. and Zwiers, F. W.: Changes in the extremes in an ensemble of transient climate simulations with a coupled atmosphere-ocean GCM, J. Clim., 13, 3760–3788, 2000. Luterbacher, J., Rickli, R., Xoplaki, E., Tinguely, C., Beck, C.,
Pfis-ter, C., and Wanner, H.: The Late Maunder Minimum (1675– 1715) – a key period for studying decadal scale climatic change in Europe, Clim. Change, 49, 441–462, 2001.
Luterbacher, J., Xoplaki, E., Dietrich, D., Rickli, R., Jacobeit, J., Beck, C., Gyalistras, D., Schmutz, C., and Wanner, H.: Recon-struction of sea-level pressure fields over the eastern North At-lantic and Europe back to 1500, Clim. Dynam., 18, 545–561, 2002.
Luterbacher, J., Dietrich, D., Xoplaki, E., Grosjean, M., and Wan-ner, H.: European seasonal and annual temperature variability, trends and extremes since 1500, Science, 303, 1499–1503, 2004. Luterbacher, J., and 48 co-authors: Mediterranean climate variabil-ity over the last centuries: a review, in: The Mediterranean cli-mate: an overview of the main characteristics and issues, edited by: Lionello, P., Malanotte-Rizzoli, P., and Boscolo, R., Elsevier, Amsterdam, 2006.
Mann, M. E., Bradley, R. S., and Hughes, M. K.: Global-scale tem-perature patterns and climate forcing over the past six centuries, Nature, 392, 779–787, 1998.
Mann, M. E.: Large-scale climate variability and connections with the Middle East in past centuries, Clim. Change, 55, 287–314, 2002.
Mann, M. E., Rutherford, S., Wahl, E., and Ammann, C.: Testing the fidelity of methods used in proxy-based reconstructions of past climate, J. Clim., 18, 4097–4107, 2005.
Mitchell, T. D. and Jones, P. D.: An improved method of construct-ing a database of monthly climate observations and associated high-resolution grids, Int. J. Climatol., 25, 693–712, 2005. Paeth, H. and Hense, A.: Mean versus extreme climate in the
Mediterranean region and its sensitivity to future global warm-ing conditions, Meteorologische Zeitschrift, 14, 329–347, 2005. Park, J. S., Jung, H. S., Kim, R. S., and Oh, J. H.: Modelling sum-mer extreme rainfall over the Korean peninsula using Wakeby distribution, Int. J. Climatol., 21, 1371–1384, 2001.
Pauling, A., Luterbacher, J., Casty, C., and Wanner, H.: Five hun-dred years of gridded high-resolution precipitation
reconstruc-tions over Europe and the connection to large-scale circulation, Clim. Dynam., 26, 387–405, 2006.
Pfister, C.: Wetternachhersage: 500 Jahre Klimavariationen und Naturkatastrophen (1496–1995), Verlag Haupt, Bern, 1999. Rutherford, S., Mann, M. E., Osborn, T. J., Bradley, R. S., Briffa,
K. R., Hughes, M. K., and Jones, P. D.: Proxy-based north-ern hemisphere surface temperature reconstructions: sensitivity to methodology, predictor network, target season and target do-main, J. Clim., 18, 2308–2329, 2005.
Robock, A.: The climatic aftermath, Science, 295, 1242–1244, 2002.
Steiner, D., Walter, A., and Zumb¨uhl, H.J.: The application of a non-linear back-propagation neural network to study the mass balance of Grosser Aletschgletscher, J. Glaciol., 51, 313–323, 2005.
Schaeffer, M., Selten, F. M., and Opsteegh, J. D.: Shifts of means are not a proxy for changes in extreme winter temperatures in climate projections, Clim. Dynam., 25, 51–63, 2005.
Sch¨ar, C., Vidale, P. L., L¨uthi, D., Frei, C., Haeberli, C., Liniger, M. A., and Appenzeller, C.: The role of increasing temperature variability in European summer heatwaves, Nature, 427, 332– 336, 2004.
Shindell, D. T., Schmidt, G. A., Mann, M. E., Rind, D., and Waple, A.: Solar forcing of regional climate change during the Maunder Minimum, Science, 294, 2149–2152, 2001.
Shindell, D. T., Schmidt, G. A., Mann, M. E., and Faluvegi, G.: Dynamic winter climate response to large tropical vol-canic eruptions since 1600, J. Geophys. Res., 109, D05104, doi:10.1029/2003J000415, 2004.
Touchan, R., Garfin, G. M., Meko, D. M., Funkhouser, G., Erkan, N., Hughes, M. K., and Wallin, B. S.: Preliminary reconstruc-tions of spring precipitation in southwestern Turkey from tree-ring width, Int. J. Climatol., 23, 157–171, 2003.
Touchan, R., Xoplaki, E., Funkhouser, G., Luterbacher, J., Hughes, M. K., Erkan, N., Akkemik, U., and Stephan, J.: Reconstruc-tions of spring/summer precipitation for the Eastern Mediter-ranean from tree-ring widths and its connection to large-scale atmospheric circulation, Clim. Dynam., 25, 75–98, 2005. Van den Brink, H. W., K¨onnen, G. P., Opsteegh, J. D., Van
Old-enborgh, G. J., and Burgers, G.: Estimating return periods of extreme events from ECMWF seasonal forecast ensembles, Int. J. Climatol., 25, 1345–1354, 2005.
Wanner, H., Pfister, C., Brazdil, R., Frich, P., Frydendahl, K., Jon-sson, T., Kington, J., Lamb, H.H., Rosenhorn, S., and Wishman, E.: Wintertime European circulation patterns during the Late Maunder Minimum cooling period (1675–1704), Theor. Appl. Climatol., 51, 167–175, 1995.
Wanner, H., Gyalistras, D., Luterbacher, J., Rickli, R., Salvisberg, E., and Schmutz, C.: Klimawandel im Schweizer Alpenraum, vdf Hochschulverlag AG an der ETH, Z¨urich, 2000.
Wanner, H., Br¨onnimann, S., Casty, C., Gyalistras, D., Luterbacher, J., Schmutz, C., Stephenson, D., and Xoplaki, E.: North Atlantic Oscillation – concepts and studies, Surv. Geophys., 22, 321–381, 2001.
Xoplaki, E., Maheras, P., and Luterbacher, J.: Variability of climate in meridional Balkans during the periods 1675–1715 and 1780– 1830 and its impact on human life, Clim. Change, 48, 581–615, 2001.
Xoplaki, E.: Climate variability over the Mediterranean, Ph.D. the-sis, University of Bern, Switzerland, 2002.
Xoplaki, E., Gonzalez-Rouco, J. F., Luterbacher, J., and Wanner, H.: Wet season Mediterranean precipitation variability: influence of large-scale dynamics and trends, Clim. Dynam., 23, 63–78, 2004.
Xoplaki, E., Luterbacher, J., Paeth, H., Dietrich, D., Steiner, N., Grosjean, M., and Wanner, H.: European spring and autumn temperature variability and change of extremes over the last half millennium, Geophys. Res. Lett., 32, L15713, doi:10.1029/2005GL023424, 2005.
Yoshimori, M., Stocker, T. F., Raible, C. C., and Renold, M.: Exter-nally forced and internal variability in ensemble climate simula-tions of the Maunder Minimum, J. Clim., 18, 4253–4270, 2005. Zhang, X., Zwiers, F. W., and Li, G.: Monte Carlo experiments
on the detection of trends in extreme values, J. Clim., 17, 1945– 1952, 2004.
Zumb¨uhl, H. J.: Die Schwankungen der Grindelwaldgletscher in den historischen Bild- und Schriftquellen des 12. bis 19. Jahrhunderts. Ein Beitrag zur Gletschergeschichte und Erforschung des Alpenraumes, Denkschriften der Schweiz-erischen Naturforschenden Gesellschaft (SNG), Birkh¨auser, Basel/Boston/Stuttgart, Band 92, 1980.
Zumb¨uhl, H. J., Messerli, B., and Pfister, C.: Die kleine Eiszeit: Gletschergeschichte im Spiegel der Kunst, Katalog zur Sonder-ausstellung des Schweizerischen Alpinen Museums Bern und des Gletschergarten-Museums Luzern vom 09.06.–14.08.1983 (Luzern), 24.08.–16.10.1983 (Bern), 1983.
Zumb¨uhl, H. J. and Holzhauser, H.: Alpengletscher in der Kleinen Eiszeit. Sonderheft zum 125j¨ahrigen Jubil¨aum des SAC, Die Alpen, 64(3), 129–322, 1988.
![Fig. 1. European winter (DJF) precipitation anomaly maps [mm] relative to 1951–2000. The left panels show modern winters that have been very dry in the region marked by the black rectangles](https://thumb-eu.123doks.com/thumbv2/123doknet/14794890.603266/3.892.70.841.91.825/european-winter-precipitation-anomaly-relative-panels-winters-rectangles.webp)