HAL Id: hal-00301853
https://hal.archives-ouvertes.fr/hal-00301853
Submitted on 18 Oct 2005HAL is a multi-disciplinary open access
archive for the deposit and dissemination of sci-entific research documents, whether they are pub-lished or not. The documents may come from teaching and research institutions in France or abroad, or from public or private research centers.
L’archive ouverte pluridisciplinaire HAL, est destinée au dépôt et à la diffusion de documents scientifiques de niveau recherche, publiés ou non, émanant des établissements d’enseignement et de recherche français ou étrangers, des laboratoires publics ou privés.
The characterisation of pollution aerosol in a changing
photochemical environment
M. J. Cubison, M. R. Alfarra, J. Allan, K. N. Bower, H. Coe, G. B.
Mcfiggans, J. D. Whitehead, P. I. Williams, Q. Zhang, J. L. Jimenez, et al.
To cite this version:
M. J. Cubison, M. R. Alfarra, J. Allan, K. N. Bower, H. Coe, et al.. The characterisation of pollution aerosol in a changing photochemical environment. Atmospheric Chemistry and Physics Discussions, European Geosciences Union, 2005, 5 (5), pp.10055-10096. �hal-00301853�
ACPD
5, 10055–10096, 2005 Characterisation of pollution aerosol M. J. Cubison et al. Title Page Abstract Introduction Conclusions References Tables Figures J I J I Back Close Full Screen / EscPrint Version
Interactive Discussion
EGU Atmos. Chem. Phys. Discuss., 5, 10055–10096, 2005
www.atmos-chem-phys.org/acpd/5/10055/ SRef-ID: 1680-7375/acpd/2005-5-10055 European Geosciences Union
Atmospheric Chemistry and Physics Discussions
The characterisation of pollution aerosol
in a changing photochemical environment
M. J. Cubison1,*, M. R. Alfarra1,**, J. Allan1, K. N. Bower1, H. Coe1,
G. B. McFiggans1, J. D. Whitehead1, P. I. Williams1, Q. Zhang2, J. L. Jimenez2, J. Hopkins3, and J. Lee3
1
School of Earth, Atmospheric and Environmental Science, University of Manchester, Manchester, UK
2
Dept. of Chemistry and Biochemistry and Cooperative Institute for Research in Environmental Sciences (CIRES), University of Colorado, Boulder, CO, USA 3
Dept. of Chemistry, University of York, Heslington, York, UK *
now at: Cooperative Institute for Research in the Environmental Sciences, University of Colorado, Boulder, CO, USA
**
now at: Laboratory for Atmospheric Chemistry, Paul Scherrer Institute, Villigen, Switzerland. Received: 11 July 2005 – Accepted: 1 August 2005 – Published: 18 October 2005
Correspondence to: M. J. Cubison ([email protected])
ACPD
5, 10055–10096, 2005 Characterisation of pollution aerosol M. J. Cubison et al. Title Page Abstract Introduction Conclusions References Tables Figures J I J I Back Close Full Screen / EscPrint Version
Interactive Discussion
EGU Abstract
Measurements are presented from a sampling location 50 km downwind of Greater London, UK, to investigate the timescales required for the atmospheric transformations of aerosol in urban emissions plumes in the context of photochemical age based on the benzene to toluene ratio. It is shown that particles at or around 100 nm in diameter
5
exhibit the greatest systematic variability in chemical properties, and thus hygroscopic properties, on a timescale of 1–2 days. The smaller Aitken mode and larger accumula-tion mode particles exhibit less variability on these timescales, which we propose is as a result of their different residence times in the atmosphere. The larger accumulation particles have been in the atmosphere longer than the 100 nm particles and their
chem-10
istry and hygroscopic properties have been integrated over several days and potentially over several source regions. In contrast, the smaller Aitken mode particles show little systematic variability with photochemical age because their atmospheric lifetimes are short, thus chemical changes and hence changes in water affinity have not had time to occur. Increases in the particle diameter of up to 40% are observed at 90% relative
15
humidity in the accumulation mode from the uptake of water as the particles become increasingly soluble in nature.
1. Introduction
Understanding the nature and transformations of chemical and physical properties of atmospheric aerosol is important to quantify the effect of aerosol on human health and
20
climate change. Epidemiological studies have shown that an increase in the mass concentration of atmospheric particulate matter (PM), usually measured with diameter cut-offs of either 2.5 or 10 µm diameter (PM2.5 and PM10), from average background levels leads to an increase in premature mortality and morbidity in the case of both short- and long-term exposure (e.g. Pope et al., 1992; Wilson and Spengler, 1996;
25
ACPD
5, 10055–10096, 2005 Characterisation of pollution aerosol M. J. Cubison et al. Title Page Abstract Introduction Conclusions References Tables Figures J I J I Back Close Full Screen / EscPrint Version
Interactive Discussion
EGU et al.,2001;Neuberger et al.,2004;Ghio and Devlin,2001), surface area (Neuberger
et al.,2002;Moshammer and Neuberger,2003;Zimmer,2002), number concentration (Penttinen et al.,2001;Donaldson et al.,1998;Sydbom et al.,2001) and diameter (Kim and Jaques,2000) have all been linked with adverse health effects.
The impact of aerosols remains the largest uncertainty in the radiative forcing of
5
climate (IPCC,2001). The size increase of aerosol particles resulting from uptake of water vapour has important implications for both the aerosol direct and indirect effects. In their 2001 report, the IPCC proposed that the aerosol size distribution, change in size with relative humidity and solubility were the most important parameters to be studied in understanding of the impact of aerosol on the atmospheric radiation budget.
10
In the ambient atmosphere, the actual observed physical and chemical properties of aerosol vary greatly between locations and times (see e.g. van Dingenen et al., 2004;Putaud et al.,2004;O’Dowd et al.,2004;Reddy and Boucher,2004). Ambient roadside sampling shows the presence of a mass mode of median diameter between 20 and 30 nm (e.g. Alfarra et al., 2004) but also a significant contribution, even so
15
close to source, of particulate from the regional background. The separation of the contribution to the aerosol distribution from fresh emissions and the background distri-bution has also been frequently observed in studies of the hygroscopic properties of aerosol using the Hygroscopic Tandem DMA instrument (Rader and McMurry,1986). Such studies usually report the hygroscopicity of particles as the ratio of their
mobil-20
ity diameter at an elevated relative humidity, RH, to their dry diameter, known as the hygroscopic growth factor, gRH; typically the elevated relative humidity is 90%, g90. Many previous studies have shown an omnipresent background distribution of soluble particles of varying hygroscopicity with g∼1.4–1.8, generally referred to as the more-hygroscopic mode, which is observed in environments as diverse as urban areas (
Mc-25
Murry and Stolzenburg,1989;Svenningsson et al.,1992;Zhang et al.,1993;Trakumas et al.,1995;McMurry et al.,1996;V ¨akev ¨a et al.,2002;Cocker et al.,2001), continental background sites (Zhang et al.,1993;Svenningsson et al.,1994;Swietlicki et al.,1999; V ¨akev ¨a et al.,2002;Zhou et al.,2002) and marine locations (Covert and Heintzenberg,
ACPD
5, 10055–10096, 2005 Characterisation of pollution aerosol M. J. Cubison et al. Title Page Abstract Introduction Conclusions References Tables Figures J I J I Back Close Full Screen / EscPrint Version
Interactive Discussion
EGU 1993;Berg et al.,1998;Swietlicki et al.,1998, 2000;Maßling et al.,2003). McMurry
et al. (1996) showed that in urban areas, a less-hygroscopic mode comprised of car-bonaceous chain agglomerates (plus any volatile organic compounds that may have evaporated in the tunneling electron microscope beam) was externally mixed with the commonly observed more-hygroscopic mode, which consisted of spherical soluble
par-5
ticles containing a large inorganic component. The attribution of the less-hygroscopic mode to freshly emitted particles has been made by a number of other urban studies (e.g.Swietlicki et al.,1999;V ¨akev ¨a et al.,2002;Cocker et al.,2001).
The properties of the organic particulates from urban emissions (e.g. traffic) can be altered through physical and chemical processes in the atmosphere. Dilution,
con-10
densation and coagulation all have potential to influence the aerosol properties in the urban plume as it is advected away from the source region. Chemical processing of the material in the particulate phase may add significantly to the particle mass if reac-tive or catalysed uptake of volatile material occurs (e.g.Claeys et al.,2004;Limbeck et al.,2003). Even if significant addition of particle mass does not occur through this
15
route, particle phase chemical processes may make the particles more accessible to subsequent condensation of material from the gas phase, for example by changing the associated water on the particle. Many previous modeling studies have attempted to understand the effects of these different processes on the aerosol distribution (see e.g. Pich et al.,1970;Lee,1983;Barrett and Clement,1988;Kulmala et al.,1989;Williams,
20
1995;Jacobson,1999;Park and Lee,2000;Park et al.,2001;Kulmala,2003;Kulmala et al., 2004a). Some studies estimate that the transfer of organic carbon from hy-drophobic to hygroscopic occurrs in the order of 2–3 days (Reddy and Boucher,2004; Cooke et al.,2002), and in general, the residence time of black carbon and organic matter in the atmosphere is a function of its hygroscopicity (Cooke et al.,2002),
indi-25
cating that the hygroscopicity of particles in the atmosphere depends on the chemical nature of the organic aerosol component. However, there is increasing evidence that the solubility of particles in the atmosphere is really controlled by the ratio of inorganic to organic material. McFiggans et al. (2005a) report predictions of the hygroscopic
ACPD
5, 10055–10096, 2005 Characterisation of pollution aerosol M. J. Cubison et al. Title Page Abstract Introduction Conclusions References Tables Figures J I J I Back Close Full Screen / EscPrint Version
Interactive Discussion
EGU growth factor, g, given by a newly developed multi-component thermodynamic
hygro-scopicity framework, the Aerosol Diameter Dependent Equilibrium Model (ADDEM) (Topping et al.,2004a,b). Contributions to g from organic components are shown to be less than 1.1, in comparison to the measured growth of ∼1.7 from sulphate/nitrate. Atmospheric observations of g>1.1 for the less-hygroscopic mode therefore imply that
5
even these particles exhibit a hygroscopicity that even an oxidised organic component cannot achieve. McFiggans et al. (2005a) conclude that, so far as water affinity in the subsaturated regime is concerned, an atmospherically realistic amount of oxidised organic material will only make a minor contribution to water content.
Regardless of the controlling processes, understanding the time scales of
transfor-10
mations of atmospheric aerosol is important for modeling climate change and assess-ing regional air quality. More soluble particles have a greater impact on the global radi-ation budget than hydrophobic particles by increasing the aerosol direct effect. More-hygroscopic particles also make more efficient cloud condensation nuclei (Weingartner et al.,1997) thus the ageing of particles also influences the aerosol indirect effect.
15
This work uses an experimental approach to investigate the timescales of the trans-formations of urban aerosol plumes using an extensive suite of aerosol- and gas-phase instrumentation at an urban background site.
2. Methods
An advanced suite of aerosol instrumentation was deployed as part of a large,
two-20
part experimental campaign during the summer of 2003 and spring of 2004. The first Tropospheric Organic Chemistry (TORCH) experiment was located 50 km north-east of London, UK, with continuous measurements made throughout August 2003, and will form the data set discussed in this study. This location was chosen to sample the pollution plume advected from London by the prevailing southwesterly wind with an air
25
mass age of between 2 to 24 h, in order to study the photochemical processing of the gas and aerosol-phase components of the ambient air.
ACPD
5, 10055–10096, 2005 Characterisation of pollution aerosol M. J. Cubison et al. Title Page Abstract Introduction Conclusions References Tables Figures J I J I Back Close Full Screen / EscPrint Version
Interactive Discussion
EGU The TORCH 1 sampling site was located at Writtle Agricultural College, near
Chelms-ford, Essex, UK, 50 km northeast of London and therefore downwind of the London emissions plume under prevailing wind conditions. Between the edge of the London urban area and the sampling site the terrain is largely flat, arable land free from major pollution sources. The site was chosen such that the local region was free from local
5
pollution sources for a large variation in the local wind vector, with only the easterly sector influenced by a significant local emissions profile. The site could therefore sam-ple a representative pollution plume advected from the London area without influence from local emissions.
Sampling of meteorological, gas- and aerosol-phase measurements was conducted
10
from the top of a 10 m high tower constructed on site. Access to the tower was re-stricted to avoid interference with the measurements. Local meteorology was deter-mined by Vaisala humidity and temperature probes, and a R.M. Young sonic anemome-ter measured the 3-D wind field at 20 Hz. In addition, a back trajectory analysis of the origins of the air masses arriving at the site was carried out at 12-hourly intervals,
de-15
picting the path taken by the air mass reaching the sampling site over the previous five days. The back trajectories were run using the on-line HYSPLIT model developed by the National Oceanic and Atmospheric Administration (NOAA) together with wind field archive data from the European Centre for Medium Range Weather Forecasts (ECMWF). The destination location was 500 m vertically above the TORCH 1 sampling
20
site at Writtle College, with points along the trajectory determined every 2 h.
A comprehensive suite of instruments from several universities was employed to monitor a large number of gas phase components during the TORCH campaign. Species measured included Ozone (with a TECO TEI49C UV ozone analyser), NO (using a TECO TEI42 trace level chemiluminescence analyser to measure NO), the
25
latter includes a Mo catalyst to convert NO2 to NO to a derive a measure of NOx but thermally unstable oxides of nitrogen such as PAN may also be converted. A vast array of volatile organic carbon (VOC) measurements were made using 1-D and 2-D Gas-Chromatography Mass-Spectometry (GC-MS and GCxGC-MS) (Lewis et al.,
ACPD
5, 10055–10096, 2005 Characterisation of pollution aerosol M. J. Cubison et al. Title Page Abstract Introduction Conclusions References Tables Figures J I J I Back Close Full Screen / EscPrint Version
Interactive Discussion
EGU 1996, 2000; Lee et al.,2001; Hopkins et al., 2003). Measurements from these and
other instruments shall form the basis of forthcoming published work and shall not be presented in detail here.
Measurement of aerosol from the top of a 10 m sampling tower poses significant dif-ficulties, owing to effects such as Brownian coagulation and diffusion losses to the wall
5
(Alonso et al.,1999;Malet et al.,2000). To minimise these effects, a specifically de-signed sampling stack drew aerosol down a 30 cm diameter plastic tube to laboratory level, where they were iso-kinetically sub-sampled into a 8 cm diameter stainless steel tube leading to the laboratory. The separate instruments further sub-sampled in an identical iso-kinetic fashion through their own respective sample lines. In this work, the
10
flow rate in the main stack gave a Reynolds nunber of 103, such that diffusional losses for sub-micron particles were minimal above 5 nm diameter. The steel sub-sampling tube minimises electro-diffusive losses of charged aerosol, and helps to maintain the tube walls at the same temperature as the air flow to avoid wall condensation and pos-sible condensational growth of the aerosol (Barrett and Baldwin,2001,2000). Through
15
these considerations, errors arising from aerosol losses are minimised, and an identical aerosol distribution is delivered to each instrument.
The aerosol number size distribution was measured from 3 nm to 32 µm by a Dif-ferential Mobility Particle Sizer (DMPS) (Williams et al.,2000), which uses two paral-lel Differential Mobility Analysers (DMA) coupled to Condensational Particle Counters
20
(CPC, TSI Models 3010 and 3025A) to classify and count the particles according to their size, and an Optical Particle Counter (OPC, Grimm model 1.109). The DMPS instrument was operational from the beginning of the campaign through to 16 August, with the exception of a problem with one of the CPCs on the 7 August and the power cut on the 11th. After 16 August only size information for particle diameters greater
25
than 30 nm is available due to a problem with the CPC used to measure the ultrafine particles. The OPC was operational from 2 August through to the end of the campaign, except for a power cut on the 11 August.
ACPD
5, 10055–10096, 2005 Characterisation of pollution aerosol M. J. Cubison et al. Title Page Abstract Introduction Conclusions References Tables Figures J I J I Back Close Full Screen / EscPrint Version
Interactive Discussion
EGU Spectrometer (AMS) (Jayne et al.,2000), which measured size-resolved mass spectra
in the range 30 nm to ∼1 micron. The AMS uses an aerodynamic lens to focus the par-ticles into a narrow beam, a roughened cartridge heater to vapourise them under high vacuum, and a quadrupole mass spectrometer to analyse the vapourised molecules. Particle size is measured via particle time-of-flight. The AMS is operated in two modes:
5
(1) a continuous mass spectrum mode without size information; and (2) a size distri-bution measurement mode for selected m/z settings of the quadrupole. More detailed descriptions of the AMS instrument are available inJayne et al.(2000);Jimenez et al. (2003); Drewnick et al. (2004), and a detailed description of the analysis technique, including separation of the data from the fresh emissions and background modes, is
10
given byAllan et al.(2003a,2004b).
Data coverage from the AMS was complete at 10-min resolution from 30 July to 6 August inclusive, whereafter resolution was decreased to 2 h due to experiments being carried out investigating the performance of the instrument. A large gap in data coverage exists on 11 to 14 August inclusive due to the power cut and subsequent
15
operational difficulties. A measurement of total particle number concentration in the range 3 nm to 1 micron was made in parallel to the AMS measurements using a CPC. The hygroscopicity of the particle population was measured at dry particle diameters of 27, 40, 60, 89, 137, 217 and 360 nm using a HTDMA (Cubison et al.,2005). The hy-groscopic growth factor determined at 90% relative humidity (RH), g90, was measured
20
at these dry diameters at an hourly resolution. In addition, plots of gRH vs. RH, known as humidograms, determined the hydration and dehydration properties of the aerosol, over a large range of RH, at one or two different dry sizes for each qualitative change in sampled air mass.
Gaps in the time-series data set arise from determination of humidograms,
incor-25
rect RH values (usually owing to temperature fluctuations in the laboratory) and power failures on site. During the period from 13 to 19 August only the 89 nm dry size was measured due to a failed DMA voltage supply.
ACPD
5, 10055–10096, 2005 Characterisation of pollution aerosol M. J. Cubison et al. Title Page Abstract Introduction Conclusions References Tables Figures J I J I Back Close Full Screen / EscPrint Version
Interactive Discussion
EGU 2.1. Elimination of local influences
Given the aim of this study to investigate the atmospheric transformations of aerosol transported from a source region outside the local area, it is necessary, before analy-sis, to eliminate from the data set those periods under the influence of local sources. It is required that the measurements represent an advected air mass, and are not
dom-5
inated by local emissions or processes such as in situ cloud scavenging, which can significantly alter the aerosol population during overnight periods of fog. The technique employed here uses a set of boolean arrays, or flags, the application of each of which removes all the data at those points in time which do not meet the conditions specific to that array. Flags were set up (but not necessarily applied) to eliminate data in the
10
following circumstances: (1) when the measured value of NOx deviated by more than 20% from the 10 min average data. This was used to remove data under the influence of local sources, e.g. passing vehicles; (2) when the local wind vector implied the sam-pling location was directly downwind of the site generator (easterly sector); (3) when the local wind speed was less than 1.5 ms−1. This was used to eliminate periods when
15
local sources may have been influencing the sampling site; (4) when the local wind vector was not in the SW quarter. This is useful for considering those measurements which had been advected from London; (5) during the night – eliminated all data from sunset to sunrise; and (6) when the air was deemed to be stratified, and therefore the sampling location was not under the influence of advected air, but in a locally-influenced
20
air layer. Quantification of the stratification of the air mass was achieved by using the Monin-Obukhov length, L, which describes the ratio of the horizontal wind vector to the vertical heat flux (Monin and Obukhov, 1954). At night, the vertical heat flux often tends to zero, generating highly stratified layers in the atmosphere near the ground. This reduces advection and hence the sampling stack is dominated by local sources
25
emitting into the stratified layer closest to ground level.
In all cases, the local source flags, that is 1) NOx, 2) generator, 3) wind speed and 6) Monin-Obukhov length were applied when analysing the data. The night-time flag
ACPD
5, 10055–10096, 2005 Characterisation of pollution aerosol M. J. Cubison et al. Title Page Abstract Introduction Conclusions References Tables Figures J I J I Back Close Full Screen / EscPrint Version
Interactive Discussion
EGU was applied for all the data analysis procedures, principally because at night, the NO3
radical dominates the chemistry of the troposphere, leading to the production of N2O5, which is rapidly converted to nitric acid in the aqueous phase in the presence of water vapour. Scavenging processes such as these dominate over photochemical transfor-mations occuring during advection in periods of fog. Night-time data was thus not
5
considered directly relevant to the study objectives of this work and excluded from analysis.
3. Photochemical age of air masses
Changes in observed aerosol properties are examined as a function of photochemical age of the sampled air mass using two different methods. It is noted that the
pho-10
tochemical age of an air mass is different from the actual transport time required to advect an air mass from a source region to the sampling site, which may, for example, occur during darkness and therefore have little impact from photochemical reactions. Firstly, we consider distinct time periods within the TORCH 1 project time frame for which the air masses sampled have both different source regions and exposure to
dif-15
fering degrees of photochemical transformation. Secondly, we present the changes in the observed properties as a function of age through classification of the photochem-ical lifetime of the air mass using VOC ratios. Analysis of the VOC profiles in different air masses allows investigation into the timescales over which aerosol age.
The use of VOC ratios in making estimates of the photochemical age of an air mass
20
has been reported in the literature for some time (Calvert,1976;Roberts et al.,1984; McKeen et al.,1996;Parrish et al.,1992;McKeen and Liu,1993;Rudolph and Czuba, 2000;Kleinmann et al.,2003). The principle is straightforward although in practice it is difficult to apply, as it requires detailed knowledge of oxidant levels along the air mass trajectory which is seldom available.
25
At the point of emission, VOCs have characteristic concentration ratios depending on the type of emission source (Kleinmann et al.,2003). Downwind of this source,
con-ACPD
5, 10055–10096, 2005 Characterisation of pollution aerosol M. J. Cubison et al. Title Page Abstract Introduction Conclusions References Tables Figures J I J I Back Close Full Screen / EscPrint Version
Interactive Discussion
EGU centration ratios change as the more reactive compounds are preferentially removed
by oxidation. Reaction loss depends on photochemical age, defined here as the time integrated exposure to the OH radical. This is a simplified case; it would be necessary to include losses from reactions with O3and NO3if their reaction rate constants and/or concentrations were competitive with the OH loss.
5
In the ideal case, VOCs are emitted into clean air from a single point emission source of a known ratio, reaction is only with the OH radical, no diffusion occurs during trans-port so there is a unique, well-defined travel time, and background air has a negligible VOC concentration (Rudolph and Johnen,1990). In this case, with negligible dilution, the concentrations of a VOC species i can be described as:
10
Ci(t)= Ci(0)e−ki[OH]t. (1)
Dilution in the atmosphere will tend to decrease the concentration of both VOCs, but this is difficult to model so here it is assumed that both species maintain the same footprint and dilute at the same rate, therefore allowing it to be neglected. Hence, if we know the starting ratio of two VOC species, i and j, given by R0=Ci(0)/Cj(0), by
15
using an estimate of OH concentration and kinetic rate constants from the literature, it is possible to estimate the photochemical age of the air mass, tph, based on the measured VOC ratio Rt=Ci(t)/Cj(t):
tph= ln(Rt/R0)
(kj− ki)[OH]. (2)
In this work, the VOC ratio employed is benzene/toluene, as their emission profiles are
20
well-described and reflect the vehicular emissions that form a principal pollution source in the upwind emission area. Measurements of the ratio of benzene/toluene have been made in many locations, some of which are reviewed byRoberts et al.(1984). In this work, we use initial ratios taken from the London Wide Benzene Diffusion Tube Survey Annual Report of 2002, which found mean benzene/toluene ratios for central London
25
ACPD
5, 10055–10096, 2005 Characterisation of pollution aerosol M. J. Cubison et al. Title Page Abstract Introduction Conclusions References Tables Figures J I J I Back Close Full Screen / EscPrint Version
Interactive Discussion
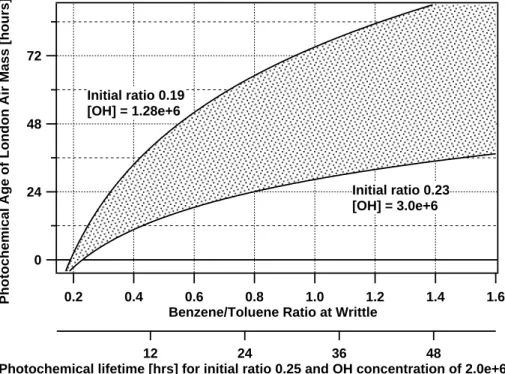
EGU Figure 1 shows the calculated photochemical age using Eq. (2), rate constants for
benzene and toluene reactions with OH from the literature (Atkinson,1994) and a range of OH concentrations and initial ratios. The initial ratios range from 0.19 to 0.23 as re-ported above. OH concentrations were measured at the field site, with a mean average for the project of 1.28×10⁶molecules/cm3. However,Heard et al.(2004) performed a
5
detailed study of OH concentrations in the major city of Birmingham, UK, which reports summer day-time concentrations between 2 and 3×10⁶molecules/cm3. It is possible that the values of OH measured at the site were lower than those over London, so life-time calculations have to take into account an appropriate range of values. The shaded area in the figure represents the range of values calculated using the ratios mentioned
10
above, with a range of OH concentration from 1.28 to 3×10⁶molecules/cm3.
4. Air mass characterisation
Three distinct time periods were chosen within the TORCH 1 project time frame for which the air masses sampled have both different source regions and exposure to differing degrees of photochemical transformation. Other periods were identified within
15
the project timeframe, but were not suitable for analysis for a combination of reasons: i) The conditions were not constant over a significant time period; ii) Data coverage was not sufficient to perform analysis; iii) Local sources influenced the measurements, so a study of advected air could not be undertaken. The periods chosen were: 1) Atlantic South Westerly (AtlSW) – 28 July to 1 August inclusive; 2) European Anticyclonic Event
20
– 6 to 10 August inclusive; and 3) Arctic Source (with local influences) – 26 to 30 August inclusive.
The first period represents the only time in the campaign where a steady south west-erly flow was observed for a significant length of time. The air mass has resided over the Atlantic Ocean for the previous 5 days prior to advection to the site over Greater
25
London. As a result, the air mass at the sampling site represented clean marine air ex-posed to a large urban emissions plume, with potential for atmospheric transformations
ACPD
5, 10055–10096, 2005 Characterisation of pollution aerosol M. J. Cubison et al. Title Page Abstract Introduction Conclusions References Tables Figures J I J I Back Close Full Screen / EscPrint Version
Interactive Discussion
EGU occurring during advection from London.
The second time period, the European Anticyclonic Event (EuroStag), represents that part of project during which Northern Europe was dominated by a large, stagnant, anti-cyclonic weather system, and for which, as a result of this weather pattern, the air mass had been circling over Europe for a few days prior to reaching the sampling site.
5
This air mass had been both exposed to significant emissions and to a much greater degree of photochemical processing prior to sampling than in the AtlSW case. The period was dominated by hot, bright weather conditions, with temperatures reaching a maximum of 36◦C on 9 August. As a result, radical concentrations and rates of cycling were enhanced relative to the AtlSW period.
10
The final period selected came right at the end of the campaign and represents a period of Arctic influence, where the air reaching the sampling site had been advected from the Arctic region, traveling south over the North Sea, then finally over the rural region of East Anglia for about 200 km to the sampling location. This exposed clean marine air to small, local, intermittent emission sources for the few hours directly before
15
advection to the sampling site.
Representative back trajectories were used to give an indication of the source re-gions of the sampled air masses for each period, as shown in Fig.2.
Figure3shows the statistical variation observed in the benzene/toluene ratio for the three air masses. The lowest ratio is observed in the Atlantic South Westerly case,
in-20
dicating that this air mass has been exposed to significantly less photochemical trans-formation than in the European Anticyclonic event or the Arctic source air mass. 4.1. Size distribution
Figure 4 shows a time series of the dry particle size distribution measured by the DMPS. During the Atlantic South Westerly, the distribution is changeable, but in general
25
the highest concentrations are found in the Aitken mode between a mobility diameter of 10 and 50 nm. In contrast, during the Anticyclonic period the particles exhibit a more intermittent, broader distribution. Fresh traffic emissions are predominantly in
ACPD
5, 10055–10096, 2005 Characterisation of pollution aerosol M. J. Cubison et al. Title Page Abstract Introduction Conclusions References Tables Figures J I J I Back Close Full Screen / EscPrint Version
Interactive Discussion
EGU the Aitken mode (Kittelson, 1998), which could explain the dominance of the Aitken
mode during the Atlantic South Westerly situation at the TORCH sampling site. These observations broadly agree with previous studies on aerosol size distribution (many of which are collated in van Dingenen et al., 2004), and give evidence that a single source of urban generated particles is dominating the distribution during the Atlantic
5
South Westerly situation. 4.2. Hygroscopic properties
Figure5shows individual growth factor distributions during the Atlantic South-Westerly and European Anticyclonic periods for the 7 dry diameters measured. These have been retrieved using the Optimal Estimation Method (OEM) software described by
10
Cubison et al. (2005), which attempts to eliminate the effect of the HTDMA transfer function during the inversion process. The OEM combines a weighted mean of the measurements and a best estimate, a priori, distribution to return contributions to the true atmospheric growth factor distribution in optimally-separated bins, in this work sep-arated by g∼0.2. A retrieved distribution showing contributions in only one bin therefore
15
reflects a narrow growth mode where the particles exhibit values of g that differ by less than the resolution of the instrument. In contrast, a retrieval showing contributions in several bins reflects a broad atmospheric growth factor distibution. The plots in Fig.5 show both all the individual contributions to the atmospheric growth factor distribution over the AltSW or Anticyclonic period (left), and representative individual
measure-20
ments in time (right).
In both periods, the hygroscopicity of the soluble, more-hygroscopic particles in-creases with increasing particle diameter, consistent with results from previous studies (e.g.Swietlicki et al.,1999). For particles between 89 and 360 nm diameter, the distri-butions are generally bi-modal during the south-westerly period, with an external
mix-25
ture of both less- and more-hygroscopic modes. The individual distributions highlight these observations, showing contributions to the hygroscopic growth factor distribu-tion in more than one growth factor bin. However, during the anticyclonic period, for
ACPD
5, 10055–10096, 2005 Characterisation of pollution aerosol M. J. Cubison et al. Title Page Abstract Introduction Conclusions References Tables Figures J I J I Back Close Full Screen / EscPrint Version
Interactive Discussion
EGU a given point in time, the growth factor distribution is narrow and monomodal, and
ex-hibits greater temporal variability in the model growth factor than in the south-westerly period.
In summary, there is a change from externally mixed aerosol to a more internally mixed state when changing from air masses having experienced relatively fresh
injec-5
tion of pollution (London area, 50 km upwind) to those well removed from local sources. The more-hygroscopic mode presents some variations in its hygroscopicity, but does not appear to radically change between the air masses. The omnipresent nature of the more-hygroscopic mode during the TORCH campaign reflects the common observa-tion of such a mode in the hygroscopicity at many previous studies at diverse locaobserva-tions
10
(e.g.V ¨akev ¨a et al.,2002;Cocker et al.,2001;Zhou et al.,2002;Swietlicki et al.,2000) 4.3. Chemical composition
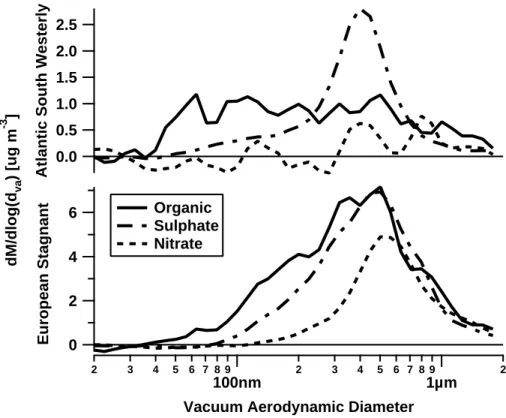
The average size-resolved chemical composition was ascertained using the AMS, as shown in Fig.6.
Both the south-westerly and anticyclonic periods exhibit a mixed organic-inorganic
15
mass mode at a vacuum aerodynamic diameter of dv a∼500 nm, although the mass loadings are significantly higher in the anticyclonic case. Here, there is a shoulder visi-ble in the organic mass distribution towards the smaller sizes, but as the AMS measures the ensemble particle population, it is difficult to state with certainty that this represents an externally mixed organic mode. It could also be that the variation in composition
20
with size is a reflection of the changing composition as the particles increase in size with age in the atmosphere. The single mode observed in the HTDMA during this pe-riod is also suggestive of an internally mixed state. However, in the south-westerly, the external mixture visible in the HTDMA measurements is represented in the AMS by an externally mixed organic mode visible at the smaller diameters, indicative of fresh
25
urban emissions.
Measurements of a broad mixed organic-inorganic mode were observed at 600– 700 nm aerodynamic diameter in Manchester city centre (Allan et al., 2003b) and
ACPD
5, 10055–10096, 2005 Characterisation of pollution aerosol M. J. Cubison et al. Title Page Abstract Introduction Conclusions References Tables Figures J I J I Back Close Full Screen / EscPrint Version
Interactive Discussion
EGU 400–600 nm aerodynamic diameter in Vancouver, Canada and Pittsburgh, USA (
Al-farra et al.,2004;Zhang et al.,2005b), all of which were attributed to advection of PM from the regional area. Distributions displaying a small diameter organic mode in addi-tion to a mode attributed to the regional PM distribuaddi-tion are often visible during urban measurements (e.g.Allan et al.,2003b), although the mass loadings expected in city
5
centre locations would be much higher than observed in the south-westerly air mass at TORCH. Thus, whilst the shape of the size resolved chemical composition remains largely unchanged during advection from London to the sampling site (a timescale of ∼2–4 h), processes such as dispersion are acting to decrease the absolute mass loadings of the urban generated mode. The influence of the urban organic and mixed
10
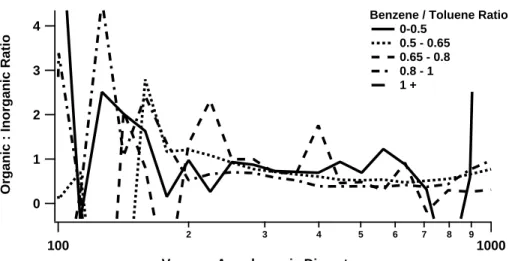
organic-inorganic modes was shown to be size-dependent during the TORCH project. Processes such as dispersion are acting to decrease the absolute mass loadings of the urban generated mode. The influence of the urban organic and mixed organic-inorganic modes was shown to be size-dependent during the TORCH project. Figure7 shows the organic to inorganic mass ratio as a function of vacuum aerodynamic
parti-15
cle diameter during the Anticyclonic period, indicating that the influence of the organic component decreases with increasing particle diameter. This indicates that as the lifetime of aerosol in the atmosphere increases the inorganic:organic ratio increases. Thus the increase in solubility of the particles observed with increasing diameter may result from the observed increase in inorganic fraction with particle size. Similar
anal-20
ysis proved difficult to compute in the AtlSW period owing to the lower mass loadings and therefore increased counting statistics error. Atmospheric processes such as con-densation act to increase particle size, thus these results indicate a reduced influence on the particle mass from organics under the impact of atmospheric processing, as it appears that the production of secondary organic aerosol occurs faster than the
con-25
version of SO2 to sulphate. Therefore the hygroscopicity may be controlled by the source contributions of these species along the history of the air parcel, for they deter-mine the inorganic:organic mass ratio.
ACPD
5, 10055–10096, 2005 Characterisation of pollution aerosol M. J. Cubison et al. Title Page Abstract Introduction Conclusions References Tables Figures J I J I Back Close Full Screen / EscPrint Version
Interactive Discussion
EGU explained if either the Anticylonic period experiences a different source profile, or if
at-mospheric processing is acting to transform the source mass profile in some way. The results in Fig.7 infer that atmospheric processing does act to alter the source profile, and indeed a broadly similar source profile would be expected for an air mass pass-ing over London and one exposed to multiple urban sources over Western Europe.
5
This points to atmospheric processing impacting on the aerosol mass distribution over time, however in the AtlSW case there has not been sufficient time for processes to result in significant changes in the observations. For aerosol species such as sulphate which are known to originate from hetergeneous reactions involving gas-phase presur-sors (see e.g. Luria and Sievering, 1991), the differences in the mass distributions
10
between the two periods do indicate that photochemical conversions are taking place on a time scale equivalent to the photochemical lifetime of the European Anticyclonic event, i.e. about 1 or 2 days.
4.4. Organic speciation
A recent development in analysis of AMS measurements is the ability to split the
con-15
tribution to the observed organic loading into hydrocarbon-like organic aerosol (HOA) and oxygenated (OOA) fractions (Zhang et al.,2005a). The AMS gives an ensemble mass spectrum for a large range of m/z’s, which can be used to segregate the contri-butions from the two fractions. Certain mass fragments, e.g. m/z 57, are indicative of hydrocarbon-like structures (typically C4H+9), whereas others, e.g. m/z 44, (typically the
20
CO+2 ion), only arise from oxygenated compounds (Alfarra et al.,2004). It is therefore possible to estimate the relative contributions from fresh emissions, which tend to be hydrocarbon-like in nature, and those organics which have been oxygenated through atmospheric transformations such as gas or particle phase photochemical reactions.
Figure 8shows the time series of the fraction of the organic mass observed in the
25
AMS which can be considered as HOA. During the Atlantic South-Westerly period ∼20% of the organics can be considered as HOA, although there are many high, short-lived peaks in the HOA fraction, probably arising from local sources. In contrast, the
ACPD
5, 10055–10096, 2005 Characterisation of pollution aerosol M. J. Cubison et al. Title Page Abstract Introduction Conclusions References Tables Figures J I J I Back Close Full Screen / EscPrint Version
Interactive Discussion
EGU HOA fraction observed during the anticyclonic period maintains relatively constant,
lower values. Similar analysis on AMS measurements taken in Manchester city centre shows a HOA fraction between approximately 20 and 50%. Neglecting the outliers during the south-westerly, the HOA fraction is somewhere between the city centre and anticyclonic values. Assuming that the HOA fraction in Greater London will be similar
5
to that of the urban Manchester measurements, the reduction in the HOA fraction may be due to either dilution or processing, through addition of oxygenated material onto the pollution aerosol. Given the absence of a hydrophobic mode in the background the latter is more likely.
5. Classification by VOC ratio
10
To improve the estimate of the required time scale for processing of the urban aerosol to the aged background state, it is necessary to analyse the data in a more selec-tive manner than categorisation by air mass. The approach taken here to determine mean average distributions of the hygroscopic properties and HOA/OOA components as a function of the benzene/toluene ratio. Through consideration of the observed
15
differences as the ratio increases, it is possible to determine the ratio at which the distributions match those of the ubiquitous continental background state.
5.1. Hygroscopic properties
The retrieved hygroscopic growth distribution was averaged according to the mean benzene/toluene ratio during the period of the HTDMA measurement. The results of
20
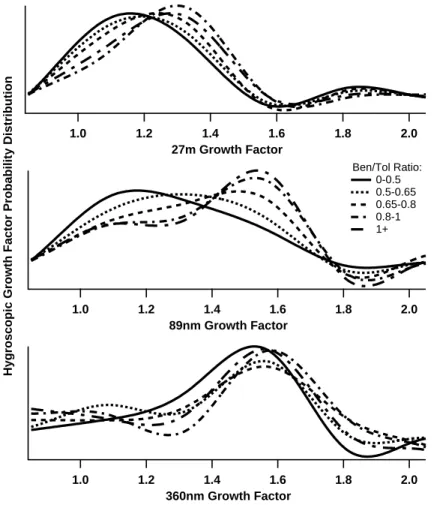
this analysis procedure for the duration of the campaign are shown in Fig.9.
At 27 nm dry diameter, the single less-hygroscopic mode increases in hygroscopicity with increasing VOC ratio, with a change in growth factor of ∼20% over the range of VOC ratios measured. There may also be an increase in the growth factor of the single more-hygroscopic mode observed at 360 nm, but it is not possible to state this
ACPD
5, 10055–10096, 2005 Characterisation of pollution aerosol M. J. Cubison et al. Title Page Abstract Introduction Conclusions References Tables Figures J I J I Back Close Full Screen / EscPrint Version
Interactive Discussion
EGU for certain within the resolution of the retrieval (∼0.18 in growth factor space). In the
89 nm case, the more-hygroscopic mode becomes more prominant with increasing VOC ratio. Below a benzene/toluene ratio of 0.65 the less-hygroscopic mode appears dominant, with the more-hygroscopic mode becoming apparent above a VOC ratio of about 0.8. This change represents a shift in mode diameter of the humidified particles
5
of 40%, from ∼100 nm to ∼140 nm.
The differences in the results of this analysis on the different particle dry diameters reflects the age of the particles within the atmosphere, with the 27 nm diameter par-ticles being younger than the 89 nm and the 360 nm diameter parpar-ticles already likely several days old, based on the modal diameter of the broad regional background mode
10
reported by Alfarra et al. (2004). The observation that the 89 nm diameter particles show a much more dynamic change with VOC ratio than at 360 nm or 27 nm may be a function of the range of photochemical age of the air masses observed. The 360 nm particles may be older than the most recent large scale injection of pollution, implied from the benzene/toluene ratios observed, whilst the 27 nm diameter particles may
15
have a lifetime representative of a benzene/toluene ratio less than 0.5. Thus the par-ticles at both diameters would show little or no change in solubility with the observed VOC ratio, whilst the 89 nm diameter particles may be several hours old in photochem-ical age, and thus of the same timescale as the VOC ratios.
Similar analysis performed just over the periods of the air masses described above
20
shows very similar results for the Atlantic South-Westerly situation, but no significant changes with VOC ratio in the European Anticyclonic event. This is probably due to the advection trajectories of the two different air masses. In the south-westerly air flow, initially clean air is advected over London to the site, so the VOC ratio more accurately reflects the photochemical age of the air mass than in the anti-cyclonic situation, where
25
multiple sources of all components may be contributing and thus it is more difficult to establish relationships to the aerosol behaviour.
ACPD
5, 10055–10096, 2005 Characterisation of pollution aerosol M. J. Cubison et al. Title Page Abstract Introduction Conclusions References Tables Figures J I J I Back Close Full Screen / EscPrint Version
Interactive Discussion
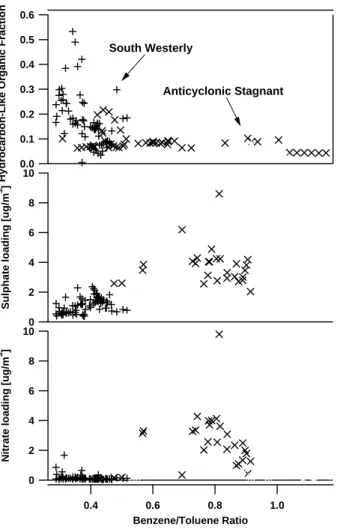
EGU 5.2. HOA and OOA
The top plot in Fig.10 shows the correlation between the hydrocarbon-like fraction of the organic aerosol content and the benzene/toluene VOC ratio. The negative corre-lation at low VOC ratios levels out at a benzene/toluene concentration of ∼0.6. From Fig.1, this corresponds to a photochemical age of about 1 or 2 days.
5
Prior to this timescale, the measurements indicate that a gradually larger fraction of the aerosol organic content is oxygenated as the benzene to toluene ratio increases. Condensation of secondary organic aerosol (SOA), which adds oxygenated aerosol mass and thus reduces the HOA fraction, is likely the dominant process that causes this transformation. Heterogeneous and particle-phase chemical reactions of
hydrocarbon-10
like aerosol may also alter its composition (Molina et al., 2004), though this cannot give rise to a significant increase in mass. All these processes tend to increase the oxygenated content of the aerosol organics, such that after ∼1–2 days photochemical age, virtually all the organic content is oxygenated in nature. However, there remains a small residual HOA fraction even at the higher VOC ratios. This may be due to the
15
inability of the analytical technique used to fully separate the fractions according to their representative fragmentation patterns or it may be a real atmospheric phenomenon, further work is underway to examine this aspect further.
In addition, Fig. 10 also shows that the sulphate and nitrate aerosol mass tend to increase as the benzene/toluene ratio increases, reflecting the influence of the
con-20
densation of these species onto the exisiting aerosol population over time. It appears as though the organic change occurs on timescales longer than the sulphate and ni-trate change, and there may be some evidence for nini-trate fraction becoming smaller over longer timescales, possibly due to the long range transport of acidified sulphate aerosol. However, it should be noted that the increase of sulphate mass in the aerosol
25
burden may not necessarily be coupled to the VOC ratio, for it will be influenced effects such as cloud processing. In addition, the source footprint of SO2may be significantly different to the assumed source region of the VOCs, for other sources, such as power
ACPD
5, 10055–10096, 2005 Characterisation of pollution aerosol M. J. Cubison et al. Title Page Abstract Introduction Conclusions References Tables Figures J I J I Back Close Full Screen / EscPrint Version
Interactive Discussion
EGU plants, may add to the urban SO2emissions.
Together, the increase in the oxygenated fraction of the aerosol organics and con-densation of inorganics and SOA impacts on the aerosol hygroscopic properties, as indicated by Fig. 11, which shows the hygroscopic growth distribution as a function of the HOA component of the organic aerosol mass. In common with the VOC
ra-5
tio analysis shown in Fig.9, the differences observed over the different dry diameters reflect the length of exposure of the particles to atmospheric processing. The Aitken mode particles have a short residence time in the atmosphere and thus are comprised almost entirely of hydrophobic HOA, whereas the 89 nm particles are undergoing the transformation to the hygroscopic inorganic and OOA dominated accumulation mode.
10
The observations suggest that the timescale of atmospheric processing of aerosol is such that particles of ∼100 nm in diameter exhibit the most dynamical behaviour, as sul-phate/nitrate mass and SOA are condensed onto the aerosol and photochemical pro-cesses act to oxygenate the aerosol organics. Together these propro-cesses act to grad-ually increase the aerosol hygroscopicity in parallel with the increase in aerosol mass,
15
and therefore diameter, through condensation. Thus the initially fresh, hydrocarbon-like less-hygroscopic particles of nucleation mode diameter are gradually transformed to large soluble particles with a significant inorganic content, over a timescale indicated by the VOC ratios to be of the order 1–2 days.
6. Conclusions
20
It has been previously reported that there is a transition from an external mixture of particles in urban areas to a single, internal, processed mixture in background locations (see e.g.Svenningsson et al.,1994;Swietlicki et al.,2000). However, the time scales for this processing have not previously been investigated as a continuous function of photochemical age.
25
Recent work in the literature describes modelling studies which attempt to estimate the time scales for similar transformations to those investigated here, such as the
ACPD
5, 10055–10096, 2005 Characterisation of pollution aerosol M. J. Cubison et al. Title Page Abstract Introduction Conclusions References Tables Figures J I J I Back Close Full Screen / EscPrint Version
Interactive Discussion
EGU processing of soot (Riemer et al., 2004) and organics (Reddy and Boucher, 2004;
Cooke et al.,2002). The transformation of organic matter from the less- to the more-hygroscopic mode was estimated to occur in ∼1–3 days (Reddy and Boucher,2004; Cooke et al.,2002), and soot between 8 h and 2 days (Riemer et al.,2004). We present measurements which indicate that transformations of this nature in the hygroscopicity
5
occur on this time scale in the real atmosphere. We have given evidence to show that there is a very common, processed background distribution, or state, in the aerosol burden that is represented by soluble, mixed inorganic-oxygenated organics in the ac-cumulation mode. In contrast, fresh aerosol emissions in urban areas are shown to be virtually insoluble and are dominated by organics with a high fraction of
hydrocarbon-10
like material. The emitted particles are small, in the nucleation or Aitken modes, and are externally mixed with the background aerosol. The fresh particles are acted on by physical and chemical processes as they are advected away from the source area – a combination of dilution, condensation, coagulation and chemical reactions transform these aerosol to the large diameter soluble background distribution over a time scale
15
of approximately 1–2 days.
The absence of a hydrophobic mode of small particles in the regional background may be due to dilution as air advected downwind of the source region and mixes. How-ever, the urban particles are known to be modified to a more-hygroscopic state from studies in closed artificial chambers (Weingartner et al., 1997, 1995), which proves
20
the evolution of such emissions is likely in the atmosphere, therefore providing strong evidence that they can be processed into a state representative of the background dis-tribution. This process has also been proposed by other studies in the literature (e.g. Swietlicki et al.,2000) and used as a parameterisation in a number of global models (e.g.Koch,2001;Lohmann et al.,2000).
25
The observations taken in an air mass 1–2 days downwind of a source region pre-sented here exhibit similarities to background sites which are significantly further from source, such as the Jungfraujoch in Switzerland (McFiggans et al.,2005a). Therefore, in summary, whilst the effects of individual processes such as condensation and
coag-ACPD
5, 10055–10096, 2005 Characterisation of pollution aerosol M. J. Cubison et al. Title Page Abstract Introduction Conclusions References Tables Figures J I J I Back Close Full Screen / EscPrint Version
Interactive Discussion
EGU ulation have not been considered here, in their ensemble, atmospheric transformations
of urban aerosol appear to be negligible after ∼2 days, which would allow for a simple representation of the ageing process in regional transport and/or global climate models. The hygroscopic properties of the particles may therefore be described simply by the relative integrated contributions to the condensable flux of organic and inorganic
ma-5
terial providing no further source region is intercepted. The approach of the modeling studies of e.g.Reddy and Boucher(2004) who define a characteristic processing time (1/e) for transformation of organics from the less- to the more-hygroscopic fractions, thus broadly agrees with this hypothesis, for after 3 or so characteristic time periods virtually no further changes would be observed.
10
Though the cloud condensation properties of the aerosol are not explicitly discussed in this paper, the result that particles at 89 nm diameter exhibit the largest changes in their hygroscopic properties with changing photochemical lifetime in the atmosphere indicates that these ageing processes will have a significant impact on the CCN number population, and hence cloud droplet number, as these particle sizes are the smallest
15
particles that are likely to be activated into cloud droplets (see e.g.McFiggans et al., 2005b;Raymond and Pandis,2003).
Acknowledgements. The measurements were supported through the NERC Polluted
Tro-poshere programme. M. J. Cubison was supported during the period of this work through NERC studentship no. 06424.
20
References
Alfarra, M., Coe, H., Allan, J., Bower, K., Boudries, H., Canagaratna, M., Jimenez, J., Jayne, J., Garforth, A., Li, S.-M., and Worsnop, D.: Characterization of urban and rural organic particulate in the Lower Fraser Valley using two Aerodyne Aerosol Mass Spectrometers, Atmos. Environ., 38, 5745–5758, 2004. 10057,10070,10071,10073
25
Allan, J., Jimenez, J., Williams, P., Alfarra, M., Bower, K., Jayne, J., Coe, H., and Worsnop, D.: Quantitative sampling using an Aerodyne aerosol mass spectrometer. 1. Techniques of data interpretation and error analysis, J. Geophys. Res., 108D, 4090, 2003a. 10062
ACPD
5, 10055–10096, 2005 Characterisation of pollution aerosol M. J. Cubison et al. Title Page Abstract Introduction Conclusions References Tables Figures J I J I Back Close Full Screen / EscPrint Version
Interactive Discussion
EGU Allan, J., Alfarra, M., Bower, K., Williams, P., Gallagher, M., Jimenez, J., McDonald, A., Nemitz,
E., Canagaratna, M., Jayne, J., Coe, H., and Worsnop, D.: Quantitative sampling using an Aerodyne aerosol mass spectrometer. 2. Measurements of fine particulate chemical compo-sition in two UK cities, J. Geophys. Res., 108D, 4091, 2003b. 10069,10070
Allan, J., Delia, A., Coe, H., Bower, K., Alfarra, M., Jimenez, J., Middlebrook, A., Jayne, J., and
5
Worsnop, D.: A generaslised method for the extraction of chemically resolved mass spectra from Aerodyne aerosol mass spectrometer data, J. Aerosol Sci., 35, 909–922, 2004b. 10062 Alonso, M., Alguacil, F., Martin, M., Kousaka, Y., and Nomura, T.: Aerosol particle size growth by simultaneous coagulation and condensatioon with diffusion losses in laminar flow tubes, J. Aerosol Sci., 30, 1191–1199, 1999. 10061
10
Atkinson, R.: Gas-phase tropospheric chemistry of organic compounds, J. Phys. Chem. Ref. Data, Monograph 2, 1–216, 1994. 10066
Barrett, J. and Baldwin, T.: Aerosol nucleation and growth during laminar tube flow – maximum saturations and nucleation rates, J. Aerosol Sci., 31, 633–650, 2000. 10061
Barrett, J. and Baldwin, T.: Aerosol nucleation and growth during laminar tube flow – quenching
15
effects and wall condensation, J. Aerosol Sci., 32, 957–974, 2001. 10061
Barrett, J. and Clement, C.: Growth rates for liquid drops, J. Aerosol Sci., 19, 223–242, 1988. 10058
Berg, O., Swietlicki, E., and Krejci, R.: Hygroscopic growth of aerosol particles in the marine boundary layer over the Pacific and Southern Oceans during the First Aerosol
Characteriza-20
tion Experiment (ACE 1), J. Geophys. Res., 103D, 16 535–16 546, 1998. 10058
Calvert, J.: Hydrocarbon involvement in photochemical smog formation in Los Angeles atmo-sphere, Environ. Sci. Technol., 10, 256–262, 1976. 10064
Claeys, M., Graham, B., Vas, G., Wang, W., Vermeylen, R., Pashynska, V., Cafmeyer, J., Guyon, P., Andreae, M., Artaxo, P., and Maenhaut, W.: Formation of secondary organic
25
aerosols through photooxidation of isoprene, Science, 303, 1173–1176, 2004. 10058 Cocker, D., Whitlock, N., Flagan, R., and Seinfeld, J.: Hygroscopic properties of Pasadena,
California aerosol., Aerosol Sci. Tech., 35, 637–647, 2001. 10057,10058,10069
Cooke, W., Ramaswamy, V., and Kasibhatla, P.: A general circulation model study of the global carbonaceous aerosol distribution, J. Geophys. Res., 107D, 4279, 2002. 10058,10076
30
Covert, D. and Heintzenberg, J.: Size distributions and chemical properties of aerosol at Ny-Alesund, Svalbard, Atmos. Environ., 27A, 2989–2997, 1993. 10057
ACPD
5, 10055–10096, 2005 Characterisation of pollution aerosol M. J. Cubison et al. Title Page Abstract Introduction Conclusions References Tables Figures J I J I Back Close Full Screen / EscPrint Version
Interactive Discussion
EGU method based on optimal estimation, J. Aerosol Sci., 36, 846–865, 2005. 10062,10068
Donaldson, K., Li, X., and MacNee, W.: Ultrafine (nanometre) particle mediated lung injury, J. Aerosol Sci., 29, 553–560, 1998. 10057
Drewnick, F., Schwab, J., Jayne, J., Canagaratna, M., Worsnop, D., and Demerjian, K.: Mea-surement of Ambient Aerosol Composition During the PMTACS-NY 2001 Using an Aerosol
5
Mass Spectrometer. Part I: Mass Concentrations, Aerosol Sci. Technol., 38(S1), 92–103, 2004. 10062
Ghio, A. and Devlin, R.: Inflammatory lung injury after bronchial instillation of air pollution particles, Am. J. Resp. Crit. Care, 164(4), 704–708, 2001. 10057
Heard, D., Carpenter, L., Creasey, D., Hopkins, J., Lee, J., Lewis, A., Pilling, M., Seakins,
10
P., Carslaw, N., and Emmerson, K.: High levels of the hydroxyl radical in the winter urban troposphere, Geophys. Res. Lett., 31, L18112, 2004. 10066
Hopkins, J., Lewis, A., and Reid, K.: A two-column method for long-term monitoring of non-methane hydrocarbons (NMHCs) and oxygenated volatile organic comounds (o-VOCs), J. Environ. Monitor., 5, 8–13, 2003. 10061
15
Horak Jr, F., Frischer, T., Studnicka, M., Gartner, C., Hauck, H., and Preining, O.: The chemical composition of particulate matter has a short term effect on the lung function of pre-school children, Eur. Respri. J., 18 Suppl.33, 128, 2001. 10056
IPCC: Climate change 2001: Scientific basis. Third assessment of the Inter-govermental Panel on Climate Change, Cambridge, 2001. 10057
20
Jacobson, M. Z.: Fundamentals of Atmospheric Modelling, Cambridge University Press, Cam-bridge, UK, 1999. 10058
Jayne, J., Leard, D., Zhang, X., Davidovits, P., Smith, K., Kolb, C., and Worsnop, D.: Devel-opment of an aerosol mass spectrometer for size and composition analysis of submicron particles, Aerosol Sci. Technol., 33, 49–70, 2000. 10062
25
Jimenez, J., Bahreini, R., Cocker, D., Zhuang, H., Varutbangkul, V., Flagan, R., Seinfeld, J., O’Dowd, C., and Hoffmann, T.: New particle formation from photooxidation of diiodomethane (CH2I2), J. Geophys. Res., 108D, 4318, 2003. 10062
Kim, C. and Jaques, P.: Respiratory dose of inhaled ultrafine particles in healthy adults, Philos. Trans. R. Soc. Lond. Ser. A-Math. Phys. Eng. Sci., 358, 2693–2705, 2000. 10057
30
Kittelson, D.: Engines and nanoparticles: A review, J. Aerosol Sci., 29, 575–588, 1998. 10068 Kleinmann, L., Daum, P., Lee, Y.-N., Nunnermacker, L., Springston, S., Weinstein-Lloyd, J., Hyde, P., Doskey, P., Rudolph, J., Fast, J., and Berkowitz, C.: Photochemical age
determina-ACPD
5, 10055–10096, 2005 Characterisation of pollution aerosol M. J. Cubison et al. Title Page Abstract Introduction Conclusions References Tables Figures J I J I Back Close Full Screen / EscPrint Version
Interactive Discussion
EGU tions in the Phoenix metropolitan area, J. Geophys. Res., 108D, 2003. 10064
Koch, D.: Transport and direct radiative forcing of carbonaceous and sulphate aerosols in the GISS GCM, J. Geophys. Res., 106D, 20 311–20 322, 2001. 10076
Kulmala, M.: How particles nucleate and grow, Science, 302, 1000–1001, 2003. 10058 Kulmala, M., Majerowicz, A., and Wagner, P.: Condensational growth at large vapour
concen-5
tration: Limits of applicability of the Mason equation, J. Aerosol Sci., 20, 1023–1026, 1989. 10058
Kulmala, M., Laakso, L., Lehtinen, K., Riipinen, I., Del Maso, M., Anttila, T., Kerminen, V.-M., Horrak, U., Vana, M., and Tammet, H.: Initial steps of aerosol growth, Atmos. Chem. Phys., 4, 2553–2560, 2004a,
10
SRef-ID: 1680-7324/acp/2004-4-2553. 10058
Lee, A., Bartle, K., and Lewis, A.: A Model of Peak Amplitude Enhancement in Orthogonal Two-Dimensional Gas Chromatography., Analytical Chem., 73, 1324–1329, 2001. 10061 Lee, K.: Change of particle size distribution during Brownian coagulation, J. Colloid Interf. Sci.,
92, 315–325, 1983. 10058
15
Lewis, A., Bartle, K., McQuaid, J., Pilling, M., Seakins, P., and Ridgeon, P.: Atmospheric mon-itoring of volatile organic compounds using programmed temperature vaporisation injection, J. High Res. Chromatog., 19, 686–690, 1996. 10060
Lewis, A., Carslaw, N., Marriott, P., Kinghorn, R., Morrison, P., Lee, A., Bartle, K., and Pilling, M.: A larger pool of ozone-forming carbon compounds in urban atmospheres, Nature, 405,
20
778–781, 2000. 10061
Limbeck, A., Kulmala, M., and Puxbaum, H.: Secondary organic aerosol formation in the atmo-sphere via heterogeneous reaction of gaseous isoprene on acidic particles, Geophys. Res. Lett., 30, 1996, 2003. 10058
Lohmann, U., Feichter, J., Penner, J., and Leaitch, R.: Indirect effect of sulphate and
carbona-25
ceous aeorosls: a mechanistic treatment, J. Geophys. Res., 105D, 12 193–12 206, 2000. 10076
Luria, M. and Sievering, H.: Heterogeneous and homogeneous oxidation of SO2in the remote marine atmosphere, Atmos. Environ., 25A, 1489, 1991. 10071
Malet, J., Alloul, L., Michielsen, N., Bouland, D., and Renoux, A.: Deposition of nanosized
30
particles in cylindrical tubes under laminar and turbulent flow conditions, J. Aerosol Sci., 31, 335–348, 2000. 10061
ACPD
5, 10055–10096, 2005 Characterisation of pollution aerosol M. J. Cubison et al. Title Page Abstract Introduction Conclusions References Tables Figures J I J I Back Close Full Screen / EscPrint Version
Interactive Discussion
EGU aerosol particles during ACE-Asia., in: Abstracts of the European Aerosol Conference 2003,
vol. 1, pp. S9–S10, 2003. 10058
McFiggans, G., Alfarra, M., Allan, J., Bower, K., Coe, H., Cubison, M., Topping, D., Williams, P., Decesari, S., Facchini, C., and Fuzzi, S.: Simplification of the representation of the organic component of atmospheric particulates, Faraday Discuss., 2005a. 10058,10059,10076
5
McFiggans, G., Artaxo, P., Baltensperger, U., Coe, H., Facchini, M.-C., Feingold, G., Fuzzi, S., Gysel, M., Laaksonen, A., Lohmann, U., Mentel, T., Murphy, D., O’Dowd, C., Snider, J., and Weingartner, E.: The effect of physical and chemical aerosol properties on warm cloud droplet activation, Atmos. Chem. Phys. Discuss., 5, 8507–8647, 2005b,
SRef-ID: 1680-7375/acpd/2005-5-8507. 10077
10
McKeen, S. and Liu, S.: Hydrocarbon ratios and photochemical history of air masses, Geophys. Res. Lett., 20, 2363–2366, 1993. 10064
McKeen, S., Liu, S., Hsie, E.-Y., Lin, X., Bradshaw, J., Smyth, S., Gregory, G., and Blake, D.: Hydrocarbon ratios during PEM West A: a model perspective, J. Geophys. Res., 101D, 2087–2109, 1996. 10064
15
McMurry, P., Litchy, M., Huang, P.-F., Cai, X., Turpin, B., Dick, W., and Hanson, A.: Elemental composition and morphology of individual particles separated by size and hygroscopicity with the TDMA, Atmos. Environ., 30, 101–108, 1996. 10057,10058
McMurry, P. H. and Stolzenburg, M. R.: On the sensitivity of particle size to relative humidity for Los Angeles Aerosols, Atmos. Environ., 23, 497–507, 1989. 10057
20
Molina, M., Ivanov, A., Trakhtenberg, S., and Molina, L.: Atmospheric evolution of organic aerosol, J. Geophys. Res., 109D, 22 104, 2004. 10074
Moshammer, H. and Neuberger, M.: The active surface of suspended particles as a predictor of lung function and pulmonary symptoms in Austrian school children, Atmos. Environ., 37, 1737–1744, 2003. 10057
25
Neuberger, M., Moshammer, H., and Kundi, M.: Declining ambient air pollution and lung func-tion improvement in Austrian children, Atmos Environ, 36, 1733–1736, 2002. 10057 Neuberger, M., Schimek, M., Horak Jnr, F., Moshammer, H., Kundi, M., Frischer, T., Gomiscek,
B., Puxbaum, H., Hauck, H., and AUPHEP-Team.: Acute effects of particulate matter on res-piratory diseases, symptoms and functions: epidemiological results of the Austrian Project
30
on Helath Effects of Particulate Matter (AUPHEP), Atmos. Environ., 38, 3971–3981, 2004. 10057
ACPD
5, 10055–10096, 2005 Characterisation of pollution aerosol M. J. Cubison et al. Title Page Abstract Introduction Conclusions References Tables Figures J I J I Back Close Full Screen / EscPrint Version
Interactive Discussion
EGU and Putaud, J.-P.: Biogenically driven organic contribution to marine aerosol, Nature, 431,
676–680, 2004. 10057
Park, S. and Lee, K.: Condensational growth of polydisperse aerosol for the entire particle size range, Aerosol Sci. Technol., 33, 222–227, 2000. 10058
Park, S., Lee, K., Shimada, M., and Okuyama, K.: Alternative analytical solution to
condensa-5
tional growth of polydisperse aerosols in the continuum regime, J. Aerosol Sci., 32, 187–197, 2001. 10058
Parrish, D., Hahn, C., Williams, E., Norton, E., Fehsenfeld, F., Singh, H., Shetter, J., Gandrud, B., and Ridley, B.: Indications of photochemical histories of Pacific air masses from mea-surements of atmospheric trace species at Point Arena, California, J. Geophys. Res., 103D,
10
22 339–22 359, 1992. 10064
Penttinen, P., Timonen, K., Tiittanen, P., Mirme, A., Ruuskanen, J., and Pekkanen, J.: Ultrafine particles in urban air and respiratory health among adult asthmatics, Eur. Respir. J., 17, 428–435, 2001. 10057
Pich, J., Friedlander, S., and Laj, F.: The self-preserving particle size distribution for coagulation
15
by Brownian motion. III. Smoluchowski coagulation and simultaneous Maxwellian condensa-tion, J. Aerosol Sci., 1, 115–126, 1970. 10058
Pope, C., Schwartz, J., and Ransom, M.: Daily mortality and PM10 pollution in Utah valley, Arch. Environ. Health, 47, 211–217, 1992. 10056
Pope III, C.: Review: epidemiological basis for particulate air pollution health standards, Aerosol
20
Sci. Tech., 32, 4–14, 2000. 10056
Putaud, J.-P., Raes, F., Van-Dingenen, R., Br ¨uggemann, E., Facchini, M.-C., Decesari, S., Fuzzi, S., Gehrig, R., H ¨uglin, C., Laj, P., Lorbeer, G., Maenhaut, W., Mihalopoulos, N., M ¨uller, K., Querol, X., Rodriguez, S., Schneider, J., Spindler, G., ten Brink, H., Torseth, K., and Wiedensohler, A.: A European aerosol phenomenology. 2: chemical characteristics of
25
particulate matter at kerbside, urban, rural and background sites in Europe, Atmos. Environ., 38, 2579–2595, 2004. 10057
Rader, D. and McMurry, P.: Application of the tandem differential mobility analyser for studies of droplet growth or evaporation, J. Aerosol. Sci., 17, 771–787, 1986. 10057
Raymond, T. and Pandis, S.: Formation of cloud droplets by multicomponent organic particles,
30
J. Geophys. Res., 108D, 4469, 2003.
Reddy, M. and Boucher, O.: A study of the global cycle of carbonaceous aerosols in the LMDZT general circulation model, J. Geophys. Res., 109D, D14 202, 2004. 10077 10057, 10058,