HAL Id: hal-00296432
https://hal.archives-ouvertes.fr/hal-00296432
Submitted on 6 Feb 2008
HAL is a multi-disciplinary open access
archive for the deposit and dissemination of
sci-entific research documents, whether they are
pub-lished or not. The documents may come from
teaching and research institutions in France or
abroad, or from public or private research centers.
L’archive ouverte pluridisciplinaire HAL, est
destinée au dépôt et à la diffusion de documents
scientifiques de niveau recherche, publiés ou non,
émanant des établissements d’enseignement et de
recherche français ou étrangers, des laboratoires
publics ou privés.
Surface observation of sand and dust storm in East Asia
and its application in CUACE/Dust
Y. Q. Wang, X. Y. Zhang, S. L. Gong, C. H. Zhou, X. Q. Hu, H. L. Liu, T.
Niu, Y. Q. Yang
To cite this version:
Y. Q. Wang, X. Y. Zhang, S. L. Gong, C. H. Zhou, X. Q. Hu, et al.. Surface observation of sand and
dust storm in East Asia and its application in CUACE/Dust. Atmospheric Chemistry and Physics,
European Geosciences Union, 2008, 8 (3), pp.545-553. �hal-00296432�
www.atmos-chem-phys.net/8/545/2008/ © Author(s) 2008. This work is licensed under a Creative Commons License.
Chemistry
and Physics
Surface observation of sand and dust storm in East Asia and its
application in CUACE/Dust
Y. Q. Wang1, X. Y. Zhang1, S. L. Gong1, 2, C. H. Zhou1, X. Q. Hu3, H. L. Liu1, T. Niu1, and Y. Q. Yang1
1Laboratory of Atmospheric Chemistry, Centre for Atmosphere Watch and Services, Chinese Academy of Meteorological
Sciences, Beijing, China
2Air Quality Research Division, Science and Technology Branch, Environment Canada, Toronto, Canada 3National Meteorological Satellite Center, CMA, Beijing, China
Received: 19 March 2007 – Published in Atmos. Chem. Phys. Discuss.: 27 June 2007 Revised: 20 September 2007 – Accepted: 17 December 2007 – Published: 6 February 2008
Abstract. The spatial-temporal distributions and sources of
sand and dust storm (SDS) in East Asia from 2001 to 2006 were investigated on the basis of visibility and PM10 data
from the routine SDS and weather monitoring networks run by CMA (China Meteorological Administration). A power functional relationships between PM10 and visibility was
found among various regions generally with a good corre-lation (r2=0.90), especially in Asian SDS source regions. In addition, three SDS occurrence centers, i.e. western China, Mongolia and northern China, were identified with the Mon-golia source contributing more dust to the downwind areas including Korea and Japan than other two sources. Gener-ally, high PM10concentrations were observed in most areas
of northern China. The highest value was obtained in the center of western China with a spring daily mean value of 876 µgm−3, and the value in other source regions exceeds 200 µgm−3. These data sets together with the satellite ob-servations in China form the main observation database for the evaluation and data assimilation of CUACE/Dust system – an operational SDS forecasting system for East Asia.
1 Introduction
In each spring, the Asian SDS originating from the arid and semi-arid regions of China and Mongolia greatly increases the particulate concentrations locally, regionally and even globally in some events, resulting in significant visibility re-duction, respiratory symptoms, eye trouble to human beings as well as damage to animals, plants, industry and social ac-tivities (Kim et al., 2001; Seinfeld et al., 2004; Zhang et al., 1993). As one type of severe disaster weather, SDS is a con-cern of the government and people in China and downwind countries each spring.
Correspondence to: Y. Q. Wang [email protected]
As a natural phenomenon, SDS was recorded in the Diary of Tonghe Weng, indicating an average of over nine dusty days occured annually in Beijing during the period 1860– 1898 AD (Fei et al., 2005). However, systematic monitoring of SDS events was established in China only about half a century ago. As part of the routine weather monitoring net-work (Fig. 1), atmospheric visibility has been recorded in China from the 1950’s to monitor SDS events. The sources, spatial and temporal variation, dust deposition and regional characteristics of SDS have been studied using the visibility dataset (Qian et al., 2004; Sun et al., 2001; Wang et al., 2005; Zhou, 2001; Zhou and Zhang, 2003). A similar dataset was used to investigate SDS characteristics in Mongolia (Natsag-dorj et al., 2003). But the above studies did not cover re-cent years, when significant spatial and temporal variations of SDS were observed. Furthermore, these data are primarily qualitative as only the SDS category was reported. To obtain the dust particle concentrations during SDS events, CMA es-tablished a SDS monitoring network with 19 stations located in SDS source and downwind regions in northern China with PM10(particles with diameter less than 10 µm) observations
(Fig. 1) since 2003. Eleven of them are also equipped with instruments to measure visibility.
These two networks provide near real-time distributions of SDS in China for characterizing SDS and model validation. This paper presents the meteorological recorded SDS data in spring from 2001 to 2006, PM10 and visibility data at the
SDS observation stations in spring from 2004 to 2006. The specific objectives of the studies reported here were to (1) characterize the spatial distribution and temporal variation of the frequency of SDS events in resent years; (2) investigate the PM10 characteristics of northern China in the primary
SDS season; (3) find the relationship between PM10and
vis-ibility especially in SDS events; (4) introduce the model ver-ification result based on this dataset.
Finally, these observational data, together with satellite observations (Hu et al., 2007) will facilitate the evaluation
546 Y. Q. Wang et al.: SDS observation in East Asia # # # # # # # # # # # # # # # # # # # # # # # # # # # # # # # # # # # # # # # # # # # # # # # # # # # # # # # # # # # # # # # # # # # # # # # # # # # # # # # # # # # # # # # # # # # # # # # # # # # # # # # # # # # # # # # # # # # # # # # # # # # # # # # # # # # # # # # # # # # # # # # # # # # # # # # # # # # # # # # # # # # # # # # # # # # # # # # # # # # # # # # # # # # # # # # # ## # # # # # # # # # # # # # # # # # # # # # # # # # # # # # # # # # # # # # # # # # # # # # # # # # # # # # # # # # # # # # # # # # # # # # # # # # # # # # # # # # # # ## # # # # ## # # # ## # # # # # # # # # # # # # # # # # # # # # # # # # # # # # # # # # # # # # ## # # # # # # # ## ## # # # # # # # # # # # # # # # # # # # # # # # # # # # # # # # # # # # # # # # # # # # # # # # # # # # # # # # ## # # # # # ## # ## # # # # # # # # # # # # # # # # # # # # # # ## # # # # # # # # # # # # # # # # # # # # # # # # ## # # # # # # # # # # # # # ## # # # # # # # # # # # # # # # # # # # # # # # # # # # # # # # # # # # # # # # # # # # # # # # # # # # # # # # # # # # # # # # # # # # # # # # # # # # # # # # # # # # # # # # # # # # # # # # # # # # # # # # # # # # # # # # # # # # ###### # ## # # # ## # # # # # # # # # # # # # # # # # # # # # # # # # # # # # # # # # # # # # # # # # # # # # # # # # # # # # # # # # # # # # # # # # # # # # # # # # # # # # # # # # # # ## ## ###### # # # # # # # # # # # # ##### ### # # ## ##### ## # ## ## # ## # # # # # # # # # # # # ## ### # # ## ## ## ## # # ## #### #### # # # # # ## # # # # # # # # # # # # # # # # # # # # # # # # # # # # # # # # # # # # # # # # # # # # # # # # # # # # # ## # # # #### # ###### # # ## # #### # ######## # ###### # # # # ### # # # # # # # #### # # # # # # # # # # # # # # # # # # # # # #### # # # ## # # # # # # # # # # ### # ### # # # # # # # # # # # # # # # # # # # # # # # # # # # # # # # # # # # # # ## # # # # # # # # # # # # # # # # # # # # # # # # # ### # # ## ## # # # # # # # # # # # # # # # # # # # # # # # # # # # # # # # # # # # # # # # # # #### # # # # # ## # # ## # # # # ### ## # # # # # # # # # # # # # # # # # # # # # # # # # # # # # # # # # # # # # # # # # # # # # # # #### # #### # # # # # ### # ### # # # # # ### # # # # # ## # # ## # # # # # ## # # # # # # # # # # # # # # # ## # # # # # # # # # # ## # # # # # # ## # # ## ####### # # # # # # # # # # # # # # # # # ### # ### ## # # # ## # # # # # # # # # # ## ### # # ## ### # # # # #### # # ## # # ## ## # # # # # # # # # # # # # # # # # # # # # # # # # # # # # ## # # # # # # # # # # ## # # ## # # # ### # # # # # # # # ## # # # # # # # # # # # # # # # # # # # # ## # # # # # # # # # # # # # # # # # # # # # ## # # # # # # # # # # # # # # # # # # # # # # # # # # # # # # # # # # # # # # # # # # # # # # # # # # # # # # # # # # # # # # # # # # # # # # # # # # ## # # # # # # # # # # # # # # # # # # # # # # # # # # # # # # # # # # # # # # # # # # # # # # # # # # ## # # # # # # # # # # # # # # # # # # # # # # # # # # # # # # # # # # # # # # # # # # # # # # # # # # # # # # # # # # # # # # # # # # # # # # # # # # # # # # # # ### # # # # # ## # # # # # # # # # # # # # # # ## # # # # # # # # # # # # # # # # # # # # # # # # # ## # # # # # # # # # # # # # # # # # # # # # # # # ## # # # # # # # ## # # # # # # # # # # # # # # # # # # # # # ## # # # # # # # # # # # # # # ### # # # # # # # # # # # # ## # # # # ## ### # # # # # # # # # # # # # # # # # # # # # # # # # # # # # # # # # # # # # # # # # # # # # # # # # # ## # # # # # # # # # # # # # ## # # # # ## # # # # # # # # # # # # # # # # # # # # # # # # # # # # # # # # # # # # # # # # # # # # # # # # # # # # # # # # # # # # # # # # # ## # # # # # # # # # # # ## # ### # # # # # # # # # # # # # # # # # # # # # # # # # # # # # # # # # # # # # # # # # # # # # # # ## # # # # # # # # # # # # # # # # # # # # # # # # # # # # # # # # # # # ## ## # # #### # # # # # # # # ## ## #### # # # # # # # # # # # # # # # ## ## # # ## # # # # # # # # # # # # # # # ### # # # # # # # # # # ## # # # # # # # # # # # # # # ## # # # # # # ### # # # # # # # # # # # # # # # # # # # # # # # # # # # # # # # # # # # # # # # ## # # # # # # # # # # # # ### # # # ## # # # ####### ###### # # # # #### # # # ## # # # ## # # ### ## ## # # # ## # # # # # # # # # # # # # # # # # # # # # ## # ## # # # # # # # ## # # ## # # # # ### # ## # # # # #### ## # # # # # # # # # # # # # # # # ## # #### # # # # # # # # # # # # # # ## # # # # # # # # # # # # # # # # # # ## ### # # ## ### # ## # # # ## # # # # # # # # # # # # ## # # # # # # # # # # # # # # # # # # # # # # ## # # # # # # # # ## # # # # ######### # # # # # ##### # #### # # ## ## # # #### ##### # # # # # ######### # # # # # # # # # # # # # # # # # # # # # # ### # # # # # # # # # # # # # # # # # # # # # # # # # # # ## # # # # # ## # # # # # # # # # # ## # # # # # # # # # # # # # # # # # # # # ### # # # # # # # # # # # # # #### ### ## # # # # ### # # # # ## # # # # # # # # ### # #### ## # # ## ##### # # # # # # # # # # # # # # # # # # # # # # # # # # # # # # # # # # # # # # # # # # # # # # ## ## # # # ## # # # # # # # # # # # # # # # # # # # # # # # # # # # # # # # # # # # # # # # # # # # ### # # # # # # # # # # # # # # # # # # # # % % % % % % % % % % % % % % % % % % %
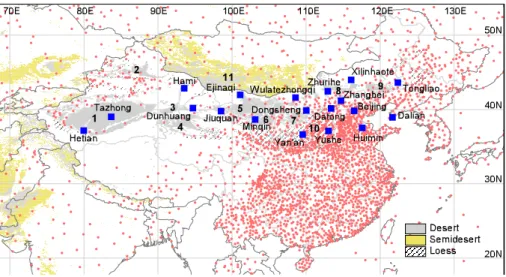
Fig. 1. The distribution map of the stations used to observation SDS in CMA. The red dots are weather stations while the blue squares are SDS observation stations. In this figure, the main SDS source regions are: 1, Taklimakan Desert; 2, Gurbantunggut Desert; 3, Kumtag Desert; 4, Qiadam Basin Desert; 5, Badain Juran Desert; 6, Tengger Desert; 7, Mu Us Desert; 8, Onqin Daga sandy land; 9, Horqin sandy land; 10, Loess Plateau; 11, Deserts and semideserts in Mongolia.
Fig. 2. The distribution of annual mean days of SDS events in spring from 2001 to 2006.
and data assimilation of the CMA operational SDS fore-casting model – CUACE/Dust (China Unified Atmospheric Chemistry Environment for Dust model) (Gong and Zhang, 2007; Zhou et al., 2007) as reported for model improvements and initial forecasting conditions (Niu et al., 2007).
2 SDS observation data
2.1 Meteorological records related to SDS weather Figure 1 shows the distribution of the weather stations in China and surrounding countries. Most stations were located in east and south areas of China with high economic devel-opment. But, in the Gobi desert and sandy land areas, the
sources of SDS, the distribution of the weather stations is very sparse. In the meteorological records of China, four cat-egories of SDS events including suspended dust (horizontal visibility less than 10000 m, and very low wind speed), blow-ing dust (visibility reduce to 1000–10000 m), sand and dust storm (visibility less than 1000 m) and severe sand and dust storm (visibility less than 500 m) are usually reported in the daily observation. (CMA, 1979). The last three categories of dust events all result from strong winds. Through a data transfer system in CMA, the near real-time SDS observation data with 3-h interval at these stations were obtained. The current weather data in spring from 2001 to 2006 were used in this study.
2.2 PM10and visibility data
The 19 SDS stations with PM10 observation are located
in SDS source and downwind regions in northern China (Fig. 1). A Tapered Element Oscillating Microbalance (TEOM, model 1400a, Rupprecht and Patashnick) operated at a controlled flow rate of 4 L/min was used to record con-tinuously the PM10mass concentrations averaged over 5 min
periods in each station. At eleven of the stations 5 min vis-ibilities were also observed automatically on-line using FD-12 (Vaisala). After experimental running of the SDS moni-toring network in 2003, the PM10and visibility observation
data were started to be transferred to the CMA information center in real-time from 2004. Detailed station information is described in Table 1.
Table 1. The descriptions of SDS station network in China.
Station Latitude (◦N) Longitude (◦E) Altitude (m) Location Measurement
Tazhong 39.00 83.67 1099.3 Center of the Taklimankan Desert PM10, visibility
Hetian 37.13 79.93 1374.6 Southern margin of the Taklimakan Desert PM10
Hami 42.82 93.52 737.2 Eastern Xinjiang province PM10, visibility
Ejinaqi 41.95 101.07 940.5 Northern margin of the Badain Juran Desert PM10, visibility Dunhuang 40.15 94.68 1139.0 Eastern margin of the Kumtag Desert PM10, visibility
Jiuquan 39.77 98.48 1477.2 Western margin of the Badain Juran Desert PM10, visibility
Minqin 38.63 103.08 1367.0 Western margin of the Tengger Desert PM10, visibility
Zhurihe 42.40 112.90 1150.8 Southeastern Onqin Dage sandy land PM10
Wulatezhongqi 41.57 108.52 1288.0 Steppe area in mid-inner Mongolia PM10, visibility
Zhangbei 41.15 114.70 1393.3 Downwind area of east China PM10, visibility
Datong 40.10 113.33 1067.2 Notheastern margin of the Loess Plateau PM10 Dongsheng 39.83 109.98 1460.4 Notheastern margin of the Mu Us Desert PM10
Yushe 37.07 112.98 1041.4 Eastern Loess Plateau PM10, visibility Yan’an 36.60 109.50 958.5 Center of the Loess Plateau PM10
Xilinhaote 43.95 116.07 989.5 North of Onqin Dage sandy land PM10, visibility
Tongliao 43.60 122.37 178.5 East of Horqin sandy land PM10
Beijing 39.80 116.47 31.3 Downwind area of east China PM10
Dalian 38.90 121.63 91.5 Downwind area of east China PM10
Huimin 37.48 117.53 11.7 Downwind area of east China PM10
3 Sand and dust storm occurrences in East Asia
3.1 Spatial distribution and sources
The days of SDS events distinguished from the meteorologi-cal records of each weather station in every spring were meteorologi- cal-culated. Figure 2 shows the distribution of annual mean days of SDS events for all four categories of SDS in spring from 2001 to 2006. There are three SDS centers in East Asia. One is the western China source including the Taklimakan Desert and surrounding area; the other is a Mongolia source including the desert and semi-desert area in southern Mon-golia; and the last one is located in northern China, including the Badain Jaran Desert, the Tengger Desert, the Ulan Buh Desert and the Onqin Daga sandy land. Compared with Mon-golian sources, northern China has much fewer SDS events in spring, as observed between 2001 and 2006. In a simulation experiment (Zhang et al., 2003), the three centers were also identified as the major Asian dust aerosol sources, with about 70% dust emission over the past 43 years. Another SDS cen-ter is located in northern India and Afghanistan, but it is not an SDS source important to East Asia and will not be dis-cussed further in this paper. Figure 2 shows SDS events ob-served in Korea, Japan and south of China around the Yangzi River.
The spatial distribution of each SDS type was shown in Fig. 3. Suspended dust events, also called dust fall events, often occurred downwind of SDS with large amounts of dust deposition and very low wind speed. The highest fre-quency of suspended dust events occurred in the western
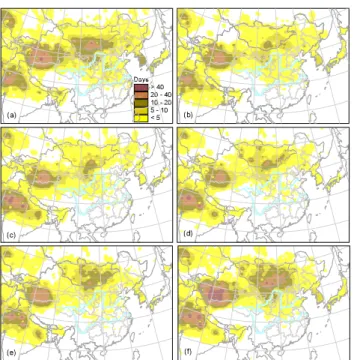
Fig. 3. The distribution of annual mean days of four categories of SDS events in spring from 2001 to 2006. (a) suspended dust; (b) blowing sand; (c) sand and dust storm; (d) severe sand and dust storm.
China source (Fig. 3a), indicating that most of the dust emit-ted from the Taklimakan Desert were deposiemit-ted in the desert again. Dust depositions also occurred downwind, covering large areas east and south of China, Korea and Japan. This result is similar to dust deposition flux estimations (Zhang et al., 1998) and a study using data from the period 1960–1999 (Sun et al., 2001). But, frequent suspended dust events were not observed in the Loess Plateau. Both sources in Mongo-lia and northern China are centers of blowing sand events that influenced all of Mongolia and most of northern China
548 Y. Q. Wang et al.: SDS observation in East Asia
Fig. 4. The distribution of annual mean days of SDS events in spring from 2001 to 2006. (a) 2001; (b) 2002; (c) 2003; (d)2004; (e) 2005; (f) 2006.
(Fig. 3b). In all three SDS sources, SDS and severe SDS events were observed, but the most frequent events occurred in the Mongolia source regions (Fig. 3c and d).
Recent dust deposition data indicate that although many SDS events occurred in the western China source, they con-tribute little to depositions in the eastern downwind areas in-cluding eastern China, Korea and Japan. Most of the dust particles associated with SDS in these areas were mainly from Mongolian and northern China sources in recent years. This is consistent with previous studies using back-trajectory combined PM10 analysis (Wang et al., 2006; Wang et al.,
2004) and the study by Sun et al. (Sun et al., 2001). The spa-tial distribution of SDS event days indicates that the Mongo-lia source is more important than the northern China source in these years. Zhang et al. (1997) reported that most of dust are transported northerly during relative warm and hu-mid (interglacial) climate conditions, and more dust is de-livered northwesterly, when dry and cold (glacial) climates occurred. Based on experimental simulation results, Gong et al. (2004) found that the contributions of surface concen-trations from non-Chinese deserts account for up to 60% in Northeast China and up to 50% in Korea and Japan.
3.2 Time series and variation
From the 1950’s when the weather monitoring network of China started to operate, SDS frequency shows a generally descending trend since the early of 1960’s in most areas of northern China except in the desertification regions such as
the Onqin Daga sandy land (Zhang et al., 2003; Zhou, 2001; Zhou and Zhang, 2003). From 2000 and 2001, the frequency began to rise, reaching a relative peak in 2001, then dropping again in 2002 (Zhang et al., 2003; Zhou and Zhang, 2003). Figure 4 shows the annual variance of SDS occurrence dur-ing the sprdur-ingtime 2001–2006. Higher SDS frequency and larger influencing areas were observed in 2001 and 2006 than in the intervening years 2002 through 2005. In the west-ern China source, SDS occurrence is relatively stable during these years, while sharp variance could be seen in both Mon-golia and northern China sources. Compared with observa-tions over 1960–1999 (Sun et al., 2001), the SDS center lo-cation shifted northward to Mongolia, and the Loess Plateau is no longer a significant deposition region in recent years.
4 PM10and visibility characteristics
4.1 PM10concentration and visibility measurement results
The mean daily PM10concentrations and visibility are shown
for each SDS station for all spring data during the period 2004 to 2006 in Fig. 5. The highest PM10 concentrations
with mean values of 876 and 703 µgm−3 were observed at the stations of Tazhong and Hetian which are located in the center and southern margin of the Taklimakan Desert, the western China source for Asian SDS. This is consistent with the frequency of SDS events occurring in this region (Fig. 2). The highest daily averaged PM10 concentration at Tazhong
station is 7414 µgm−3and the 5-min data often exceed the upper limit of the instrument of 10 000 µgm−3. At Zhurihe station in Onqin Daga sandy land, in the northeast SDS China source, PM10 concentration is also high with a mean value
of 335 µgm−3. Mean PM10 concentration was observed to
exceed 200 µgm−3 for Minqin, Dongsheng, Datong, Wu-latezhongqi, Dunhuang, Ejinaqi and Yushe stations. In Bei-jing, located in a typical SDS dust transport area, mean PM10
concentration is 180 µgm−3, and the highest concentration is 735 µgm−3. About half the days in the spring seasons of the three years can be considered polluted, according to PM10
concentrations higher than the Class II Chinese daily PM10
standard of 150 µgm−3(GB3095–1996).
Due to the high frequency of SDS events, very low vis-ibility was observed at Tazhong station, with a mean value of 10 395 m. However, PM10 concentration and visibility
are not linearly correlated in the same manner over all re-gions in northern China, which is mainly because of dif-ferent physical and chemical characteristics of the aerosol (Watson, 2002). Yushe is located in a coal enrichment area and infrequently impacted by SDS, its aerosol composition is quite different with Zhurihe located in a SDS source re-gion. This explains the fact that even though Yushe station has an mean daily PM10concentration of 200 µgm−3, lower
than that at Zhurihe station, Yushe observes a lower visibility than Zhurihe.
0 500 1000 1500 2000 2500 3000 Tazh ong Het ian Ham i Ejin aqi Dunh uang Jiuq uan Min qin Zhu rihe Wul atez hon gqi Zhan P M 1 0 (μ g m -3 ) gbei Dat ong Dong sheng Yus he Yan 'an Xili nha ote Tong liao BeijingDal ian Hui min 0 5000 10000 15000 20000 25000 30000 V is ( m ) PM10 PM10_SDS Vis Vis_SDS
Fig. 5. The daily-averaged mean values of PM10concentration and visibility of each SDS observation station during the entire period and
SDS events period of spring from 2004 to 2006. In the figure, the PM10 mean concentrations for entire period and SDS events period are represented by orange and baby blue bars respectively, while the two kinds of visibility mean values are represented by black triangles and red squares.
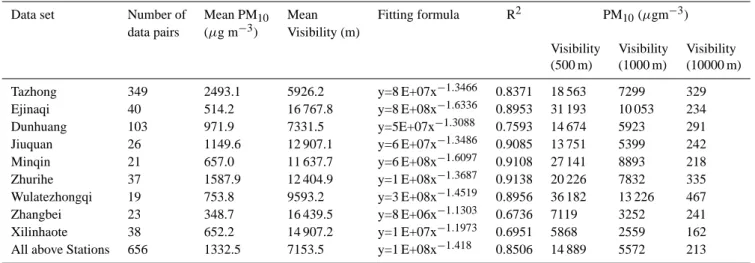
Table 2. Observed mean PM10concentration, visibility based on the data during SDS events and the PM10concentration values on visibility of 500 m, 1000 m and 10000 m calculated from the fitting formula.
Data set Number of Mean PM10 Mean Fitting formula R2 PM10(µgm−3)
data pairs (µg m−3) Visibility (m)
Visibility Visibility Visibility (500 m) (1000 m) (10000 m) Tazhong 349 2493.1 5926.2 y=8 E+07x−1.3466 0.8371 18 563 7299 329 Ejinaqi 40 514.2 16 767.8 y=8 E+08x−1.6336 0.8953 31 193 10 053 234 Dunhuang 103 971.9 7331.5 y=5E+07x−1.3088 0.7593 14 674 5923 291 Jiuquan 26 1149.6 12 907.1 y=6 E+07x−1.3486 0.9085 13 751 5399 242 Minqin 21 657.0 11 637.7 y=6 E+08x−1.6097 0.9108 27 141 8893 218 Zhurihe 37 1587.9 12 404.9 y=1 E+08x−1.3687 0.9138 20 226 7832 335 Wulatezhongqi 19 753.8 9593.2 y=3 E+08x−1.4519 0.8956 36 182 13 226 467 Zhangbei 23 348.7 16 439.5 y=8 E+06x−1.1303 0.6736 7119 3252 241 Xilinhaote 38 652.2 14 907.2 y=1 E+07x−1.1973 0.6951 5868 2559 162 All above Stations 656 1332.5 7153.5 y=1 E+08x−1.418 0.8506 14 889 5572 213
Generally, SDS events are often associated with much higher mean PM10 concentrations and much lower mean
visibility values than the entire period averages for all the stations (Fig. 5). At Tazhong station, the two values are 2493 µgm−3 and 5926 m in SDS events. High PM
10
con-centrations were also observed in Dongsheng and Zhurihe stations with mean value of 1705µgm−3 and 1588 µgm−3 respectively. More obvious increases in PM10concentrations
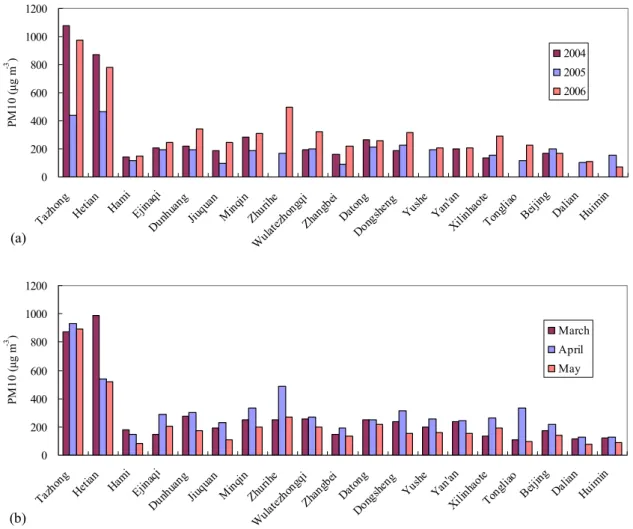
were observed in Dalian than in Beijing during SDS events. The annual variation of PM10concentrations in spring
ex-hibits different patterns in different area (Fig. 6a). In the western China source, PM10concentrations ranked highest in
spring of 2004 at the representative stations of Tazhong and
Hetian, decreased dramatically in 2005, and then increased in spring of 2006. At the other stations near SDS northern China source regions, PM10concentration reached the
high-est value in 2006. At stations downwind of SDS areas, the annual variation shows a different pattern than in the source region itself, with relatively higher PM10 concentrations in
2005. Most stations have similar monthly variations of PM10
concentrations, with the highest value in April, except Het-ian and Hami with the highest values found in March. This is consistent with the high frequency of SDS that occur in April in east Asia (Sun et al., 2001).
550 Y. Q. Wang et al.: SDS observation in East Asia 0 200 400 600 800 1000 1200 Tazho ng Het ian Ham i Ejin aqi Dun hua ng Jiuq uan Minq in Zhuri he Wul atez hong qi Zhan gbe i Dat ong Don gshe ng Yus he Yan' an Xili nha ote Tong liao Beiji ng D P M 10 ( μg m -3 ) alia n Hui min 2004 2005 2006 (a) 0 200 400 600 800 1000 1200 Tazh ong Het ian Ham i Ejin aqi Dunh uang Jiuq uan Minq in Zhu rihe Wul atez hong qi Zha ngbe i Dat ong Don gshe ng Yus he Yan' an Xili nhaot e Tongl iao Bei jing Da P M 10 ( μg m -3 ) lian Hui min March April May (b)
Fig. 6. (a) Annual and (b) monthly mean PM10mean concentration for each SDS observation station.
4.2 The relationship between PM10concentration and
vis-ibility
Five-minute datasets from typical sites in major sources of Asian SDS were analyzed for hourly PM10 concentrations
that compare with corresponding visibility data. The rela-tionships between PM10 and visibility show good
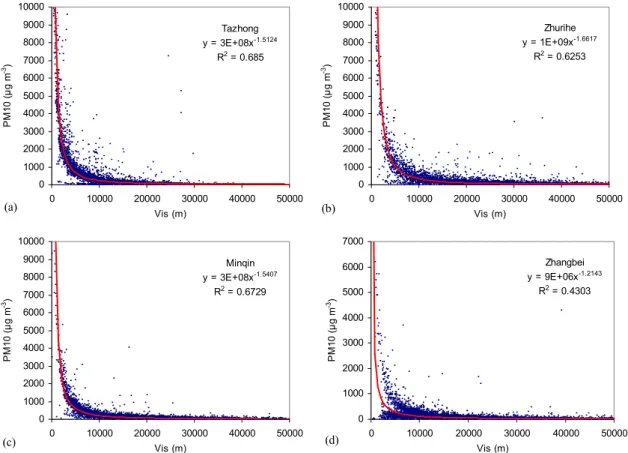
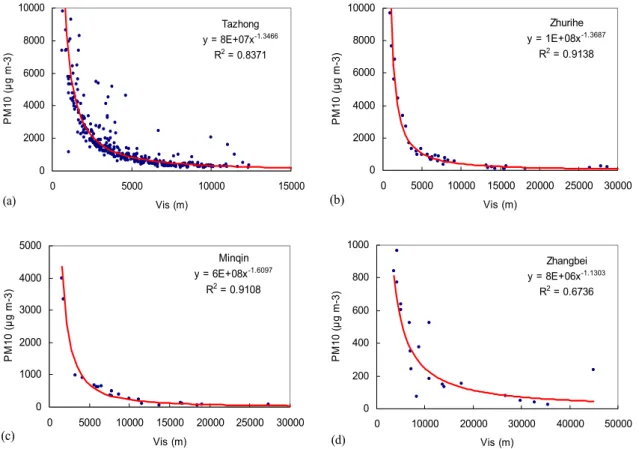
correla-tions (R2 larger than 0.60) by power function fitting for 3 spring data together at Tazhong, Zhurihe and Minqin, respec-tively (Fig. 7). At Zhangbei, a station located in a downwind SDS area, the R2decreases to 0.40, and an even lower R2 of 0.22 was found in Yushe station. Yushe was impacted by more anthropogenic aerosols, indicating that mineral aerosol has a better power function relationship with visibility than the mixture of dust and anthropogenic aerosol. This is fur-ther illustrated by the same fitting for the data during SDS events only (Fig. 8). The R2reaches about 0.90 at the three SDS stations in source regions, and increases to 0.67 in the downwind station of Zhangbei.
The main model output of CUACE/Dust is dust particle concentration, but visibility is used traditionally to
distin-guish the category of SDS. The general public understands “categories” of SDS better than “concentrations” of dust. The three PM10 concentrations corresponding to a
visibil-ity of 500 m, 1000 m and 10000 m were estimated from the data during SDS events (Table 2). The stations of Hami and Yushe were not presented in Table 2, because not enough par-allel data were observed during SDS events. The best corre-sponding PM10 concentrations are found to be 14 889, 5572
and 213 µgm−3, respectively. Therefore, the traditional four categories of SDS weather can be divided by hourly PM10
concentration ranges as follows:
– Suspended dust: 200 µgm−3≤PM10
(with very low wind speed)
– Blowing dust: 200 µgm−3≤PM10<5500 µgm−3
– Sand and dust storm:
5500 µgm−3≤PM10<15 000 µgm−3
– Severe sand and dust storm: 15 000 µgm−3≤PM10
Tazhong y = 3E+08x-1.5124 R2 = 0.685 0 1000 2000 3000 4000 5000 6000 7000 8000 9000 10000 0 10000 20000 30000 40000 50000 Vis (m) PM 1 0 ( μ g m -3) (a) Zhurihe y = 1E+09x-1.6617 R2 = 0.6253 0 1000 2000 3000 4000 5000 6000 7000 8000 9000 10000 0 10000 20000 30000 40000 50000 Vis (m) PM 1 0 ( μ g m -3) (b) Zhangbei y = 9E+06x-1.2143 R2 = 0.4303 30000 40000 50000 m) 0 1000 2000 3000 4000 5000 6000 7000 0 10000 20000 Vis ( P M 1 0 ( μ g m -3) (d) M y = 3E R2 = 0 1000 2000 3000 4000 5000 6000 7000 8000 9000 10000 0 10000 20000 30000 40 Vis (m) P M 1 0 ( μ g m -3) (c) inqin +08x-1.5407 0.6729 000 50000
Fig. 7. Plot of hourly-averaged PM10 concentration vs. visibility during 3 spring seasons in the stations of (a) Tazhong, (b) Zhurihe, (c)
Minqin and (d) Zhangbei.
5 Application of observation data in model verification
Ground-based observations from the two networks and data from FY-2C satellite were assimilated in the CUACE/Dust system to improve its initial SDS condition (Niu et al., 2007). They were also used to verify the SDS forecasts from the modeled concentration of DM40 (dust particle matter with diameter less than 40 µm) (Zhou et al., 2007). This verifi-cation shows the model captured the major SDS episodes in 2006 in terms of the particle concentrations and variations at most stations (Zhou et al., 2007). Compared to the weather monitoring network, the measurements made at the SDS sta-tions are more quantitative but limited in spatial coverage (Fig. 1). For spatial verification of the model, the weather monitoring network is used. However, these weather stations represent only a few locations in SDS source regions where most SDS events occur. This disadvantage could be partly overcome by using satellite data.
Grid to grid verification is used in our SDS verification system. Ground-based observation data and the SDS data retrieval from FY-2C satellite were assigned to the grid in areas with no ground station. A GIS (Geographical Infor-mation System)-based verification system was developed in ArcView with Avenue language to compare forecasting and observation data on each 1◦
×1◦grid.
The method for dichotomous forecast (Wilks, 1995) of SDS and non-SDS was used in this study. As the refer-ence PM10concentration given above 200 µgm−3is the
con-centration threshold for distinguishing an SDS event from a non-SDS event. The SDS category we used includes all cat-egories of SDS weather from meteorological observations. For satellite observations, it implies that the IDDI index of SDS is higher or equal to 20 (Hu et al., 2007). Treat score (TS), false alarm ratio, miss ratio, accuracy and bias score were calculated from contingency table.
The spatial verification results show that in spring 2006 the daily-averaged TS values are 0.31, 0.23 and 0.21 for 24 h, 48 h and 72 h forecasting, respectively. During SDS periods, TS values dramatically increased, with the highest value of 0.63 for 24 h forecasting on 12 March, when a large SDS event occurred. But, on 1 March and 2 March, when no SDS event occurred, TS is 0.00. The SDS forecasts maintain high accuracy with average value of 0.88. Verification in differ-ent regions indicates the model performs better in western China’s Xinjiang province, with an averaged TS value of 0.4. On each grid, comparison between forecast and observation on each day in spring was also carried out. The temporal ver-ification at each grid was also calculated. Results show that TS is high in the areas around deserts, Gobi deserts and sandy
552 Y. Q. Wang et al.: SDS observation in East Asia Tazhong y = 8E+07x-1.3466 R2 = 0.8371 0 2000 4000 6000 8000 10000 0 5000 10000 15000 Vis (m) PM 1 0 ( μ g m -3 ) (a) Zhurihe y = 1E+08x-1.3687 R2 = 0.9138 0 2000 4000 6000 8000 10000 0 5000 10000 15000 20000 25000 30000 Vis (m) PM1 0 ( μ g m -3 ) (b) Zhangbei y = 8E+06x-1.1303 R2 = 0.6736 0 200 400 600 800 1000 0 10000 20000 30000 40000 50000 Vis (m) PM1 0 ( μ g m -3 ) (d) Minqin y = 6E+08x-1.6097 R2 = 0.9108 0 1000 2000 3000 4000 5000 0 5000 10000 15000 20000 25000 30000 Vis (m) PM 1 0 ( μ g m -3 ) (c)
Fig. 8. Plot of hourly-averaged PM10concentration vs. visibility during SDS events in the springtime in the stations of (a) Tazhong, (b)
Zhurihe, (c) Minqin and (d) Zhangbei.
lands that are SDS sources. In most areas, the bias scores are around 1, but in north Xinjing the model often has false pos-itives, or false alarms. North Tibetan and south China are often missed by the forecasting system.
Another version of the model without data assimilation was also run in spring of 2006. Verification results show that without assimilation there is less satisfactory performance in SDS forecasts, with TS of 0.22 for 24 h forecasting, than if the model is used with data assimilation. A detailed compar-ison of these results is presented in Niu et al. (2007).
6 Conclusions
Investigation of Asian SDS data from meteorological stations over the period 2001 to 2006, PM10and visibility data from
the SDS monitoring stations from 2004 to 2006 revealed three high SDS occurrence areas located in western China, Mongolia and northern China. More SDS events occurred in 2001 and 2006, with most strong SDS events occurring in the Mongolia source regions. High PM10 concentrations
were always associated with high frequency of SDS events in most areas of northern China. The highest PM10
con-centrations were observed in the center of the western China source with mean daily value of 876 µgm−3. In the eastern part of the northern China source this value is 335 µgm−3.
Generally in downwind areas, the mean daily PM10
concen-tration exceeds 100 µgm−3. The annual variation of PM10
concentration shows different patterns in different regions. The highest monthly mean daily PM10concentration was
ob-served in April at most SDS stations.
Good correlations are found between PM10and visibility
by power function fitting, especially during SDS events at the source regions. Three reference PM10 values of 200, 5500
and 15 000 µgm−3are estimated to classify the dust
concen-tration from the CUACE/Dust system to the SDS weather categories.
A SDS verification system was also developed based on ground–based observational data supplemented by the SDS data retrieval from FY-2C satellite. TS value of the SDS fore-casting from CUACE/Dust system is 0.31 for 24 h forecast-ing. The model performs well in SDS forecasting in East Asia, especially during large SDS events. Data assimilation improves model forecasts.
Acknowledgements. This study was supported by grants from
the National Basic Research Program of China (2006CB403701), MOST (2004DIB3J115) and CMA verification project. We are very grateful to W. Sprigg for his comments and the efforts of polishing the English writing of this paper.
Edited by: Y. Balkanski
References
CMA: Regulations of Surface Meteorological Observation, China Meteorological Press, Beijing, 21–27, 1979.
Fei, J., Zhou, J., Zhang, Q., and Chen, H.: Dust weather records in Beijing during 1860–1898 AD based on the Diary of Tonghe Weng, Atmos. Environ., 39, 3943–3946, 2005.
Gong, S. L. and Zhang, X. Y.: CUACE/Dust – an integrated system of observation and modeling systems for operational dust fore-casting system in Asia, Atmos. Chem. Phys. Discuss., 7, 10 323– 10342, 2007.
Gong, S. L., Zhang, X. Y., Zhao, T. L., and Barrie, L. A.: Sensi-tivity of Asian dust storm to natural and anthropogenic factors, Geophys. Res. Lett., 31, L07210, doi:10.1029/2004GL019502, 2004.
Hu, X. Q., Lu, N. M., Niu, T., and Zhang, P.: Operational retrieval of Asian sand and dust storm from FY-2C geostationary mete-orological satellite and its Application to real time Forecast in Asia, Atmos. Chem. Phys. Discuss., 7, 8395–8421, 2007, http://www.atmos-chem-phys-discuss.net/7/8395/2007/. Kim, K. W., Kim, Y. J., and Oh, S. J.: Visibility impairment during
Yellow Sand periods in the urban atmophere of Kwangju, Korea, Atmos. Environ., 35, 5157–5167, 2001.
Natsagdorj, L., Jugder, D. and Chung, Y. S.: Analysis of dust storms observed in Mongolia during 1937–1999, Atmos. Environ., 37, 1401–1411, 2003.
Niu, T., Gong, S. L., Zhu, G. F., Liu, H. L., Hu, X. Q., Zhou, C. H., and Wang, Y. Q.: Data assimilation of dust aerosol observations for CUAES/Dust forecasting system, Atmos. Chem. Phys. Dis-cuss., 7, 8309–8332, 2007,
http://www.atmos-chem-phys-discuss.net/7/8309/2007/. Qian, W. H., Tang, X. and Quan, L. S.: Regional characteristics of
dust storms in China, Atmos. Environ., 38, 4895–4907, 2004. Seinfeld, J. H., Carmichael, G. R., Arimoto, R., Conant, W. C.,
Brechtel, F. J., Bates, T. S., Cahill, T. A., Clarke, A. D., Doherty, S. J., Flatau, P. J., Huebert, B. J., Kim, J., Markowicz, K. M., Quinn, P. K., Russell, L. M., Russell, P. B., Shimizu, A., Shi-nozuka, Y., Song, C. H., Tang, Y. H., Uno, I., Vogelmann, A. M., Weber, R. J., Woo, J. H., and Zhang, X. Y.: ACE-ASIA – Re-gional climatic and atmospheric chemical effects of Asian dust and pollution, B. Am. Meteorol. Soc., 85, 367–380, 2004.
Sun, J., Zhang, M., and Liu, T.: Spatial and temporal characteris-tics of dust storms in China and its surrounding regions, 1960– 1999: Relations to source area and climate, J. Geophys. Res., 106, 10 325–10 333, 2001.
Wang, S., Wang, J., Zhou, Z., and Shang, K.: Regional character-istics of three kinds of dust storm events in China, Atmos. Envi-ron., 39, 509–520, 2005.
Wang, Y. Q., Zhang, X. Y., and Arimoto, R.: The Contribution from Distant Dust Sources to the Atmospheric Particulate Matter Loadings at XiAn, China during Spring, Sci. Total Environ., 368, 875–883, 2006.
Wang, Y. Q., Zhang, X. Y., Arimoto, R., Cao, J. J., and Shen, Z. X.: The transport pathways and sources of PM10 pollution in
Beijing during spring 2001, 2002 and 2003, Geophys. Res. Lett., 31, L14110, doi:10.1029/2004GL019732, 2004.
Watson, J.: Visibility: Science and Regulation, J. Air Waste Man-age., 52, 628–713, 2002.
Wilks, D. S.: Statistical Methods in the Atmospheric Sciences, Aca-demic Press, San Diego, 1995.
Yang, Y. Q., Zhou, C. H., Liu, H. L., Wang, Y. Q., and Niu, T.: Sand/dust storm processes in Northeast Asia and associated large-scale circulation., Atmos. Chem. Phys., 8, 25–33, 2007, http://www.atmos-chem-phys.net/8/25/2007/.
Zhang, X. Y., Arimoto, R., and An, Z. S.: Dust emission from Chi-nese desert sources linked to variations in atmospheric circula-tion, J. Geophys. Res., 102, 28 041–28 047, 1997.
Zhang, X. Y., Arimoto, R., An, Z. S., Chen, T., Zhang, G. Y., Zhu, G. H., and Wang, X. F.: Atmospheric trace elements over source regions for Chinese dust: Concentrations, sources and at-mospheric deposition on the Loess Plateau, Atmos. Environ., 27, 2051–2067, 1993.
Zhang, X. Y., Arimoto, R., Zhu, G. H., Chen, T., and Zhang, G. Y.: Concentration, size-distribution and deposition of mineral aerosol over Chinese desert regions, Tellus, 50B, 317–330, 1998. Zhang, X. Y., Gong, S. L., Zhao, T. L., Arimoto, R., Wang, Y. Q., and Zhou, Z. J.: Sources of Asian dust and role of climate change versus desertification in Asian dust emission, Geophys. Res. Lett., 30, 2272, doi:10.1029/2003GL018206, 2003. Zhou, C. H., Gong, S. L., Zhang, X. Y., Wang, Y. Q., Niu, T.,
Liu, H. L., Zhao, T. L., Yang, Y. Q., and Hou, Q.: Develop-ment and evaluation of an operational SDS forecasting system for East Asia: CUACE/Dust, Atmos. Chem. Phys. Discuss., 7, 7987–8015, 2007,
http://www.atmos-chem-phys-discuss.net/7/7987/2007/. Zhou, Z. J.: Blowing-sand and sandstorm in China in recent 45
years, Quaternary Sciences, 21, 9–17 (in Chinese), 2001. Zhou, Z. J. and Zhang, G. C.: Typical severe dust storms in
north-ern China during 1954–2002, Chinese Sci. Bull., 48, 2366–2370, 2003.