HAL Id: hal-00673515
https://hal-brgm.archives-ouvertes.fr/hal-00673515
Submitted on 23 Feb 2012HAL is a multi-disciplinary open access
archive for the deposit and dissemination of sci-entific research documents, whether they are pub-lished or not. The documents may come from teaching and research institutions in France or abroad, or from public or private research centers.
L’archive ouverte pluridisciplinaire HAL, est destinée au dépôt et à la diffusion de documents scientifiques de niveau recherche, publiés ou non, émanant des établissements d’enseignement et de recherche français ou étrangers, des laboratoires publics ou privés.
Experimental determination of the role of diffusion on Li
isotope fractionation during basaltic glass weathering
A. Verney-Carron, Nathalie Vigier, Romain Millot
To cite this version:
A. Verney-Carron, Nathalie Vigier, Romain Millot. Experimental determination of the role of diffusion on Li isotope fractionation during basaltic glass weathering. Geochimica et Cosmochimica Acta, Elsevier, 2011, 75, pp.3452-3468. �10.1016/j.gca.2011.03.019�. �hal-00673515�
Accepted Manuscript
Experimental determination of the role of diffusion on Li isotope fractionation during basaltic glass weathering
A. Verney-Carron, N. Vigier, R. Millot
PII: S0016-7037(11)00175-X
DOI: 10.1016/j.gca.2011.03.019
Reference: GCA 7148
To appear in: Geochimica et Cosmochimica Acta
Received Date: 19 July 2010 Accepted Date: 15 March 2011
Please cite this article as: Verney-Carron, A., Vigier, N., Millot, R., Experimental determination of the role of diffusion on Li isotope fractionation during basaltic glass weathering, Geochimica et Cosmochimica Acta (2011), doi: 10.1016/j.gca.2011.03.019
This is a PDF file of an unedited manuscript that has been accepted for publication. As a service to our customers we are providing this early version of the manuscript. The manuscript will undergo copyediting, typesetting, and review of the resulting proof before it is published in its final form. Please note that during the production process errors may be discovered which could affect the content, and all legal disclaimers that apply to the journal pertain.
Experimental determination of the role of diffusion on Li isotope fractionation
1
during basaltic glass weathering
2
3 4
A. Verney-Carron a,1*, N. Vigier a, R. Millot b 5
6
a
CRPG-CNRS, 15 rue Notre Dame des Pauvres, 54501 Vandoeuvre les Nancy, France
7
b
BRGM, Metrology Monitoring Analysis Department, 3 avenue Claude Guillemin, BP 36009, 45060 Orléans
8
Cedex 2, France
9 1
Present address: LISA, UMR 7583, UPEC, UPD, 61 avenue du Général de Gaulle, 94010 Créteil Cedex,
10 France. 11 12 13 14
Revised version 14 March 2011 15
16
Keywords: Li isotopes, isotope fractionation, diffusion, basaltic glass 17
Abstract
18 19
In order to use lithium isotopes as tracers of silicate weathering, it is of primary 20
importance to determine the processes responsible for Li isotope fractionation and to 21
constrain the isotope fractionation factors caused by each process as a function of 22
environmental parameters (e.g. temperature, pH). The aim of this study is to assess Li isotope 23
fractionation during the dissolution of basalt and particularly during leaching of Li into 24
solution by diffusion or ion exchange. To this end, we performed dissolution experiments on a 25
Li-enriched synthetic basaltic glass at low ratios of mineral surface area/volume of solution 26
(S/V), over short timescales, at various temperatures (50 and 90°C) and pH (3, 7, and 10). 27
Analyses of the Li isotope composition of the resulting solutions show that the leachates are 28
enriched in 6Li (δ7Li = +4.9 to +10.5‰) compared to the fresh basaltic glass (δ7Li = +10.3 ± 29
0.4‰). The δ7Li value of the leachate is lower during the early stages of the leaching process, 30
increasing to values close to the fresh basaltic glass as leaching progresses. These low δ7Li 31
values can be explained in terms of diffusion-driven isotope fractionation. In order to quantify 32
the fractionation caused by diffusion, we have developed a model that couples Li diffusion 33
with dissolution of the glassy silicate network. This model calculates the ratio of the diffusion 34
coefficients of both isotopes (a=D7/D6), as well as its dependence on temperature, pH, and
35
S/V. a is mainly dependent on temperature, which can be explained by a small difference in 36
activation energy (0.10 ± 0.02 kJ/mol) between 6Li+ and 7Li+. This temperature dependence 37
reveals that Li isotope fractionation during diffusion is low at low temperatures (T < 20°C), 38
but can be significant at high temperatures. However, concerning hydrothermal fluids (T > 39
120°C), the dissolution rate of basaltic glass is also high and masks the effects of diffusion. 40
These results indicate that the high δ7Li values of river waters, in particular in basaltic 41
catchments, and the fractionated values of hydrothermal fluids are mainly controlled by 42
precipitation of secondary phases. 43
1. INTRODUCTION
44 45
Silicate weathering has a major impact on the carbon cycle over long timescales, 46
because Ca and Mg are released during dissolution of silicate minerals which in turn leads to 47
consumption of atmospheric carbon dioxide via formation of carbonate in the oceans (e.g. 48
Ludwig et al., 1999; Dupré et al., 2003; Lerman et al., 2007; Franck et al., 2008; Hartmann et 49
al., 2009). Basalt are among the most easily weathered silicate rocks, therefore basalt 50
weathering potentially represents a significant atmospheric CO2 sink and a major source of
51
oceanic Ca and Mg (Louvat and Allègre, 1997, 1998; Gaillardet et al., 1999; Dessert et al., 52
2003). Assessing the contribution of basaltic weathering to rivers is therefore of primary 53
importance. A significant portion of basalt weathering is likely due to alteration of basaltic 54
glass: the glassy phase and hyaloclastites have been shown to play a key role in determining 55
the chemical and isotope compositions of river waters in volcanic regions (e.g. Gislason and 56
Oelkers, 2003, and references therein; Wolff-Boenisch et al., 2004; Vigier et al., 2006). This 57
is consistent with their more rapid dissolution relative to basalt minerals (e.g. Wolff-Boenisch 58
et al., 2006). 59
In this context, lithium isotopes could represent a powerful tracer of basalt weathering 60
as river Li isotope compositions appear to be correlated with weathering rates of silicate 61
lithologies present within the basin (Kisakürek et al., 2005; Vigier et al., 2009; Pogge von 62
Strandmann et al., 2010; Millot et al., 2010b). Lithium has two stable isotopes, 6Li and 7Li, 63
whose large relative mass difference is responsible for significant isotopic fractionation 64
during physico-chemical processes. Lithium is comparatively enriched in silicates (5 to 33 65
ppm for the continental crust, Teng et al, 2008) but is present at low concentrations in 66
carbonates (< 2 ppm, Hoefs and Sywall, 1997). Moreover, this element does not play a 67
significant role in biological or atmospheric cycles (Lemarchand et al., 2010; Millot et al., 68
2010c). The Li isotope compositions of catchment rocks and river waters are significantly 69
different with rivers systematically enriched in 7Li. To date, this has been interpreted as the 70
result of Li isotopic fractionation during silicate weathering (Huh et al., 1998, 2001; Pogge 71
von Strandmann et al., 2008, 2010; Vigier et al., 2009; Millot et al., 2010a). In more detail, 72
the 7Li enrichment of dissolved loads of river waters has been explained by (1) the formation 73
of secondary phases, especially clay minerals, and their preferential uptake of 6Li (e.g. Chan 74
and Edmond, 1988; Chan et al., 1992; Vigier et al., 2008) and (2) a preferential release of 7Li 75
from the mineral into solution (Huh et al., 2004; Kisakürek et al., 2004; Rudnick et al., 2004; 76
Teng et al., 2004). This second assumption was supported by the particularly high δ7Li values 77
(δ7Li = ((7Li/6Li)sample / (7Li/6Li)LSVEC - 1) × 1000) measured in river waters draining areas
78
with little or no soils, such as the Canadian shield (Millot et al., 2010b) or high altitude zones 79
in the Andes and the Himalayas (Huh et al., 2001; Kisakürek et al., 2005). 80
Preferential uptake of 6Li during the formation of clay minerals was initially suggested 81
by field studies (e.g. Chan and Edmond, 1988; Chan et al., 1992, 1994, 2002; Zhang et al., 82
1998) and then confirmed by experimental work (e.g. Williams and Hervig, 2005; Vigier et 83
al., 2008; Pistiner and Henderson, 2003). In contrast, preferential release of 7Li during 84
weathering of minerals has not been verified in the laboratory. Leaching experiments have 85
been performed with basalt, weathered basalt and sediments at high temperatures (up to 86
350°C) and pressures (400-800 bars) with the aim of assessing the contributions of basalt 87
and/or sediment leaching to the Li budget during alteration in hydrothermal systems (Chan et 88
al., 1994; Seyfried et al., 1998, James et al., 2003). These authors reported fluid δ7Li values 89
initially heavier than those of the mineral but then progressively becoming lighter 90
(approaching that of the starting mineral). All these experiments were conducted under rock-91
dominated conditions (i.e. high reactive surface area/volume of solution, S/V, or low 92
water/rock ratio, W/R). These conditions greatly favour the formation of secondary mineral 93
phases which could also influence the Li isotopic compositions measured in solution. 94
Experiments conducted by Millot et al. (2010a) were carried out at lower temperatures (25 to 95
250°C), but also at relatively low W/R ratio, with the intention of precipitating secondary 96
phases even at the onset of the experiment. Pistiner and Henderson (2003) performed basalt 97
alteration experiments at low pH (~ 1) and low S/V (to avoid precipitation of secondary 98
minerals), and did not observe any significant isotope fractionation after 1 week of 99
dissolution. Finally, recent forsterite and basalt glass dissolution experiments were conducted 100
by Wimpenny et al. (2010) at far from equilibrium conditions and at low pH and temperature. 101
The results revealed no isotope fractionation during leaching of forsterite. For the basalt glass 102
the δ7
Li values of the leachates produced by weathering are equal or slightly lower than the 103
fresh glass δ7
Li value. 104
In this study, we performed leaching experiments on basaltic glass at far from 105
equilibrium conditions in order to favour leaching/dissolution processes, and to minimise any 106
potential secondary mineral precipitation. The objective is to quantify Li isotopic 107
fractionation during the leaching/dissolution process. To this end, the experiments were 108
conducted at very low S/V ratios (i.e. very high water/rock ratio). The basaltic glass was 109
highly enriched in lithium in order to permit precise measurements of Li isotope in the 110
leachates during the early stages of the alteration process. By combining major element and 111
Li isotope data, we have developed a coupled diffusion-dissolution model which quantifies Li 112
isotope fractionation. 113
114
2. EXPERIMENTAL METHODS AND ANALYTICAL PROCEDURES
115 116
2.1. Experimental setup
117 118
2.1.1. Materials
119
A synthetic basaltic glass was doped with 1% Li2O using the procedure described in
120
Techer et al. (2001), i.e. by melting a mixture of powdered oxides, carbonates, nitrates and 121
phosphates in alumina crucibles for 3 h at 1500°C. The resulting melt was then poured into 122
graphite crucibles preheated at 700°C. The glass was heat treated at 670°C for 1 h, then 123
cooled to room temperature in 10 h. Concentrations of major cations (Si, Al, Fe, Mn, Mg, Ca, 124
Na K, Ti, and P) were determined by ICP-AES (IRIS Thermo Elemental) at the SARM 125
(French national facilities, Nancy). Li concentrations were analyzed using atomic absorption 126
spectrometry (AAS) (VARIAN220 FS) at the SARM. Uncertainties range between 5 and 20% 127
depending on the element and its concentration. 128
The homogeneity of Li isotopic composition of the glass was determined by ion 129
microprobe (CAMECA ims3f), using classical energy filtering techniques (Chaussidon and 130
Robert, 1998). The samples were sputtered with a 3nA primary O- beam then secondary 131
positive ions including 6Li+ and 7Li+ were accelerated at 4.5 kV and were analysed at a mass 132
resolution M/ΔM of 1200 (to remove the interfering 6LiH+ at mass 7) and with the energy slit 133
centred and fully opened. Counting times were 9s for 6Li and 3s for 7Li over 40 cycles. 134
135
2.1.2. Reactive surface area determination 136
The synthetic basaltic glass was ground and sieved in order to recover the 40-100 µm 137
particle size fraction which was then washed and ultrasonicated in acetone in order to remove 138
any finer particles remaining. The glass powder was stirred in a beaker containing 12 cm 139
depth of acetone. According to Stokes' law, >40 μm particles reach the bottom of the beaker 140
in 15 s; after this time, the supernatant solution is removed from the beaker. This procedure 141
was repeated until the supernatant was clear. The specific surface area was measured by 142
krypton adsorption using the BET method and is 842 ± 5 cm2 g-1. To assess the consistency of 143
this result, the BET value was compared with the geometric surface area (in cm2 g-1) which 144
can be expressed as the product of the surface area of a sphere (Ssphere) by the number of
145
spheres (n) divided by the mass (m) of the n spheres: 146 147 r r n r n m S n Sgeo sphere × = × × × = × = ρ ρ π π 3 3 4 4 3 2 (1) 148 149
where ρ is the density of the glass (2.7 ± 0.1 g cm-3, measured by pycnometry) and r is the 150
grain average radius (in cm). While Eq. (1) yields a geometric surface area of 350 cm2 g-1 that 151
is 2.4 times lower than the measured surface area these results are nevertheless consistent 152
because surface roughness and the non-spherical nature of the grains will increase true surface 153
area compared to that calculated by Eq. (1). 154
155
2.1.3. Experiments 156
The objective of the experiments (PW-90, PH3-90, PH10-90, and PW-50; Table 1) 157
was to determine the evolution of Li concentration and isotopic composition of the leachate at 158
'far from equilibrium' conditions. For this, these experiments were carried out in Savillex® 159
PTFE reactors under static conditions, at a low S/V ratio (0.7 cm-1) and over short timescales 160
(< 4 days). The batch solution was not stirred in order to prevent grinding of the glass and 161
progressive increase of the reactive surface area. However, the mass of glass introduced in the 162
reactor is sufficiently low (~50 mg for the majority of experiments) so that transport processes 163
are never rate-limiting. 164
For the experiments performed in pure water (Milli-Q water) (PW) at 90 and 50°C 165
(PW-90 and PW-50), a separate reactor was used for each run. Typically, 50 mg of glass 166
powder was placed in the Savillex® PTFE reactors with 50 mL of solution. For the other 167
experiments, one single larger reactor (120 or 250 mL) was used. Each time the solution was 168
sampled, the reactor was manually agitated and opened for a maximum of a few minutes. 169
The pH was measured at the in situ temperature. However, the temperature of the 170
sampled aliquot can rapidly decrease during pH measurements. Consequently, the 171
temperature was also monitored during the pH measurement for calculations. The samples 172
were filtered at 0.45 µm, and then acidified with concentrated HNO3 to obtain 0.3 N HNO3
173
for ICP-AES and AAS analyses. 174
Both the influence of pH (pure water, pH 3 and pH 8.4 at 90°C) and temperature (50 175
and 90°C) were tested. An initial pH of 3 was obtained by addition of 0.001 M HCl, and an 176
initial pH of 8.4 at 90°C was obtained by addition of 0.0001 M NaOH. In order to determine 177
the influence of the S/V ratio, two leaching experiments were carried out with pure water at 178
90°C, with a S/V ratio of 0.7 and 7 cm-1 respectively, simply by changing the amount of glass 179
powder initially introduced into the beaker (experiments SV1 and SV2, respectively, see 180 Table 1). 181 182 2.2. Li isotope analyses 183 184
In order to analyse the Li isotopic composition of the synthetic basaltic glass, the 185
complete dissolution of ~ 10 mg of glass was performed using a mixture of concentrated 186
hydrofluoric and nitric acids heated on a hotplate at 100°C, in a closed Teflon beaker for 1 187
day. The solutions were then evaporated, re-dissolved in 1M HCl, and ultrasonicated. 188
For analysis of the leachate samples, an aliquot containing 30 - 60 ng of Li was 189
evaporated and re-dissolved in 1 M HCl. 190
Li was separated from the sample matrix by cation exchange chromatography, as 191
described in Vigier et al. (2008) and Lemarchand et al. (2010). Li isotopes were measured on 192
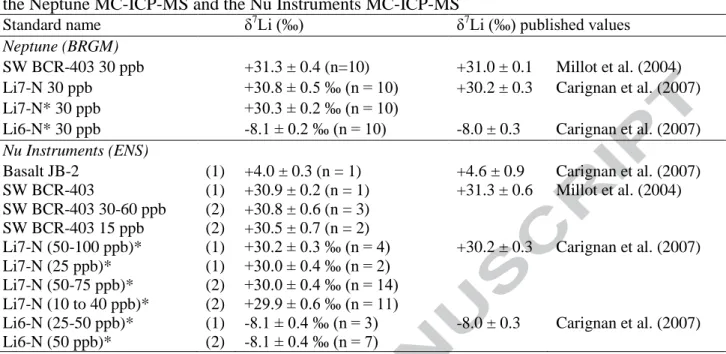
pure Li fractions with a Thermo-Fisher Neptune Multi Collector-ICP-MS at the BRGM 193
(Orléans, France) (Millot et al., 2004 ), and with a Nu Instruments Multi Collector-ICP-MS at 194
the ENS (Lyon, France). Li isotope ratios were measured relative to the L-SVEC standard 195
solution (NIST SRM 8545, Flesch et al., 1973) using a standard-sample bracketing technique 196
in order to correct for instrumental mass bias. Li isotope ratios are expressed in δ notation as 197
the part per thousand (‰) deviation from L-SVEC composition. 198
For MC-ICP-MS measurements with the Neptune (BRGM), the analytical protocol 199
involved acquisition of 15 ratios with 16 s integration time per ratio, and yielded in-run 200
precision better than 0.2‰ (2σ). Blank values were low (i.e. 0.2% of the Li signal) and 5 201
minutes wash time was sufficient to reach a stable background value. The Li concentration in 202
solution required for analysis was 30 ppb. The accuracy and reproducibility of the whole 203
method (separation + MC-ICP-MS analysis) was tested by repeated measurements of a 204
seawater standard solution (IRMM BCR-403, Millot et al., 2004) and the Li7-N reference 205
solution (Carignan et al., 2007) (Table 2). 206
The Li isotopic compositions we determined for Li7-N and seawater BCR-403 were 207
+30.8 ± 0.5 ‰ (n = 10) and +31.3 ± 0.4 ‰ (n = 10), respectively, which are in agreement 208
with published values (Millot et al., 2004; Carignan et al., 2007 and references therein). The 209
accuracy and reproducibility of the MC-ICP-MS analysis (without separation chemistry) was 210
also assessed during the session with two standards, Li7-N and Li-6N (Carignan et al., 2007). 211
The average values are δ7Li = +30.3 ± 0.2 ‰ (n = 10) for Li7-N and δ7
Li = -8.1 ± 0.3 ‰ (n = 212
10) for Li6-N, and are similar to values reported in the literature (Carignan et al., 2007). 213
For both sessions of MC-ICP-MS measurements with the Nu Instruments (ENS-214
Lyon), the typical Li concentration of the analysed solutions was 60 ppb. The accuracy and 215
reproducibility of the method was tested with the JB-2 basalt standard (Table 2). The δ7Li 216
value of JB-2 is +4.0 ± 0.3 ‰ (n = 1) which is consistent with published values (e.g. Carignan 217
et al., 2007). The values of the three standards, SW BCR403, Li7-N, and Li6-N, are also in 218
agreement with previously reported values (Table 2). Reference solutions were also analysed 219
at reduced concentrations in order to assess the reproducibility and the confidence in 220
measuring lower concentration solutions (Table 2). The δ7Li of SW BCR403 at 15 ppb is 221
+30.5 ± 0.7 ‰ (n = 2). The δ7Li of Li7-N (10 to 40 ppb) does not change significantly as a 222
function of Li content. However, the corresponding internal errors are higher when the Li 223
concentrations are lower (see Table 2). 224
225
2.3. Calculation of solution saturation states
226 227
Analyses of the chemical composition and temperature measurements of the leachate 228
solutions can be used to calculate mineral saturation indices using the JCHESS speciation 229
code (van der Lee and De Windt, 2002). JCHESS uses a thermodynamic database which is 230
based on the EQ3/6 database (Wolery, 1992). Because of the rapid cooling (around 75°C) of 231
the solution during the pH measurements, the solution pH was recalculated from the major 232
cation concentrations, by assuming electroneutrality at the measurement temperature. If the 233
agreement between the measured pH and the calculated value is good, then both the solution 234
analyses and the pH measurements are valid. The solution pH at the temperature of the 235
experiment (90 or 50°C) was recalculated by changing the temperature in JCHESS. 236
237
3. RESULTS
238 239
3.1. Composition of the fresh synthetic basaltic glass
240 241
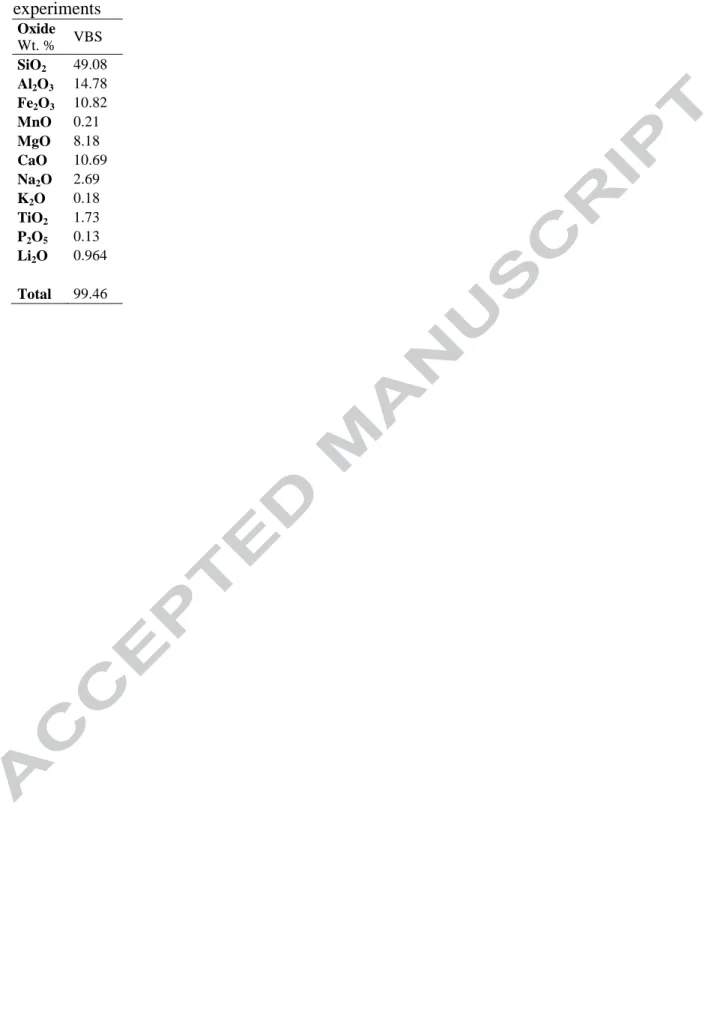
The composition of the synthetic basaltic glass is given in Table 3. Its composition is 242
consistent with published analyses for the same glass (Techer et al., 2001). Except for the 243
enrichment in Li, the composition is typical of basalt from mid-ocean ridges (MORB) (e.g. 244
Schiano et al., 1997). 245
The bulk Li isotopic composition of the fresh synthetic basaltic glass was determined 246
for 3 different powder aliquots by MC-ICP-MS and is +10.3 ± 0.4 ‰ (2σ). The homogeneity 247
of the glass Li isotopic composition was also determined by ion microprobe. The standard 248
deviation of 34 measurements in 2 different grains is 0.7‰. The standard deviation of the 249
GB4 glass standard (Chaussidon and Robert, 1998) analysed during the same session is 0.4‰ 250
(n=7). The synthetic basaltic glass used for the alteration experiments is therefore considered 251
to be isotopically homogeneous, relative to the overall uncertainty of the Li isotope 252
measurements. 253
254
3.2. pH and chemical composition of the leachates
255 256
At 90°C, the agreement between measured and calculated pH (from major elements) 257
was good. For example, the pH measured at 75°C for the PH10-90 experiment after 1 day was 258
8.5. The pH calculated from elemental concentrations in solution is also 8.5 at 75°C. Thus the 259
pH recalculated at the temperature of the experiment, i.e. 90°C, is 8.3 (see Table 4). For this 260
experiment the difference between experimental and calculated pH at the measurement 261
temperature is never higher than 0.1 pH unit. For the other experiments, the difference is 262
always less than 0.3 pH unit, except for the fluid sampled towards the end of the experiments 263
(34 d for pH3-90, 63 d for experiments SV1 and SV2) where the discrepancy reaches 0.7 pH 264
unit, probably because of carbonation effects that decrease the measured pH. 265
For experiments performed in pure water at 90°C (PW-90, SV1, SV2), the pH rapidly 266
increases to 8.5-9. For the experiment PH10-90, the initial pH of 8.4 remains more or less 267
constant. In the experiments with dilute nitric acid, the pH starts at a value of 3 and then does 268
not evolve significantly, except at 34 days. In the experiment performed at 50°C, pH increases 269
from 6.6 to 7.7 (Table 4). 270
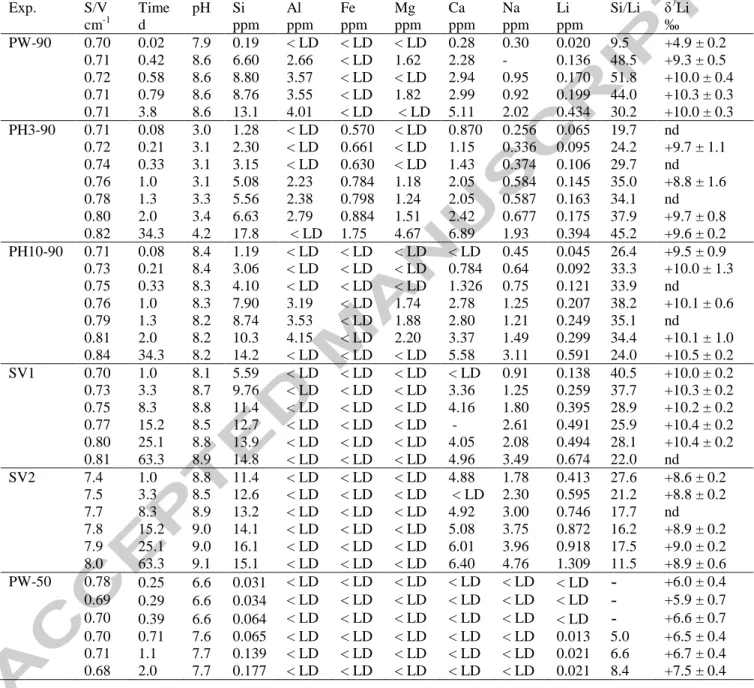
The evolution of the silicon concentration in solution (Table 4, Fig. 1a) is quite similar 271
for all of the experiments performed at 90°C. The Si content increases linearly as a function 272
of time, as expected by a pure and constant dissolution process, and then reaches a plateau at 273
around 15-18 mg L-1 after a few days. It is noteworthy that lithium concentration is not a 274
linear function of time, and the pattern is different for different experiments (Table 4, Fig 1b). 275
Solution lithium contents are lower for experiments at S/V=0.7 cm-1 than they are for 276
experiments with S/V = 7 cm-1. 277
In order to compare the behaviour of all the analysed elements in more detail, 278
concentrations can be converted to the normalized mass loss (NL(i)). NL(i) corresponds to the 279
concentration Ci in solution (where i is the element analyzed) in g L-1 corrected for the S/V
280
ratio and the initial glass mass fraction. NL(i) is expressed in g m-2 and is given by: 281 282 i i x S V C i NL × × = ) ( (2) 283 284
where xi is the initial fraction of the element i in the bulk glass.
285
NL(i) therefore represents the equivalent quantity of leached glass per unit area. 286
Consequently, the NL notation allows a direct comparison of each element (i) released into 287
solution for all the experiments. Indeed, if the NL values are equal for all elements, then 288
dissolution can be considered to be congruent. In contrast, if the NL value of a particular 289
element is higher or lower than the NL values for silicon, then the element is probably 290
affected by processes in addition to dissolution, such as diffusion or secondary phase 291
formation. 292
The NL values based on all the elements analysed in this study are reported in Table 5. 293
For the experiment PW-90, Al, Ca, and Mg releases are congruent with Si release, as they all 294
display similar NL values (Fig. 2). Ca and Mg are modifier cations in silicate network, 295
whereas Al and Si are network-forming cations. However, under the experimental conditions 296
used in this study, their behaviour is similar, indicating negligible formation of secondary 297
minerals. The alkalis (Na and Li) are mobile elements and their rates of release are greater 298
than Si, as NL values for Na and Li are systematically higher (Table 5). Their behaviour is 299
clearly non-stoichiometric. All the experiments display this discrepancy (NL(Li,Na) > 300
NL(Si)), except for the experiment at pH 3, where the dissolution is nearly congruent for 301
alkalis as well. 302
303
3.3. Alteration kinetics of the basaltic glass
304 305
The release of Si into solution is caused by hydrolysis of the glass network (Bunker, 306
1994; Oelkers, 2001). The dissolution rate intrinsically depends on the properties of the glass 307
(composition, structure, etc.), but also on the chemistry of the solution. Two kinetic regimes 308
can be distinguished: (1) The 'initial' or 'forward' dissolution rate is measured if the solution is 309
sufficiently renewed or diluted. Under these conditions, the evolution of Si concentrations in 310
solution (and therefore NL(Si)) is linear as a function of time, as observed in the first few 311
hours of the experiments (Fig. 2). (2) The dissolution rate drops as the solution chemical 312
composition approaches equilibrium (e.g. Aagard and Helgeson, 1982), and a gel layer forms 313
at the surface of the glass (e.g. Frugier et al., 2008). The accumulation of elements in solution, 314
especially silicon, decreases the dissolution rate, as it reduces the chemical affinity between 315
the solution and the glass. This chemical affinity term is a parameter often used in kinetic 316
laws describing glass alteration (Grambow, 1985; Berger et al., 1994; Daux et al., 1997; 317
Frugier et al., 2009; Verney-Carron et al., 2010). The release of dissolved elements in solution 318
may also lead to the formation of secondary minerals. If this is the case, the dissolution 319
becomes incongruent. 320
321
3.3.1. Glass dissolution rate 322
For the experiment in pure water at 90°C (PW-90), the evolution of NL(Si) as a 323
function of time is constant between 0 and 0.6 days (Fig. 2). For the experiment in pure water 324
at 50°C (PW-50), the Si release rate is constant for the whole duration of the experiment (2 325
days). In both cases, the corresponding initial dissolution rate (r0) normalized to the Si content
326
can be determined by linear regression of the data (Fig. 3a): 327 328 dt Si dNL r0 = ( ) (3) 329 330
The 'initial' dissolution rate r0 is thus estimated to be 0.927 g/m²/d, i.e. 3.8 × 10⁻⁷ mol Si/m²/s
331
at 90°C and pH 8.6, and 0.0062 g/m²/d, i.e. 2.6 × 10⁻⁹ mol Si/m²/s at 50°C and pH 6.6 (Fig. 332
3a). These values are consistent with published data obtained at similar pH and temperatures 333
although it should be noted that there are large differences among basaltic glass dissolution 334
rate estimates reported in the literature (mainly caused by difficulties assessing the reactive 335
surface area). Initial dissolution rates for basaltic glass at pH between 8.2 and 8.6, and at 336
temperatures between 90°C and 100°C, range between 1.1 × 10⁻⁸ and 9.8 × 10⁻⁷ mol Si/m²/s 337
(Guy and Schott, 1989; Daux et al., 1997; Techer et al., 2000; Gislason and Oelkers, 2003). 338
At 50°C, the initial rate at neutral pH ranges between 2.1 × 10⁻¹⁰ and 1.9 × 10⁻⁸ mol Si/m²/s 339
(Guy and Schott, 1989; Gislason and Oelkers, 2003). 340
For the experiment in pure water at 90°C (PW-90), the Si release rate slows down after 341
0.6 days (Fig. 2). The corresponding dissolution rate calculated by linear regression is 0.08 342
g m-2 d-1 between 0.6 and 4 days, i.e. one order of magnitude lower than the initial dissolution 343
rate (r0). A similar feature is observed for the other experiments after a few hours (Table 4).
344
This highlights the feedback effect of the solution chemistry, especially dissolved silicon, on 345
glass dissolution kinetics (Aagard and Helgeson, 1982). For longer times (> 15 days), in 346
experiments SV1, SV2, pH3-90, and pH10-90, Si concentrations reach a plateau, which is 347
around 15-18 mg L-1 for experiments performedat 90°C. This plateau was also observed by 348
Techer et al. (2001) under similar conditions (pure water, 90°C, S/V = 0.5 cm-1) and likely 349
corresponds to a saturation state of the solution, i.e. to a decrease of the chemical affinity 350
term, and to secondary phase precipitation. The solution is still thermodynamically 351
undersaturated relative to silica phases, but is close to the solubility product of quartz (i.e. 19 352
mg L-1 at 90°C and pH < 9.2). 353
As discussed previously, the formation of secondary phases can be assessed by 354
comparing the normalized mass losses (NL). Iron forms oxides or hydroxides, whose 355
solubilities are very low, and NL(Fe) is much lower than NL(Si). Generally, Si, Al, Mg, and 356
Ca are able to be incorporated into secondary minerals, especially smectites, which are 357
frequently associated with basaltic glass alteration at these temperatures (Stroncik and 358
Schmincke, 2001; Crovisier et al., 2003). However, the relative difference between NL for 359
Ca, Al, Mg, and Si in all the experiments performed in this study is never more than 25%, 360
which is close to analytical uncertainties. Solution saturation indices have been calculated 361
using JCHESS in order to assess the potential formation of secondary minerals. In solutions 362
where Al concentrations were below detection limits, the leachates are undersaturated relative 363
to all the minerals of the database. The leachates where Al concentrations could be measured 364
are over-saturated relative to Al (oxi-)hydroxides (boehmite, diaspore, gibbsite), kaolinite 365
(rarely observed as an alteration product of the basaltic glass), and smectites for the 366
experiments at alkaline pH (pH10-90). It is therefore possible that smectites formed during 367
our experiments but in insufficient quantity to significantly affect the congruency of the 368
dissolution, or to be observed by SEM. 369
370
3.3.2. Li apparent diffusion coefficients 371
The behaviour of the alkalis is non-stoichiometric for the first leaching steps of most 372
experiments: the release rate of these elements is higher than that of Si, as witnessed by their 373
greater normalized mass losses. This strongly suggests that the alkalis are controlled by a 374
diffusion process, while Si is mainly controlled by dissolution at this stage of the experiment 375
(as demonstrated by its initial linear evolution through time). Moreover, the Li normalized 376
mass losses follows a square root time evolution, (Fig. 3b), as predicted by Fick’s second law 377
which predicts how diffusion causes concentration changes with time: 378 379 ⎟⎟⎠ ⎞ ⎜⎜⎝ ⎛ ∂ ∂ = ⎟ ⎠ ⎞ ⎜ ⎝ ⎛ ∂ ∂ 2 2 x C D t C (4) 380 381
where the coordinate x is zero at the original glass surface, and where C = 0 at x = 0. 382
The resolution of this law can therefore be used to determine the apparent diffusion 383
coefficient Dapp of glass alkalis into solution from their concentrations in solution (e.g. Chave
384
et al., 2007). For lithium, resolution of Eq. (4) leads to: 385 386 π ρ t D Li NL EHG = ( ) =2 app (5) 387 388
where EHG is the equivalent hydrated glass thickness over which diffusion occurs, NL(Li) the
389
normalized mass loss for lithium, ρ the glass density (ρ = 2.7 g cm-3). The Dapp values can be
390
calculated by linear regressions (NL(Li) = f(√t)). The slope corresponds to 2ρ√(Dapp/π). The
391
calculated apparent diffusion coefficients for Li are 6.0 × 10⁻¹⁹ m2 s-1 at 90°C and pH 9, and 392
3.5 × 10⁻²¹ m2 s-1 at 50°C and pH 6.6 (Fig. 3b). 393
394
3.4. Respective contribution of the diffusion and dissolution processes
395 396
In the early stages of the alteration process, Si is a tracer of dissolution while Li is 397
affected by diffusion and by dissolution. Consequently, the solution Si/Li ratio gives an 398
indication of the respective contribution of both processes (Table 4). Si/Li (%wt ratio) of the 399
fresh basaltic glass is 51. For all the experiments, the Si/Li ratios of the leachates are much 400
lower in the early stages of alteration (between 5 and 40, Table 4). This highlights Li 401
diffusion through the leached layer. The lowest Si/Li ratios (between 5 and 10) are found for 402
the experiment performed at 50°C, suggesting that the relative role of diffusion (compared to 403
dissolution) is greater at low temperature. This implies that the activation energy of the 404
diffusion process is lower than the activation energy of the dissolution process. For 405
experiments SV1 and SV2, characterized by different initial S/V, Si/Li ratios measured in the 406
leachates are significantly different, with Si/Li being 1.5 times lower for the high S/V ratio 407
experiment (SV2). With a greater reactive surface area, the silicon concentration of the 408
solution remains the same at saturation, but Li contents are significantly higher. This, again, 409
suggests that diffusion, which is a surface dependent process, partly controls the release of Li. 410
411
3.5. Li isotopic composition of the leachates
412 413
All the δ7Li values of the leachates are equal to or lower than the δ7Li of the fresh 414
basaltic glass (Fig. 4, Table 4), ranging between +4.9 ± 0.2 ‰ and +10.5 ± 0.2 ‰. The 415
amount of Li released in solution is always low compared to the amount of the Li available in 416
the glass: generally less than 10%, and less than 5% in the early stages of alteration. The 417
lowest solution δ7Li values are found during the early stages of alteration. Then for 418
experiments PW-90, PH10-90 and SV1, δ7Li increases with time to a plateau which is close to 419
the δ7
Li value of the fresh basaltic glass (Fig. 4). However, at a given temperature (90°C), the 420
δ7
Li value of the plateau is "lower" at high S/V (+9.6 ± 0.2 ‰ for experiment SV2) (Fig. 4c). 421
For a given S/V, δ7
Li evolves towards the fresh basaltic glass value more slowly at 422
50°C (PW-50) than at 90°C (PW-90) (Fig. 4a). After two days of leaching, δ7
Li is around 423
+7.5 ± 0.4 ‰ for the experiment performed at 50°C, whereas the fresh basaltic glass δ7
Li 424
value is reached after less than 1 day for the 90°C experiments. 425
Comparison between the 90°C experiments performed at variable pH shows that at pH 426
3, the leachate δ7Li remains lower than the fresh glass value for a longer time (up to 34 days). 427
In contrast, at high pH, δ7Li rapidly reaches the fresh basaltic glass value (after a few hours) 428
and then remains constant, within uncertainties (Fig. 4b). 429
Wimpenny et al. (2010) performed experimental leaching of a natural basaltic glass at 430
far-from-equilibrium conditions in mixed through-flow reactors (open system). The δ7Li 431
values of the leachates in their experiments are also generally slightly lower than the mean 432
δ7
Li value of the pristine basaltic glass. Si/Li of the solutions, when analyzed, are also lower 433
than the mean basaltic glass value, at temperatures ranging between 25 and 45°C (the 434
temperature was varied during the experiment), suggesting a role of diffusion on the release 435
of Li into solution at these conditions. 436
4. DISCUSSION
438 439
4.1. A coupled diffusion-dissolution model
440 441
The low δ7Li values relative to the fresh basaltic glass measured in the solutions 442
collected in the early stages of alteration strongly suggest that diffusion affects the Li isotope 443
signature of these solutions. Indeed, diffusion is expected to result in light isotope (6Li) 444
enrichment in the solution relative to the solid phase. The role of diffusion on the Li isotope 445
signature at the beginning of the experiments is also supported by the fact that the lowest δ7Li 446
values also correspond to the lowest Si/Li (Table 4, section 3.4). 447
In order to quantify diffusion coefficients for 6Li and 7Li, we have developed a model 448
that takes into account both processes: release of Li by diffusion and release of Li by 449
dissolution of the glass network (Fig. 5). During alteration, glass network modifier cations, 450
such as alkali metals (Na+, Li+), are replaced by hydrogen species (H3O+, H2O) present in
451
solution. This leads to a selective leaching of these metals, and to the formation of a "leached 452
layer" at the glass surface (Rana and Douglas, 1961a,b; Hamilton et al., 2000; White and 453
Claasen, 1980; Luo and Ebert, 1998). This diffusion process can lead to kinetic isotopic 454
fractionation as the diffusivity of an isotope is a function of its mass (Eq. (5)): light isotopes 455
diffuse more rapidly than heavy ones. It has been shown that Li isotope fractionation can 456
occur during diffusion through silicate melts (Richter et al., 2003; Lundstrom et al., 2005), 457
and in water (Richter et al., 2006). The ratio of 6Li and 7Li diffusion coefficients (a) is 458 expressed as: 459 460 β ⎟ ⎟ ⎠ ⎞ ⎜ ⎜ ⎝ ⎛ = = Li Li Li Li m m D D a 7 6 6 7 (6) 461
462
The value of the exponent ' β ' is not equal to 0.5, as it would be for a theoretical ideal gas. 463
The value of a (or in other words the β value) must be determined experimentally. 464
The model for determining the a coefficients must take into account not only diffusion 465
but also dissolution of the hydrated layer. Dissolution occurs either by hydrolysis of ionic– 466
covalent bonds (Si–O–Si, Si–O–Al) (Bunker, 1994) and/or by metal (Al, Si)-proton exchange 467
reactions (Oelkers, 2001; Oelkers and Gislason, 2001; Gislason and Oelkers, 2003). The 468
dissolution process itself does not lead to isotope fractionation, because all of the network 469
bonds are broken (as supported by the congruent behaviour of elements such as Si, Al, Ca and 470
Mg (section 3.2)). Consequently, all the Li present in the leached layer is assumed to be 471
released into solution. Thus, while diffusion results in low δ7
Li in solution (relative to the 472
basaltic glass value), dissolution of the hydrated layer - which is enriched in 7Li due to 473
diffusion - tends to increase the δ7Li value of the solution. Since all of our experiments are 474
performed in closed systems, the maximum δ7Li value for the solution is the fresh basaltic 475
glass δ7
Li value (+10.3 ± 0.4 ‰) (unless secondary phases are formed). 476
The diffusion coefficient deduced from Eq. (4) is only apparent because Li is also 477
released by dissolution of the hydrated glass. Dissolution of the glass surface displaces the 478
surface towards the interior of the glass at a rate r (Boksay et al., 1968). The coordinate x 479
becomes x = y - rt with C = 0 at x = 0, x moving at a rate r, and y corresponding to EHG, the
480
equivalent hydrated glass thickness over which diffusion occurs (Eq. (5)). By differentiation, 481 x = y – rt becomes: 482 483 r t y t x − ⎟ ⎠ ⎞ ⎜ ⎝ ⎛ ∂ ∂ = ⎟ ⎠ ⎞ ⎜ ⎝ ⎛ ∂ ∂ (7) 484 485
Eq. (4) can be expressed as:
486 487 ⎟⎟⎠ ⎞ ⎜⎜⎝ ⎛ ∂ ∂ = ⎟ ⎠ ⎞ ⎜ ⎝ ⎛ ∂ ∂ ⎟ ⎠ ⎞ ⎜ ⎝ ⎛ ∂ ∂ = ⎟ ⎠ ⎞ ⎜ ⎝ ⎛ ∂ ∂ 2 2 x C D t x x C t C (8) 488 489 It is considered that: 490 491 ⎟⎟⎠ ⎞ ⎜⎜⎝ ⎛ ∂ ∂ = ⎟ ⎠ ⎞ ⎜ ⎝ ⎛ ∂ ∂ y C x C (9) 492 493
By combining Eq. (7), (8) and (9), Eq. (4) becomes: 494 495 ⎟⎟⎠ ⎞ ⎜⎜⎝ ⎛ ∂ ∂ = ⎟ ⎠ ⎞ ⎜ ⎝ ⎛ − ∂ ∂ ⎟⎟⎠ ⎞ ⎜⎜⎝ ⎛ ∂ ∂ 2 2 y C D r t y y C (10) 496 497 and: 498 499 ⎟⎟⎠ ⎞ ⎜⎜⎝ ⎛ ∂ ∂ + ⎟⎟⎠ ⎞ ⎜⎜⎝ ⎛ ∂ ∂ = ⎟ ⎠ ⎞ ⎜ ⎝ ⎛ ∂ ∂ y C r y C D t C 2 2 (11) 500 501
Following the resolution of this equation by Boksay et al. (1968), the solution of Eq. (11) for 502 lithium is: 503 504
( )
(
)
( )
2 exp 5 . 0 1 s t D c s erf r c dt dQLi Li − ⋅ ⋅ ⋅ + ⋅ − ⋅ ⋅ = π (12) 505 506where dQLi/dt is the release rate of Li into solution (in g m-2 d-1), r the glass dissolution rate
507
(in m d-1), c the Li concentration in the bulk glass (in g m-3), DLi the Li diffusion coefficient
508
(in m2 d-1). s is dimensionless and is expressed as: 509 510 t D t r y s ⋅ ⋅ ⋅ − = 4 (13) 511 512
Eq. (12) can be numerically integrated in order to determine QLi. All the parameters
513
are known except DLi which can be adjusted in order to best fit the data set (by the least
514
squares method). The total altered glass thickness (y or EHG) is deduced from Eq. (5). The
515
dissolution rate (r) is determined for each experiment from NL(Si) (Table 5): 516 517 ⎟ ⎠ ⎞ ⎜ ⎝ ⎛− ⋅ = = τ t r dt Si dNL r ( ) 0 exp (14) 518 519
with τ a characteristic time of decrease. 520 521 Therefore: 522 523 ⎟ ⎠ ⎞ ⎜ ⎝ ⎛ ⎟ ⎠ ⎞ ⎜ ⎝ ⎛− − ⋅ ⋅ = τ τ t r Si NL( ) 0 1 exp (15) 524 525
Note that only the onset of the experiments is considered here (see Table 6). All the calculated 526
Li diffusion coefficients are detailed in Table 6. 527
Eq. (12) and its numerical integration can also be used to calculate the Li isotopic 528
composition of the solution. The second step of the modelling consists therefore of fitting the 529
solution δ7Li values (as a function of time) and determining the best value for a (Eq. (6)). This 530
was performed using a least squares method (Fig. 6). The range of uncertainties obtained for 531
the a coefficients was determined so as to cover the whole range of δ7Li values. 532
The best fit for the experiment at 50°C corresponds to a a value of 0.991 ± 0.003 (Fig. 533
6a). At 90°C and pH 3, a is 0.994 ± 0.004 (Fig. 6b). For the experiments at various S/V, the a 534
values are 1.000 ± 0.002 and 0.997 ± 0.002 (Fig. 6c) for S/V = 0.7 and 7 cm-1, respectively. 535
The best fit for the experiment at 90°C is a = 0.990 considering all the data, and a = 0.997 ± 536
0.003 without considering the first point (Fig. 6a), which has a much lower pH (as shown in 537 Table 4). 538 539 4.2. Influence of temperature 540 541
It is difficult to assess the role of temperature based on this study alone, since only two 542
temperatures were tested, and since the value obtained for a at 90°C in pure water is 543
associated with a large uncertainty (0.9935±0.005). The δ7Li values of the leachates in the 544
experiment performed at 50°C are lower than in the experiment at 90°C (Fig. 4a). This could 545
be explained by a greater relative contribution of Li from diffusion at 50°C, as highlighted by 546
the particularly low Si/Li in solution (see section 3.4.). In fact, the solution δ7Li depends on 547
the a coefficient (responsible for Li isotope fractionation during diffusion), but also on the 548
relative rate of diffusion and dissolution (see section 4.4). As shown in Fig. 7a, for a given a 549
value of a, various glass dissolution rates can lead to a wide range of δ7Li values. 550
In order to better determine the role of temperature on the a coefficients, we have 551
compiled data available from the literature (Fig. 8). The published data mainly correspond to 552
high-temperature fractionation among silicate minerals, determined experimentally or by field 553
studies. Richter et al. (2003) performed experiments of Li diffusion between rhyolite and 554
basalt at 1350-1450°C and determined a value for the a coefficient of 0.9674. Teng et al. 555
(2006) studied amphibolites and schists of the Tin Mountain pegmatite and determined a = 556
0.982 and 0.977 for temperatures ranging between 340 and 600°C. Parkinson et al. (2007) 557
modelled profiles of Li concentrations and isotope compositions measured in situ in zoned 558
clinopyroxene and olivine phenocrysts from primitive arc lavas of the New Georgia Group 559
(Solomon Islands) and estimated a values between 0.971 and 0.959 (1050-1100°C). 560
Combining our data with the published values for a as a function of temperature, a 561
relatively good correlation is obtained for diffusion in molten solids (R²=0.95) (Fig. 8) over a 562
large range of temperatures (50-1450°C). A single law can be determined from these data: 563 564 041 . 0 1000 092 . 0 ) ln( = ⋅ − RT a (16) 565 566
T is the temperature in K and R the ideal gas constant (in J mol-1 K-1). 567
Experiments carried out by Richter et al. (2006) at 75°C (a = 0.9977) and Kunze and 568
Fuoss (1962) at 25°C (a = 0.9965) also plot on the same trend, although diffusion of lithium 569
occurs in water in both studies (Fig. 8, in grey). The results of Fritz (1992) (reported in 570
Richter et al., 2006) were not used in our compilation as Richter et al. (2006) mentioned that 571
the experimental design uses a dialysis membrane which might induce isotopic fractionation. 572
We suggest that the correlation between temperature and a coefficients is due to a 573
difference in the activation energies (Ea) for 6Li+ and 7Li+ diffusivity (corresponding to an 574
exchange between Li+ and H+ for example). The dependency of the diffusion coefficient on 575
temperature would therefore follow an Arrhenius law (McGrail et al., 1984, Chave et al., 576
2007; Verney-Carron et al., 2010), such that: 577
(
)
(
Ea RT)
a(
(
Ea Ea)
RT)
D RT Ea D D D a exp / / exp / exp 7 6 0 6 06 7 07 6 7 = ⋅ − − ⋅ − ⋅ = = (17) 579 580The linear regression of the data (Eq. (16)) shows that the difference between 581
activation energies for 6Li and 7Li diffusivity (Ea6 - Ea7) is 0.10 ± 0.02 kJ/mol. Although this
582
difference is small, it leads to significant isotope fractionation during diffusion. 583
Overall, the positive correlation highlighted between temperature and a shows that 584
isotopic fractionation caused by diffusion will increase with temperature. 585
586
4.3. Influence of other parameters
587 588
The a values are relatively similar at pH 3-4 (0.994 ± 0.004, experiment PH3-90) and 589
at pH 8-9 (0.997 ± 0.002, experiment PH10-90) (Table 6). Therefore, based on our data, pH 590
has no obvious effect on diffusion induced Li isotope fractionation. In contrast, the rate of Li 591
diffusion and the rate of glass dissolution are expected to vary with pH. Basaltic glass 592
dissolution rates increase as pH decreases, but are also elevated toward alkaline pH. The 593
evolution of the dissolution rate as a function of pH displays a U-shape with a minimum at 594
around pH 4-6 (Guy and Schott, 1989; Gislason and Oelkers, 2003). Guy and Schott (1989) 595
have shown that in the acidic pH region, dissolution is promoted by adsorption of H+ on Al 596
and Fe surface sites, whereas in the alkaline pH region, dissolution is promoted by the 597
adsorption of OH- on Si sites. According to Guy and Schott, (1989), the dissolution rate at 598
100°C is 1.6 × 10⁻⁷ molSi/m²/s at pH 3, and 9.8 × 10⁻⁷ molSi/m²/s at pH 8.6 whereas Gislason 599
and Oelkers (2003) measured different values at 100°C: 2.5 × 10⁻⁸ molSi/m²/s at pH 3, and 5.2 600
× 10-8 molSi/m²/s at pH 8.6. However, both studies show that the dissolution rate is lower at 601
pH 3 than at pH 8.6, in agreement with our data (see r0 in Table 6).
In contrast to silicate dissolution rates, the Li diffusion coefficient is expected to 603
increase as pH decreases (White and Claasen, 1980; Bunker, 1994; Chave et al., 2007; 604
Verney-Carron et al., 2010), because ion exchange (assumed to be responsible for the 605
diffusion of alkalis during alteration) depends on the H+ concentration in solution. However, 606
in the experiments performed at pH 3, the estimated Li diffusion is surprisingly low. 607
The S/V ratio appears to have an effect on the a ratio (Fig. 6c), since SV1 and SV2 608
experiments lead to contrasting a values (1 and 0.997, respectively). However, these 609
experiments were longer than the low S/V experiments and may be affected by secondary 610
phase formation. For both SV1 and SV2 experiments, saturation (Si ~ 15 mg/L) was reached 611
quickly, after 20 days. Nevertheless, in order to obtain the same Si concentration in solution, 612
10 times more glass had to be altered in the experiment with S/V = 0.7 cm-1 (SV1) compared 613
with SV2 which contained 10 times less glass in the beaker. This suggests that more 614
secondary minerals, potentially incorporating Li, could have precipitated during experiment 615
SV1. Since at 90°C the isotope fractionation using Li incorporation into clays can be 616
significant (e.g. -10‰ for smectites, Vigier et al., 2008), this effect could also explain the 617
higher δ7Li in the leachates of experiment SV1. 618
In summary, we show that the a parameter for Li isotope fractionation during diffusion 619
seems to be primarily influenced by temperature. Also, we show that, at a given temperature, 620
the relative diffusion and dissolution contributions can significantly affect the Li isotope 621
composition of the solution. 622
623
4.4. Implications for natural systems
624 625
The results of this study have shown that weathering of basaltic glass cannot lead to an 626
enrichment in 7Li of the solution, which suggests that high δ7Li values in river waters draining 627
basalts must be due to the preferential uptake of 6Li by secondary phases. 628
The data also reveal the importance of diffusion-driven Li isotope fractionation under 629
conditions that inhibit secondary phase precipitation. The temperature dependency of this 630
isotope fractionation (a ratio) (Fig. 8) indicates a greater potential effect at high temperatures, 631
such as those that have been measured in hydrothermal fluids (a ranges between 0.985 and 632
0.979 for 150-350°C). However, this effect is not directly demonstrated by δ7Li measured in 633
hydrothermal fluids, which are systematically higher than δ7Li determined for fresh MORB 634
(the average δ7Li for hydrothermal fluids is ~ +8.1 ± 1.8 ‰, Chan and Edmond, 1988; Chan 635
et al., 1993, 1994; Foustoukos et al., 2004; Millot et al., 2010). 636
In fact, the Li isotope compositions of solutions also depend on the relative 637
contribution of diffusion and dissolution. At high temperatures, the release rate of Li from 638
solid phases is high, resulting in the high Li contents of hydrothermal fluids (Seyfried et al., 639
1984; Berger et al., 1988). The initial dissolution rate (r0) and Li diffusion coefficients (D)
640
calculated from the experiments performed at 50 and 90°C (PW-50 and PW-90) can be 641
extrapolated to lower and higher temperatures by using an Arrhenius law. Thus, the activation 642
energies of diffusion and dissolution are found to be 102 and 110 kJ mol-1, respectively. 643
These values are slightly higher than published data for basaltic glass (e.g. Techer et al., 644
2000) and show that the relative contribution of diffusion compared to dissolution decreases 645
as temperature increases. In other words, r0/D increases as a function of temperature. Fig. 7b
646
displays the initial stages of the δ7
Li temporal evolution in solution at various temperatures 647
(from 50 to 120°C) (following the model developed in section 4.1) At temperatures higher 648
than 120°C, the contribution of dissolution is high and masks the effect of isotope 649
fractionation occurring during diffusion of Li through the leached layer. The model also 650
predicts that at temperatures between 50 and 90°C, the role of diffusion dominates over 651
dissolution, resulting in solution δ7Li which are lower than the fresh glass value. At lower 652
temperatures (< 50°C), the solution δ7Li goes back towards the fresh basaltic glass value, 653
since the isotope fractionation occurring during diffusion becomes negligible (a close to 1). 654
Overall, these simulations highlight that the solution δ7Li, in absence of secondary mineral 655
formation, strongly depends on temperature since this parameter influences the dissolution 656
rate, the diffusion coefficients, and the Li isotope fractionation factor. Also, the S/V ratio 657
which can be related to parameters such as water/rock ratio, porosity and specific surface area 658
plays a key role, as it can drastically change the relative contribution of diffusion and 659
dissolution. In the field, these parameters should therefore influence the Li isotope 660
composition of the fluids before formation of any secondary minerals starts. In models, the 661
initial composition of the fluid may therefore not be strictly equal to the isotope composition 662
of the fresh rock or minerals that it drains. 663
In summary, diffusion should not play a significant role in low-temperature natural 664
systems as the isotope fractionation factor is close to 1. In high temperature hydrothermal 665
systems, the dissolution rates are significant and may entirely mask the effect of diffusion. 666
However, the role of diffusion should be taken into account for modelling alteration processes 667
occurring at moderate temperatures. 668
669
5. SUMMARY AND CONCLUSIONS
670 671
The results of basaltic glass alteration experiments performed at various temperatures 672
(50 and 90°C), various pH (3 and around 9) and various S/V ratio (0.7 and 7 cm-1) have 673
shown that the alteration of basaltic glass at far from equilibrium conditions produces a 674
solution with a lighter Li isotopic composition than the starting material. This challenges the 675
idea that the weathering of silicate glasses could preferentially release 7Li into rivers. The Li 676
isotopic composition of the solution can be modeled in terms of mass-dependent isotope 677
fractionation of Li, as Li diffuses through the hydrated glass into solution. This fractionation 678
can be explained by a difference in the diffusion coefficients of 6Li and 7Li. The ratio a, 679
defined as the ratio of these diffusion coefficients (a = D7/D6), decreases as a function of
680
temperature. The relationship between a and temperature appears to follow an Arrhenius' law, 681
and may be related to a difference in the activation energies of the 6Li+ and 7Li+ diffusivity. 682
These results can help to interpret the Li isotope signatures of natural systems. Without 683
considering the role of secondary mineral formation it seems that the effect of diffusion on the 684
Li isotopic composition is not negligible for systems where water rock interactions occur at 685
moderate temperatures (50-100°C). 686
ACKNOWLEDGEMENTS
688 689
We would like to thank S. Gin and P. Jollivet (CEA, LCLT) for supplying the synthetic 690
basaltic glass. We also thank D. Yechigeyan, J. and L. Marin (SARM) for chemical 691
analyses. We are grateful to M. Champenois, D. Mangin and C. Rollion-Bard (CRPG) for 692
their technical help with the SIMS. We also would like to acknowledge S. Alfaro (LISA) 693
for his help with the model and P. Burnard (CRPG) for English corrections. J.C. Alt, R.H. 694
James and an anonymous reviewer are sincerely thanked for their comments that help to 695
improve this manuscript. This is CRPG contribution # 2113. 696
REFERENCES
697 698
Aagard P. and Helgeson H.C. (1982) Thermodynamic and kinetic constraints on reaction rates 699
among minerals and aqueous solutions. I. Theoretical considerations. Am. J. Sci. 282, 237-700
285. 701
Berger G., Schott J. and Guy C. (1988). Behavior of Li, Rb and Cs during basalt glass and 702
olivine dissolution and chlorite, smectite and zeolite precipitation from seawater: 703
Experimental investigations and modelization between 50° and 300°C. Chem. Geol. 71, 704
297-312. 705
Berger G., Claparols C., Guy C. and Daux V. (1994) Dissolution rate of a basalt glass in silica-706
rich solutions: Implications for long-term alteration. Geochim. Cosmochim. Acta 58, 4875-707
4886. 708
Boksay Z., Bouquet G. and Dobos S. (1968) The kinetics of leached layers on glass surfaces. 709
Phys. Chem. Glasses 9, 69-71. 710
Bunker B.C. (1994) Molecular mechanisms for corrosion of silica and silicate glasses. J. Non-711
Cryst. Solids 179, 300-308. 712
Carignan J., Vigier N. and Millot R. (2007) Three secondary reference materials for Li 713
isotope measurements: Li7-N, Li6-N and LiCl-N solutions. Geostand. Geoanal. Res. 31, 714
7-12. 715
Chan L.H. and Edmond J.M. (1988) Variation of lithium isotope composition in the marine 716
environment: a preliminary report. Geochim. Cosmochim. Acta 52, 1711-1717. 717
Chan L.H., Edmond J.M., Thompson G. and Gillis K. (1992) Lithium isotopic composition of 718
submarine basalts: implications for the lithium cycle to the ocean. Earth Planet. Sci. Lett., 719
108, 151-160. 720
Chan L.H., Edmond J.M. and Thompson G. (1993) A lithium isotope study of hot springs and 721
metabasalts from mid ocean ridge hydrothermal systems. J. Geophys. Res. 98, 9653-9659. 722
Chan L.H., Gieskes J.M., You C.F. and Edmond J.M. (1994) Lithium isotope geochemistry of 723
sediments and hydrothermal fluids of the Gaymas Basin, Gulf of California. Geochim. 724
Cosmochim. Acta 58, 4443-4454. 725
Chan L.H., Alt J.C. and Teagle D.A.H. (2002) Lithium and lithium isotope profiles through 726
the upper oceanic crust: a study of seawater-basalt exchange at ODP Sites 504B and 727
896A. Earth Planet. Sci. Lett. 201, 187-201. 728
Chaussidon M. and Robert F. (1998) 7Li/6Li and 11B/10B variations in chondrules from the 729
Semarkona unequilibrated chondrite. Earth Planet. Sci. Lett. 164, 577-589. 730
Chave T., Frugier P., Ayral A. and Gin S. (2007) Solid state diffusion during nuclear glass 731
residual alteration in solution. J. Nucl. Mater. 362, 466-473. 732
Crovisier J.L., Advocat T. and Dussossoy J.L. (2003) Nature and role of natural alteration gels 733
formed on the surface of ancient volcanic glasses (Natural analogs of waste containment 734
glasses). J. Nucl. Mater. 321, 91-109. 735
Daux V., Guy C., Advocat T., Crovisier J.L. and Stille P. (1997) Kinetic aspects of basaltic 736
glass dissolution at 90°C: role of aqueous silicon and aluminium. Chem. Geol. 142, 737
109-126. 738
Dessert C., Dupré B., Gaillardet J., François L. and Allègre C.J. (2003) Basalt weathering 739
laws and the impact of basalt weathering on the global carbon cycle. Chem. Geol. 202, 740
257-273. 741
Dupré B., Dessert C., Oliva P., Goddéris Y., Viers J., François L., Millot R. and Gaillardet J. 742
(2003) Rivers, chemical weathering and Earth's climate. C.R. Geoscience 335, 1141-1160. 743
Flesch G.D., Anderson A.R. and Svec H.J. (1973) A secondary isotopic standard for 6Li/7Li 744
determinations. Int. J. Mass Spectrom. Ion Phys. 12, 265-272. 745
Franck S., Bounama C. and von Bloh W. (2008) Weathering. In Encyclopedia of Ecology, 746
3770-3776. 747
Frugier P., Gin S., Minet Y., Chave T., Bonin B., Godon N., Lartigue J.E., Jollivet P., Ayral A., 748
De Windt L. and Santarini G. (2008) SON68 nuclear glass dissolution kinetics: Current 749
state of knowledge and basis of the new GRAAL model. J. Nucl. Mater. 380, 8-21. 750
Frugier P., Chave T., Lartigue J.E. and Gin S. (2009) Application of the GRAAL model to 751
leaching experiments with SON68 nuclear glass in initially pure water. J. Nucl. Mater. 392, 752
552-567. 753
Gaillardet J., Dupré B., Louvat P. and Allègre C.J. (1999) Global silicate weathering and CO2
754
consumption rates deduced from the chemistry of large rivers. Chem. Geol. 159, 3-30. 755
Gislason S.R. and Oelkers E.H. (2003) Mechanism, rates, and consequences of basaltic glass 756
dissolution: II. An experimental study of the dissolution rates of basaltic glass as a 757
function of pH and temperature. Geochim. Cosmochim. Acta 67, 3817-3832. 758
Grambow B. (1985) A general rate equation for nuclear waste glass corrosion. Mat. Res. Soc. 759
Symp. Proc. 44, 15-27. 760
Guy C. and Schott J. (1989) Multisite surface reaction versus transport control during the 761
hydrolysis of a complex oxide. Chem. Geol. 78, 181-204. 762
Hamilton J.P., Pantano C.G. and Brantley S.L. (2000) Dissolution of albite glass and crystal. 763
Geochim. Cosmochim. Acta 64, 2603-2615. 764
Hartmann J., Jansen N., Dürr H.H., Kempe S. and Köhler P. (2009) Global CO2-consumption
765
by chemical weathering: What is the contribution of highly active weathering regions? 766
Global Planet. Change 69, 185-194. 767
Hoefs J. and Sywall M. (1997) Lithium isotopic composition of Quaternary and Tertiary 768
biogene carbonates and a global lithium isotope balance. Geochim. Cosmochim. Acta 61, 769
2679-2690. 770
Huh Y., Chan L.C., Zhang L. and Edmond J.M. (1998) Lithium and its isotopes in major 771
world rivers: implications for weathering and the oceanic budget. Geochim. Cosmochim. 772
Acta 62, 2039-2051. 773
Huh Y., Chan L.C. and Edmond J.M. (2001) Lithium isotopes as a probe of weathering 774
processes: Orinoco River. Earth Planet. Sci. Lett. 194, 189-199. 775
Huh Y., Chan L.C. and Chadwick O.A. (2004) Behavior of lithium and its isotopes during 776
weathering of Hawaiian basalt. Geochem. Geophys. Geosyst. 5, 1-22. 777
James R.H., Allen D.E. and Seyfried, W.E. Jr. (2003) An experimental study of alteration of 778
oceanic crust and terrigenous sediments at moderate temperatures (51 to 350°C): Insights 779
as to chemical processes in ear-shore ridge-flank hydrothermal systems. Geochim. 780
Cosmochim. Acta 67, 681-691. 781
Kisakürek B., Widdowson M. and James R.H. (2004) Behaviour of Li isotopes during 782
continental weathering: the Bidar laterite profile, India. Chem. Geol. 212, 27-44. 783
Kisakürek B., James R.H. and Harris N.B.W. (2005) Li and δ7Li in Himalayan rivers: Proxies 784
for silicate weathering? Earth Planet. Sci. Lett. 237, 387-401. 785
Kunze R.W. and Fuoss R.M. (1962) Conductance of the alkali halides. III. The isotopic 786
lithium chlorides. J. Phys. Chem. 66, 930-931. 787
Lemarchand E., Chabaud F., Vigier N., Millot R. and Pierret M.C. (2010) Lithium isotope 788
systematics in a forested granitic catchment (Strengbach, Vosges Mountains, France). 789
Geochim. Cosmochim. Acta, in press. 790
Lerman A., Wu L. and Mackenzie F.T. (2007) CO2 and H2SO4 consumption in weathering
791
and material transport to the ocean, and their role in the global carbon balance. Marine 792
Chem. 106, 326-350. 793