HAL Id: cea-01270929
https://hal-cea.archives-ouvertes.fr/cea-01270929
Submitted on 8 Feb 2016
HAL is a multi-disciplinary open access
archive for the deposit and dissemination of
sci-entific research documents, whether they are
pub-lished or not. The documents may come from
teaching and research institutions in France or
abroad, or from public or private research centers.
L’archive ouverte pluridisciplinaire HAL, est
destinée au dépôt et à la diffusion de documents
scientifiques de niveau recherche, publiés ou non,
émanant des établissements d’enseignement et de
recherche français ou étrangers, des laboratoires
publics ou privés.
Discovery of large-scale diffuse radio emission and of a
new galaxy cluster in the surroundings of
MACS J0520.7-1328
G. Macario, H. T. Intema, C. Ferrari, H. Bourdin, S. Giacintucci, T. Venturi,
P. Mazzotta, I. Bartalucci, M. Johnston-Hollitt, R. Cassano, et al.
To cite this version:
G. Macario, H. T. Intema, C. Ferrari, H. Bourdin, S. Giacintucci, et al.. Discovery of large-scale diffuse
radio emission and of a new galaxy cluster in the surroundings of MACS J0520.7-1328. Astronomy
and Astrophysics - A&A, EDP Sciences, 2014, 565, pp.A13. �10.1051/0004-6361/201323275�.
�cea-01270929�
DOI:10.1051/0004-6361/201323275 c
ESO 2014
Astrophysics
&
Discovery of large-scale diffuse radio emission and of a new
galaxy cluster in the surroundings of MACS J0520.7-1328
G. Macario
1, H. T. Intema
2,3, C. Ferrari
1, H. Bourdin
4, S. Giacintucci
5,6, T. Venturi
7, P. Mazzotta
4, I. Bartalucci
4,
M. Johnston-Hollitt
9, R. Cassano
7, D. Dallacasa
7,8, G. W. Pratt
10, R. Kale
7,8, and S. Brown
111 Laboratoire Lagrange, UMR 7293, Université de Nice Sophia-Antipolis, CNRS, Observatoire de la Côte d’Azur, 06300 Nice,
France
e-mail: [email protected]
2 Jansky Fellow of the National Radio Astronomy Observatory, 520 Edgemont Road, Charlottesville, VA 22903-2475, USA 3 National Radio Astronomy Observatory, PO Box O, 1003 Lopezville Road, Socorro, NM 87801-0387, USA
4 Dipartimento di Fisica, Università degli Studi di Roma “Tor Vergata”, via della Ricerca Scientifica 1, 00133 Roma, Italy 5 Department of Astronomy, University of Maryland, College Park, MD 20742, USA
6 Joint Space-Science Institute, University of Maryland, College Park, MD 20742-2421, USA 7 INAF-Istituto di Radioastronomia, via Gobetti 101, 40129 Bologna, Italy
8 Dipartimento di Fisica e Astronomia, via Ranzani 1, 40127 Bologna, Italy
9 School of Chemical & Physical Sciences, Victoria University of Wellington, PO Box 600, 6140 Wellington, New Zealand 10 Laboratoire AIM, IRFU/Service d’Astrophysique CEA/DSM CNRS Université Paris Diderot, Bt. 709, CEA-Saclay,
91191 Gif-sur-Yvette Cedex, France
11 Department of Physics and Astronomy, University of Iowa, 203 Van Allen Hall, Iowa City, IA 52242, USA
Received 17 December 2013/ Accepted 17 February 2014
ABSTRACT
We report the discovery of large-scale diffuse radio emission south-east of the galaxy cluster MACS J0520.7-1328, detected through high-sensitivity Giant Metrewave Radio Telescope 323 MHz observations. This emission is dominated by an elongated diffuse radio source and surrounded by other features of lower surface brightness. Patches of these faint sources are marginally detected in a 1.4 GHz image obtained through a re-analysis of archival NVSS data. Interestingly, the elongated radio source coincides with a previously unclassified extended X-ray source. We perform a multi-wavelength analysis based on archival infrared, optical, and X-ray Chandra data. We find that this source is a low-temperature (∼3.6 keV) cluster of galaxies, with indications of a disturbed dynamical state, located at a redshift that is consistent with the one of the main galaxy cluster MACS J0520.7-132 (z = 0.336). We suggest that the diffuse radio emission is associated to non-thermal components in the intracluster and intergalactic medium in and around the newly detected cluster. We are planning deeper multi-wavelength and multi-frequency radio observations to accurately investigate the dynamical scenario of the two clusters and to address the nature of the complex radio emission more precisely.
Key words.galaxies: clusters: individual: MACS J0520.7-1328 – galaxies: clusters: individual: 1WGA J0521.0-1333 – radio continuum: galaxies – X-rays: galaxies: clusters
1. Introduction
In the currently supported hierarchical scenario of structure for-mation, galaxy clusters assemble and evolve through mergers and accretion of smaller units of matter at the intersection of cosmic filaments connecting clusters into the large-scale struc-ture of the Universe.
In addition to the most common methods for clusters de-tections – based on the study of galaxy over-densities, lensing, extended X-ray emission due to thermal bremsstrahlung from the intracluster medium (ICM), and the sub-mm signal due to inverse Compton scattering of cosmic microwave background photons by hot intracluster electrons (SZ effect) – observations in the radio band can also probe for the existence of clusters and/or large-scale structures. Powerful high-redshift radio galax-ies are known to be efficient tools for detecting galaxy clusters at high redshifts (z > 1.5; e.g. Galametz et al. 2013, and ref-erence therein). At lower redshift, tailed radio galaxies are be-ing extensively and successfully used for cluster searches. Since they are known to be associated with galaxy clusters, they can be used to trace the high-density environments in the Universe
(e.g. Giacintucci & Venturi 2009). Several previously unob-served clusters have been actually identified thanks to the de-tection of tailed sources (e.g.Blanton et al. 2003;Smolˇci´c et al. 2007;Giacintucci & Venturi 2009;Kantharia et al. 2009;Mao et al. 2010).
Beyond tailed radio galaxies, it is nowadays known that a fraction of merging clusters host diffuse Mpc-scale radio emis-sion (such as radio haloes and relics that are named according with their location and observational properties; e.g. seeFerrari et al. 2008). This synchrotron emission is unrelated to individ-ual cluster radio galaxies and directly probes for non-thermal components (relativistic particles and magnetic fields) mixed with the thermal ICM. To date, all these sources are found to be associated with dynamically disturbed/merging systems (e.g.
Cassano et al. 2010b,2013;Feretti et al. 2012, for a recent re-view). The detection of such sources can become – in principle – a powerful tool for tracing previously unidentified clusters.
Upcoming deep and wide-field radio surveys with new ra-dio interferometers like Low Frequency Array (LOFAR; e.g.
van Haarlem et al. 2013), Australian Square Kilometer Array
A&A 565, A13 (2014) Pathfinder (ASKAP; e.g.Johnston et al. 2008), MeerKAT (e.g.
Booth & Jonas 2012), and Murchison Widefield Array (MWA; e.g.Tingay et al. 2013) will allow systematic searches for new galaxy clusters based on the detection of tailed radio galaxies and diffuse extended emission (see e.g. Enßlin & Röttgering 2002; Cassano et al. 2010a). For these studies, LOFAR and MWA are particularly suitable, thanks to the very large field of view covered at low radio frequencies that makes them pow-erful survey telescopes (see e.g. the ongoing all-sky surveys
LOFAR MSSS,Heald 2013, and MWA GLEAM, Wayth et al.,
in prep.).
In this paper we present an example of a new cluster detec-tion made possible thanks to deep low-frequency radio obser-vations. We report the serendipitous discovery with the Giant Metrewave Radio Telescope (GMRT) at 323 MHz of new large-scale diffuse radio emission in the proximity of the cluster MACS J0520.7-1328 (M 0520 hereinafter).
M 0520 is one of the X-ray brightest clusters of galaxies from the MAssive Cluster Survey (MACS,Ebeling et al. 2010).
It is located at z = 0.336 and has an X-ray luminosity of
Lr500,[0.1−2.4 keV]= 7.8 × 1044erg/s (Mantz et al. 2010)1. M0520
is classified as a relatively relaxed system on the basis of its morphological properties, i.e. a good alignment between the galaxy and ICM distributions, and quite concentric X-ray sur-face brightness contours in its central 1.5 Mpc region (morphol-ogy code 2 inEbeling et al. 2010). This cluster is also found to be a lensing system, though no mass estimate has been derived from lensing studies (Horesh et al. 2010). M 0520 is identified in the Planck SZ cluster catalogue as PSZ1 G215.29-26.09, with a mass estimated from the SZ of M500 ∼ 6.15 × 10¹⁴ M (Planck
Collaboration XXIX 2014).
For our analysis, we made use of our new GMRT radio ob-servations and of multi–wavelength data available from archives and the literature. The paper is presented as follows. In Sect. 2 we describe the new GMRT observations and data reduction, along with the analysis of the detected emission; in Sect. 3, archival Chandra X-ray data analysis of the cluster is presented; in Sect. 4, we report optical/IR analysis based on available pub-lic catalogues. A multi–wavelength comparison is reported in Sect. 5, and the results are discussed in Sect. 6.
The adopted cosmology is ΛCDM, with H0 =
71 km s−1Mpc−1, Ωm = 0.27, ΩΛ = 0.73. At the redshift
of the cluster, 10corresponds to ∼290 kpc.
2. Radio analysis
2.1. Observations and data reduction
M0520 was observed with the GMRT at 323 MHz in November 2011, as part of an ongoing large observational programme (∼350 h of total observing time) named the MACS-Planck Radio Halo Cluster Project. The project is devoted to searching for diffuse radio emission in a sample of galaxy clusters selected
from the MACS (X-ray) and the XMM-Planck (X-ray/SZ)
cat-alogues in the redshift range 0.3-0.45, which is relatively unex-plored in terms of deep radio observations. For this project, we recently completed a deep pointed survey carried out mainly at low-frequency (25 targets with the GMRT at 323 MHz, 7 with the Australia Telescope Compact Array – ATCA at 2.1 GHz), optimised for detecting of diffuse faint cluster radio emission. Results will be presented in a forthcoming paper (Macario et al., in prep.).
1 Corrected for our slightly different choice of cosmological
parameters.
Data were recorded every 16.1 seconds, with 256 fquency channels covering 32 MHz of bandwidth. Data were re-duced using the NRAO Astronomical Image Processing System2 (AIPS) package and Source Peeling and Atmospheric Modelling (SPAM) software (Intema et al. 2009). After data editing, the re-maining effective bandwidth is 31.2 MHz, centred at 323 MHz. The total effective time on source is around five hours. The flux scale and the bandpass shape were determined from ∼25 min observation of 3C 147 at the end of observations, adopting a flux density of 52.2 Jy at 323 MHz (following the Perley-Taylor 1999 flux scale3). The amplitude calibration was applied to the target field data, followed by additional RFI flagging and frequency averaging to 24 channels of 1.3 MHz each. We phase-calibrated the target field with a simple point source model derived from the NVSS (Condon et al. 1998) and WENSS (Rengelink et al. 1997), followed by several rounds of wifield imaging, CLEAN de-convolution and self-calibration. Only the final self-calibration round included amplitude calibration on a one-minute time scale to correct for antenna gain amplitude variations. Before apply-ing, the gains per antenna were normalized using only the tar-get field scan closest in time to the flux calibrator scan, thereby enforcing the correct flux scale across the whole observation run. SPAM ionospheric calibration and imaging was applied to the data. The average residual amplitude errors are estimated to be.8% (e.g.Chandra et al. 2004). For more details on the data reduction procedure, we refer toMacario et al.(2013).
Once the calibration converged, a set of final images were obtained, starting from the full resolution and then progressively applying various parameters on data weighting to enhance the information on the diffuse emission, sampled by the shortest baselines.
2.2. Detection of diffuse extended radio emission
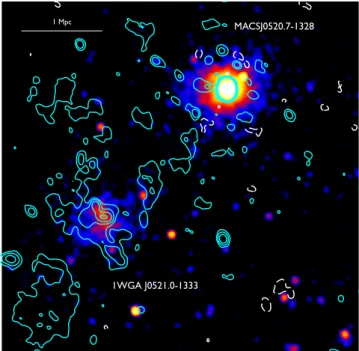
Figure1(left panel) displays contours of the final full–resolution image at 323 MHz (obtained with uniform weighting of the visibilities), corrected for the primary beam. The resolution is 11.800 × 7.800, and the average rms noise level is σ323 MHz =
0.11 mJy beam−1. A 190× 190field is shown, centred about 30
south-east (SE) of the telescope pointing direction (i.e. the centre of the main cluster). The radio map of the central field of M 0520 is totally dominated by a very bright and slightly extended radio source with a flux density of ∼0.5 Jy, associated with the bright-est cluster galaxy (BCG). Residual emission around it is likely due to deconvolution artefacts caused by the relatively strong emission from the BCG, which limits the dynamic range over the central Mpc of the cluster area.
Very interestingly, a diffuse and elongated low surface brightness radio source is located about 80 SE of the cluster
centre. It shows a quite regular, nearly linear shape, and it has an extension over ∼2.80along its major axis. We note that this emission is clearly not due to the artefacts caused by the strong central source, which mostly affect a limited area (radius ∼1.50) around the BCG. A magnification of the diffuse source is shown in the right-hand panel of Fig.1, with the radio contours over-laid on the DSS2 optical red image4. Two radio sources, named S1 and S2, can be distinguished, and are likely associated with optical counterparts. Their flux densities are 6.4 ± 0.5 mJy (for the point-like source S1) and 12.0 ± 1.0 mJy (for the double
2 http://www.aips.nrao.edu
3 http://www.vla.nrao.edu/astro/calib/manual/ 4 The M 0520 field is not covered by the SDSS.
21 53 118 249 507 1027 2057 4108 8247 16433 32734 S1 S2 MACSJ0520.7-1328 S1 S2
Fig. 1.Left panel: 323 MHz GMRT full–resolution (11.800
× 7.800
, p.a. 16.9◦
) image of the 190
× 190
area around the cluster M 0520. Contours are spaced by a factor of two and start at ±3σ= 0.33 mJy/b (negative contours are dashed). The dashed circle indicates the central region of 1 Mpc radius around the cluster M 0520. Right panel: zoom in of the area around the diffuse elongated source; radio contours (same as in left panel) are overlaid on the DSS2 optical red image. The black circles show position of the three galaxies from DSS catalog, which are likely optical counterparts of radio sources S1 and S2.
D1 D2 D3 D4 D1 D2 D3 D4 S1+S2
Fig. 2.Left panel: 323 MHz GMRT low–resolution (21.100
× 17.200
, p.a. 28.8◦
) image of the same 190
× 190
region around the cluster M 0520 (same as in Fig.1); black contours are spaced by a factor of two and start at ±3σ323 MHz= 0.82 mJy/b. (Negative contours are dashed.) To highlight the
position of discrete compact radio sources in the field, contours from the full–resolution image (see Fig.1) are over-plotted in red, starting from ±6σ= 0.66 mJy/b. Dotted ellipses mark the location of diffuse emission, labelled D1 to D4. Right panel: VLA 1.4 GHz contours (in blue) of an image obtained from re-processed NVSS data (45.800
× 29.900
, p.a. −70.0◦
); contours start at ±2σ1400 MHz= 0.5 mJy/b and are spaced by a factor
of 2 (blue dashed contours are negative). The contours are overlaid on a 323 MHz GMRT image of similar resolution (41.500× 33.500
, p.a. 21.3◦
), shown in grey scale. (The grey dashed contour corresponds to 3σ323 MHz= 1.65 mJy/b).
source S2). The diffuse emission, on the other hand, lacks obvi-ous optical counterparts. We note that a bridge of radio emission seems to connect source S1 with the northern part of the diffuse source.
As Fig.1(left panel) shows, peaks of residual emission are spread NW and SE of this elongated source, suggesting the presence of additional underlying extended emission of lower
surface brightness. To highlight this feature, as well as to better image the diffuse elongated source, we produced images at lower resolution by using different weighting schemes and by applying Gaussian tapers to give more weight to the short baselines.
In the left-hand panel of Fig.2we show a low-resolution im-age (grey scale and black contours) of the central area around M0520 (same as in Fig.1, left panel), obtained with robust 0.5
A&A 565, A13 (2014) Table 1. Properties of the diffuse radio emission.
Integrated flux densities [mJy] Angular extent Linear extent∗
P323 MHz∗ (323 MHz) (1400 MHz) (“×”) (kpc × kpc) (W Hz−1) D1 61.2 ± 5.7 9.0 ± 1.6 2.8 × 1.4 800 × 400 2.3 × 1025 D2 32.0 ± 3.6 7.2 ± 1.6 1.8 × 1.3 520 × 370 1.2 × 1025 D3 34.7 ± 4.0 1.9 ± 1.4 2.7 × 1.3 780 × 375 1.3 × 1025 D4 48.5 ± 5.0 8.4 ± 1.9 2.2 × 1.9 635 × 550 1.8 × 1025
Notes.(∗)Assuming the emission is located at the redshift of M0520.
weighting and a 10 kλ Gaussian taper to down-weight long base-lines. At this resolution (21.100 × 17.200), the diffuse elongated
source (labelled here as D1) appears slightly more extended, with a more homogeneous brightness distribution. This image also brings forth other patches of diffuse emission surrounding D1, with lower surface brightness and extended on large scales. In particular, NW of D1, a filamentary structure (labelled as D2) extends over ∼1.80 from the SW part of D1 towards the cen-tre of M0520. North of D1 other patches of emission (labelled as D3) are found, with similar orientation as D1 and extended over ∼2.70. A more regular roundish patch (∼20× 20) of low
sur-face brightness emission (labelled as D4) is located SE of D1. To check the reliability of this underlying emission (D2, D3, D4), we subtracted from the uv-data the contribution from all the unrelated radio sources, including those from D1, and carefully inspected the residual dataset, especially at the short baselines. Neither residual low level RFI nor bad data were found. We imaged the residual dataset with different pa-rameters and found the emission is seen by all baselines shorter than 0.7 kλ. We also produced images by selecting different groups of channels and time ranges and found the emission is visible at all frequencies and for the whole duration observation. Such emission regions have only positive brightness values, and we can exclude that they are artefacts arising from the bright radio galaxy at the centre of M 0520 (that affect a smaller area around it; i.e. within the dashed circle in Fig. 1). In particular, the extended emission regions D2 and D3 do not have (positive or negative) counterparts at the opposite side of the bright cen-tral source, which strongly argues against a connection with its residual sidelobes.
In Fig.2, the red contours represent the full-resolution image (shown in Fig.1, left panel), starting at the level of ±6σ, to help identifying the position of individual discrete radio sources. We note that no discrete radio sources are embedded in the patches of extended emission (D2, D3, D4), excluding any possibility that these features result from the blending of compact sources.
2.3. Analysis
To seek for confirmation of the newly detected diffuse emission, as well as to provide a rough estimates of its spectral index, we have inspected all the available images of the M0520 field in the public radio surveys. Owing to their low sensitivities, none of the diffuse components (D1, D2, D3, D4; see Fig.2, left) are detected either in the 74 MHz VLSS (Kassim et al. 2003;Lane et al. 2008) and VLSSr (Lane et al. 2012) or in the 153 MHz TGSS5surveys.
Hints of diffuse emission are visible in the NVSS (NRAO VLA Sky Survey;Condon et al. 1998) 1.4 GHz image. To im-prove the quality of the survey image, we have reprocessed
5 http://tgss.ncra.tifr.res.in/150MHz/tgss.html
and analysed the NVSS (project AC308) pointing containing the M0520 field. The data were imaged after a new calibra-tion and phase self-calibracalibra-tion in AIPS. The rms sensitivity level achieved in the final image is ∼0.25 mJy/beam, with a restoring beam of 45.800 × 29.900 (p.a. −70.0◦), which is about
three times lower than the NVSS public image (local noise of ∼0.5 mJy/beam, 4500 restoring beam). The residual
ampli-tude errors are ∼5%. In the right-hand panel of Fig.2we show the contours (in blue) from the final re-calibrated NVSS image (starting from ±2σ1400 MHz = 0.5 mJy/b level). For a proper
comparison, these are overlaid on a 323 MHz GMRT image (in grey scale) of similar resolution (41.500 × 33.500), obtained us-ing only the visibility data correspondus-ing to baselines shorter than 15kλ, with robust 0 weighting and a 4 kλ Gaussian ta-per. The dashed grey contour corresponds to the+3σ323 MHz =
1.65 mJy/beam level of the image. At the ∼2σ1400 MHz level,
the diffuse components clearly detected at 323 MHz are only marginally detected in the NVSS data. In particular, when con-sidering the diffuse elongated source D1, only part of the emis-sion SE of S1 and its SW brightest region are detected. Only patches of the emission within the regions D2, D3, and D4 are detected. This is due to the worse surface brightness sensitivity of the NVSS image compared to the 323 MHz image.
We measured the total flux densities of each patch (D1 to D4) at 323 MHz and 1.4 GHz by integrating the two images, corrected for the respective primary beam, over the same ar-eas (i.e. within the dashed ellipses shown in the right-hand panel of Fig.2). S1 and S2 are blended at the low-resolution of the 1.4 GHz image, not allowing an accurate measurement of their individual flux densities. We thus estimated their global flux density by integrating the two low-resolution images in Fig. 2 (right panel) over a same area that encompasses their emission at both frequencies; we found ∼4.5 mJy at 1.4 GHz and ∼30 mJy at 323 MHz. These values were subtracted from the total flux densities measured in the D1 region to provide an estimate of the flux density of the diffuse emission alone.
The flux density measurements of each component are re-ported in Table1, together with their uncertainties. These are computed as σS = q (σrms× p Nbeam)2+ (σamp)2
where σrmsis the rms noise of the image, Nbeamthe number of
in-dependent beams in the region where the flux densities are mea-sured, and σampthe residual amplitude error.
Owing to the marginal detection in the NVSS, the measure-ments of the flux densities of each patch of emission at 1.4 GHz are actually affected by large uncertainties. Moreover, part of the flux density is likely missed in the reprocessed NVSS image, due to the very short duration (∼1 min) of the observation, which re-sults in a sparse uv-coverage and loss of sensitivity to the struc-ture. Therefore it is not possible to properly estimate the spectral A13, page 4 of9
indices for each component. We are planning deeper and higher resolution follow-up observations at 1.4 GHz and other frequen-cies, which are necessary for a precise spectral analysis and for an accurate study of the newly discovered extended emission.
The angular extent of each component (D1-D4), estimated measuring the major and minor axes of each ellipse of Fig.2, are reported in Table1. Under the assumption that those structures are located at the cluster redshift z= 0.336, their projected linear extents are in the range 500–800 kpc (see Table1). The derived total radio powers at 323 MHz is also reported in Table1, under the same assumption.
3. Chandra X-ray analysis
A simple overlay of the GMRT radio contours on the archival Chandra raw image of M0520 central field (∼200 × 200)
im-mediately revealed that the newly detected diffuse elongated ra-dio source D1 (see Sect.2.3) coincides with an extended X-ray component, unclassified in the literature. The nature of this dif-fuse X-ray emission is studied in the following sections through available multi-wavelength data.
3.1. Data reduction and images
We re–analysed the Chandra ACIS-I X-ray data from the public archive (obsid: 3272, total exposure ∼20 ks, which is same as the one analysed inMantz et al. 2010). A filtering of the hard and soft event light curves only reduced this exposure by a 1% factor. We binned all photon events in sky coordinates and energy with a fixed angular resolution of 2.500, and a variable energy res-olution matching the camera response. Following an approach described in Bourdin & Mazzotta(2008), we similarly binned two quantities useful for imaging and spectroscopy: the effective exposure time and the estimate of a background noise level. The effective exposure included the spatially variable mirror effec-tive area and detector quantum efficiency, the CCD gaps and bad pixels, and a correction for the telescope motion. These quan-tities were extracted from the Chandra Calibration data base (CALDB 4.4.5) and the events list. The background noise model consists of galactic foreground and cosmic X-ray background (CXB) components, but also false detections due to cosmic-ray-induced particles. It has been fit to the data outside the region of the field of view covered by the target. As described inBartalucci 2014, for each ACIS-I CCD the particle background model holds a spatially variable spectrum including a power law plus expo-nential continuum and several fluorescence lines. It has been fit to very faint out-of-focus and blank–sky observations performed during the so-called D and E background periods, which cover our observation.
We extracted X-ray images in the 0.5–2.5 keV energy band by correcting the event images for effective exposure and
back-ground noise. The image shown in Fig. 3 has been smoothed
with a Gaussian of ∼500 FWHM to reduce the shot noise, and covers the same region of the sky as shown in Fig.1(left panel). The GMRT 323 MHz contours (same as in Fig.2, left panel) are overlaid on that.
Beyond the known X-ray emission associated with the galaxy cluster M 0520 (Ebeling et al. 2010;Mantz et al. 2010), we clearly detect a SE diffuse X-ray source, located about 80 from the centre of the main cluster and coincident with the newly detected diffuse radio source D1. The peak of X-ray emis-sion of this extended structure corresponds to an unclassified source (namely 1WGA J0521.0-1333; hereafter 1WGA 0521) in
-0.035 -0.027 -0.01 0.023 0.089 0.22 0.48 1 2.1 4.2 8.3
MACSJ0520.7-1328
1WGA J0521.0-1333 1 Mpc
Fig. 3.Smoothed Chandra X-ray image in the 0.5–2.5 keV energy band, with overlaid the 323 MHz GMRT low-resolution contours (same as in Fig.2, left panel; white are negative, cyan are positive).
the WGA Catalog (White et al. 1994). Compared to M 0520, its surface brightness distribution appears to be much less regular, with the brightest part of the X-ray emission slightly elongated in the NE-SW direction.
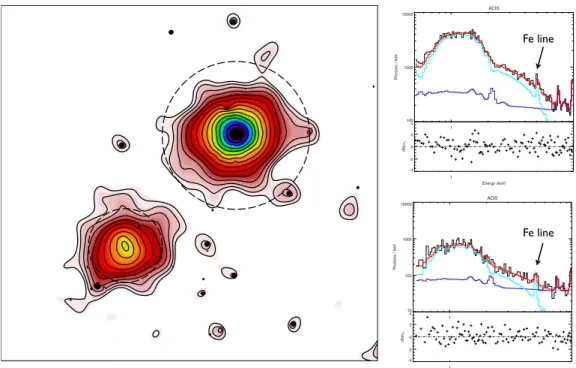
The image shown in Fig. 4 (left panel) is the result of a wavelet analysis including the denoising of the count rate map and the restoration of the X-ray surface brightness. More pre-cisely, the count rate map has first been denoised from the 3σ thresholding of a B3-spline undecimated wavelet transform. This was undertaken by assuming the variance of the wavelet co-efficients to only be dependent on the effective exposure, thanks to the adaptation of a multiscale variance stabilization trans-form (see details inZhang et al. 2008). The exposure-corrected background map has been further projected into the same sig-nificant multi-resolution support (Murtagh et al. 1995) and sub-tracted from the denoised count rate, yielding the X-ray surface brightness.
3.2. Spectral analysis
Spectral analyses were performed assuming a redshifted and
NH absorbed ICM emission spectrum modelled using the
as-trophysical plasma emission code (APEC,Smith et al. 2001), with the element abundances of Grevesse & Sauval (1998) and neutral hydrogen absorption cross sections of Balucinska-Church & McCammon(1992). The NHvalue was fixed to 7.3 ×
1024 m−2, from measurements obtained near M 0520 in the
Leiden/Argentine/Bonn Survey of galactic HI (Kalberla et al. 2005). ICM emission spectra were altered by the effective ex-posure and background noise, but also convolved by a redistri-bution function of the photon energies by the imaging camera. First tabulated within 128 tails of the ACIS-I CCDs using the ChandraInteractive Analysis of Observations (CIAO) software and CALDB 4.4.5, this function was computed for each spec-trum by averaging the redistribution functions associated with each event position.
A&A 565, A13 (2014)
-0.35 -0.34 -0.32 -0.29 -0.23 -0.1 0.15 0.65 1.7 3.6 7.6
Fe line Fe line
Fig. 4. Left panel: wavelet-reconstructed Chandra X-ray image in the 0.5–2.5 keV energy band. The dashed circles correspond to 1 Mpc for M 0520 and 0.5 Mpc for 1WGA 0521, which have been used to extract the spectra. Right panel: X-ray spectra of the two extended sources (top: M 0520, bottom: 1WGA 0521), extracted from the event list in the 0.5–10 keV band.
Table 2. X-ray properties of the two galaxy clusters.
Cluster RAJ2000 DecJ2000 z kT YX Mg,500 M500 r500 (h,m,s) (◦ ,0 ,00 ) [keV] [1014M keV] [1014M ] [1014M ] [kpc] MACSJ 0520–1328 05 20 42.0 –13 28 50 0.336+0.004−0.002 6.2+2.4−1.2 4.0+1.6−0.8 0.65+0.07−0.05 5.3+1.5−0.8 1097+93−60 1WGA J0521.0–1333 05 21 03.3 –13 34 05 0.34+0.01−0.02 3.6+1.4−0.9 1.1+0.4−0.3 0.29+0.04−0.03 2.5+0.6−0.4 851+63−48
We have extracted the spectra of the two extended sources M 0520 and 1WGA 0521 from the event list in the 0.5–10 keV band, within two point-source-excluded circular regions centred
on each of them, with radii of r = 1 Mpc and r = 0.5 Mpc,
respectively. As shown in Fig.4(right panel), these spectra are ideally fit with two ICM emission spectra including their iron line complex redshifted near 5 keV. This identifies both sources as galaxy clusters. Our spectral fit allowed us to estimate two redshift values of 0.336+0.004−0.002 and 0.34+0.01−0.02 as for M 0520 and 1WGA 0521, respectively, consistent with each other and with the redshift of M 0520 measured from optical spectroscopy (see also Table 2). The radii of the two regions used to extract our spectra have been empirically chosen in order to maximise the signal-to-noise ratio of the iron line, and thus best constrain these measurements. In the following estimates, we assume the red-shift of both clusters to be fixed to this optical redred-shift, z= 0.336. To estimate the cluster masses within r500– the radius of a sphere
whose density is 500 times the critical density of the universe – we computed their YX parameter defined as the product of gas
mass Mg,500and average temperature kT (Kravtsov et al. 2006).
As described in, say, Bourdin & Mazzotta (2008), we invert gas mass profiles from the radially average surface brightness of each cluster, then iterated about the YX–M500scaling relation
calibrated from hydrostatic mass estimates in a nearby sample of clusters observed with Chandra (Vikhlinin et al. 2009). This yielded estimates of the total cluster masses M500, radii r500, gas
masses Mg,500, and average temperatures kT , which are reported
in Table2.
4. Optical/IR analysis
In this section we investigate the optical/IR properties of the galaxy clusters M 0520 and 1WGA 0521 by using available cata-logues extracted from the WISE and UKST Red public surveys6.
4.1. Colour–magnitude diagrams
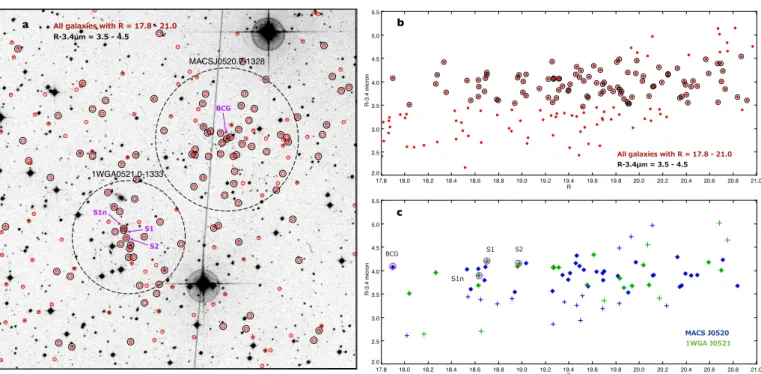
Galaxy clusters are characterised by a well defined sequence of red galaxies, most likely early-type cluster members (see e.g. Gladders & Yee 2005). We used multi-band optical and infrared data to trace the colour-magnitude diagram (hereafter CMD) of galaxies in the central field on M0520 (see panel a of Fig.5; ∼190× 190, same as in Fig.1, left). For this, we matched the archival WISE and UKST Red catalogues sources (with a tolerance radius of 600 for association, i.e., ∼1 FWHM of the WISE band) and plotted the R − 3.4 µm colour as a function of R magnitude. We selected only sources classified as galaxies based on their morphological parameters and areal profile shape (“CLASS= 1” sources in SuperCOSMOS catalog,Hambly et al. 2001). The CMD is shown in Fig.5 (panels b and c). To trace it, we selected galaxies in the magnitude range R = 17.8−21, i.e. within approximately the BCG magnitude and the UKST SES-R survey magnitude limit (Andernach 1999). Even though the field is dominated by cluster galaxies at quite high redshift
6 See http://irsa.ipac.caltech.edu/Missions/wise.html
andhttp://www-wfau.roe.ac.uk/sss/index.html A13, page 6 of9
2.0 2.5 3.0 3.5 4.0 4.5 5.0 5.5 17.8 18.0 18.2 18.4 18.6 18.8 19.0 19.2 19.4 19.6 19.8 20.0 20.2 20.4 20.6 20.8 21.0 R R-3.4 micron 2.0 2.5 3.0 3.5 4.0 4.5 5.0 5.5 17.8 18.0 18.2 18.4 18.6 18.8 19.0 19.2 19.4 19.6 19.8 20.0 20.2 20.4 20.6 20.8 21.0 R R-3.4 micron b c 1WGA0521.0-1333 MACSJ0520.7-1328 a
Fig. 5.a) DSS–R image of the ∼190
× 190
area around M0520 (same as in Fig.1, Right panel); dashed circles have radii r500and are centred on
the X-ray centre of each cluster. The red small circles mark the galaxies selected in the range R= 17.8–21.0; the large black circles show only those galaxies within the range of colours R − 3.4 µm= 3.5–4.5. b) R − 3.4 µm CMD of the galaxies within the ∼190
× 190
area as in panel a) red and black circles as in panel a). c) R − 3.4 µm CMD of the galaxies within the dashed circles in panel a) the crosses are all the galaxies in the range R= 17.8−21.0, the filled dots are the colour-selected once (R − 3.4 µm = 3.5–4.5) .The BCG of M 0520 and the optical counterparts of radio sources S1 and S2 are marked by magenta circles (they are also highlighted by magenta arrows in panel a), for clarity).
for the magnitude limit of SuperCOSMOS catalogue (R∗ ∼ 19.7 at z ∼ 0.336), we identify the most likely red-sequence re-gion in the CMDs, in the range of colours ∼3.5–4.5 (see Fig.5, panel b).
Panel c of Fig.5shows the R − 3.4 µm CMD for the galaxies located within circular areas of radii 1r500(see Table2) from the
X-ray centre of each cluster (see Fig.5a). As is clear from Fig.5
(panel a), almost all the galaxies within these two cluster regions fall in the colour range ∼3.5–4.5, suggesting they all populate the most likely identified red sequence region.
In particular, most of the objects located in the 1WGA 0521 region (Fig. 5, panel c) populate the same locus of the CMD diagrams as the BCG of M 0520 and as galaxies within the r500
radius of the main cluster (Fig. 5, panel c). This is especially true for the likely optical counterparts of the two radio galaxies S1 and S2 (see Fig. 1, right panel). Two galaxies actually lies within the 10σ contour around the radio peak of S, labelled as S1n and S1 in (see Fig.5, panel c); they both could be the optical counterpart of S1, and have similar colours.
We have statistically compared the distribution in the CMD of the galaxies lying within the central regions of the two clusters (i.e. the two circles shown in 5, panel a). According to a 2D Kolmogorov–Smirnov test and with a significance level .5%, we can exclude that the two galaxy distributions are drawn from a different population.
4.2. Galaxy isodensity map and multi-wavelength comparison
Figure 6 shows the galaxy iso-density map in the same 190 × 190 centred in between the clusters M 0520 and 1WGA 0521.
We have used the same catalogues as for the CMD analysis, se-lecting only galaxies in the R magnitude range 17.8–21.0 and in the 3.4 µm–R colour range 3.5–4.5 (from UKST and WISE; see
Sect.4.1). The map has been derived on the basis of a multi-scale approach, as described in Ferrari et al. (2005), and has been op-timised to point out large–scale substructures. The optical iso-density contours are superposed on X-ray contours (same as in Fig.4, left), and the 323 MHz GMRT radio image (greyscale; from same image as in Fig.2left).
There is a very good match between the X-ray and optical emission of both clusters. M 0520 appears to have a more reg-ular, roundish shape (both in the X-ray and the optical), except in the central brightest X-ray region, where the iso-density con-tours are elongated towards NE. On the other hand, the projected galaxy distribution of 1WGA 0521 is far from being spherically symmetric with a clear elongation in the SW/NE direction, re-sembling the X-ray surface brightness distribution (see Fig.3); in particular, most of the galaxies within its r500appear to be
dis-tributed along a very narrow line. Since it is expected that the gas and galaxies follow a similar distribution, these results support the idea that M 0520 is a quite relaxed system, while the more irregular 1WGA 0521 is a disturbed system.
The diffuse radio source D1 is elongated in a similar direc-tion to that of the main galaxy clump of 1WGA0521, and the two diffuse components D2 and D3 partially match the lowest optical iso-density contour of M 0520. In contrast, D4 is located in a outer region, covering an area where no X-ray emission is detected or significant concentration of galaxies is present (at the level of the survey’s magnitude limit and of the Chandra exposure).
5. Discussion and conclusions
We have reported high-sensitivity GMRT radio observations at 323 MHz of the galaxy cluster M 0520, that allowed the de-tection of complex diffuse radio emission. The main feature of this emission is located at a projected distance of ∼80 SE of
A&A 565, A13 (2014)
Fig. 6.Galaxy isodensity map (blue contours), with overlaid the X-ray Chandra contours (green, same as in Fig.4). The radio image (same as in Fig.2, left) is shown in greyscale (with the lowest level corresponding to 3σ323 MHz = 0.82 mJy/b). Only galaxies in the magnitude range R =
(17.8–21) and in the colour range 3.4 µm – R= (3.5–4.5) have been used, and their spatial distribution is shown by red circles.
the cluster centre and was found to coincide with an extended X-ray source seen in the archival Chandra image. We performed a multi wavelength analysis based on archival X-ray and opti-cal/IR data, which allowed us to classify it as a galaxy cluster, namely 1WGA 0521.
Through our X-ray analysis we characterised this newly dis-covered cluster as a low-temperature, relatively small system. From the spectral fitting we derived a redshift that is consistent with the optical redshift of M 0520, z = 0.336. However the un-certainties on our X-ray estimate (Sect.3.2, Table2) do not al-low us to firmly conclude that the two clusters lie at the same distance7. Even though at z = 0.336 their projected separation of ∼2.3 Mpc would easily include the clusters virial radii, the
Chandra image does not show evidence of a bridge of X-ray
emission between M 0520 and 1WGA0521, which could be ex-pected in case of interaction (though this may also be due to the low sensitivity of the exposure).
On the other hand, our optical/IR analysis supports the hy-pothesis that the two clusters lie at similar redshifts, since their galaxy populations lie in statistically similar regions of the colour–magnitude diagram. Optical spectroscopic observations and deeper X-ray observations are needed to accurately deter-mine the 1WGA 0521 redshift and to investigate the dynami-cal scenario of these two systems and possible ongoing physidynami-cal interaction.
7 At z ∼ 0.336, the difference of 0.004 between the X-ray redshift
estimates (see Table2) corresponds to 25 Mpc in luminosity distance. If we also consider their uncertainties from spectral fitting, the distance between the two clusters could be much greater.
The optical iso-density map derived from candidate cluster members shows that 1WGA 0521 has an elongated morphol-ogy, suggesting a disturbed dynamical state. Conversely, M 0520 seems more relaxed (as found byEbeling et al. 2010), with a more regular shape, except for its inner region where the galaxy distribution is slightly elongated.
Our radio images at low resolution reveal a complex distribu-tion of diffuse emission, which we have analysed by identifying four structures (namely D1, D2, D3, and D4, see Sect.2). The diffuse elongated source D1 is the brightest of these features. It is characterised by large-scale and low-surface-brightness, and it is coincident with the newly detected, probably unrelaxed cluster of galaxy 1WGA 0521. These properties are typical of cluster-scale diffuse radio sources. Owing to its projected location in the central region of the cluster, the emission could be a clus-ter radio halo with an elongated morphology. Such a shape may also suggest the source is a radio relic (though located closer to the cluster centre with respect to what is typically observed). The emission in this case would be associated with the passage of a shock wave that may have either accelerated particles from the thermal ICM or revived fossil radio plasma from a previous activity of a radio-loud AGN (which could be one of the two nearby radio galaxies S1 and S2). Following the definition by
Kempner et al.(2004), the source would be classified as radio gischtin the former scenario or a radio phoenix in the latter. The relic could be associated with the cluster M 520, rather than with 1WGA 0521. This hypothesis seems less likely, due to its large distance from the cluster centre (∼2.3 Mpc), much greater than what is typically observed, and the fact that M 520 seems to be A13, page 8 of9
a relaxed system, while relics are always found to be associated to merging clusters. Another possibility that cannot be firmly excluded is that D1 is actually the tail of a tailed radio galaxy, whose nucleus may be identified with S1 or S2. Our present ra-dio data, however, do not allow us to distinguish these possibili-ties, so spectral and polarisation information is needed to clearly classify this source.
Beyond the prominent source D1, additional diffuse emis-sion on a large scale is located around it (D2, D3, D4). The two elongated structures D2 and D3 are difficult to classify. They have an even lower brightness, their shape is filamentary, and they are located in a region in between 1WGA0521 and M 0520. D4 is even harder to interpret, due to its roundish shape and its location in a region where our present data does not show any significant optical or X-ray emission. We suggest that these fea-tures might be related to non-thermal components in the faint inter-galactic medium surrounding 1WGA0521, which is not detected by the current shallow X-ray data owing to sensitiv-ity limits, but may be revealed through more extensive obser-vations (e.g. Planck Collaboration et al. 2013, and references therein).
Multi-frequency high-sensitivity radio observations are essential for properly classifying all the features of the com-plex extended radio emission and understanding their origins. Follow-up observations are planned.
Regardless of the nature of the diffuse radio emission and its possible relation to the cluster’s dynamical state, the most important result of our analysis is that our detection of large-scale diffuse radio emission has led us to discover a new massive galaxy cluster. Indeed, even though M0520 is a system in well studied cluster samples (Ebeling et al. 2010;Mantz et al. 2010;
Horesh et al. 2010) and our X-ray and optical/IR analyses are based on archival data, the existence of the neighbouring cluster 1WGA0521 has been ignored up to now. Although it is quite common that X-ray surveys miss clusters (see e.g.Cagnoni et al. 2001), in this case the radio observations have been crucial to spotting its existence.
Thanks to ongoing and future deep all-sky radio surveys (e.g. LOFAR-Surveys, EMU-ASKAP, MeerKAT-MighTEE, MWA GLEAM), diffuse radio sources will become a powerful tool for discovering dynamically disturbed galaxy clusters and large-scale structure merging/accretion events.
Acknowledgements. We thank the anonymous referee for useful comments. We are grateful to Gianfranco Brunetti and Monique Arnaud for helpful sugges-tions and fruitful discussions. We warmly thank Christophe Benoist for his help in deriving the galaxy isodensity map. We would like to thank the staff of the GMRT for making these observations possible. GMRT is run by the National Centre for Radio Astrophysics of the Tata Institute of Fundamental Research. The National Radio Astronomy Observatory is a facility of the National Science Foundation operated under cooperative agreement by Associated Universities, Inc. GM and CF acknowledge financial support by the “Agence Nationale de la Recherche” (ANR) through grant ANR-09-JCJC-0001-01. GWP acknowledges financial support by ANR through grant ANR-11-BD56-015.
References
Andernach, H. 1999, in Internet Resources for Professional Astronomy, eds. M. R. Kidger, I. Perez-Fournon, & F. Sanchez (Cambridge University Press), 1
Balucinska-Church, M., & McCammon, D. 1992, ApJ, 400, 699
Bartalucci, I., Mazzotta, P., Bourdin, H., & Vikhlinin, A. 2014, A&A, in press, DOI: 10.1051/0004-6361/201423443
Blanton, E. L., Gregg, M. D., Helfand, D. J., Becker, R. H., & White, R. L. 2003, AJ, 125, 1635
Booth, R. S., & Jonas, J. L. 2012, African Skies, 16, 101 Bourdin, H., & Mazzotta, P. 2008, A&A, 479, 307 Cagnoni, I., Elvis, M., Kim, D.-W., et al. 2001, ApJ, 560, 86
Cassano, R., Brunetti, G., Röttgering, H. J. A., & Brüggen, M. 2010a, A&A, 509, A68
Cassano, R., Ettori, S., Giacintucci, S., et al. 2010b, ApJ, 721, L82 Cassano, R., Ettori, S., Brunetti, G., et al. 2013, ApJ, 777, 141 Chandra, P., Ray, A., & Bhatnagar, S. 2004, ApJ, 612, 974
Condon, J. J., Cotton, W. D., Greisen, E. W., et al. 1998, AJ, 115, 1693 Ebeling, H., Edge, A. C., Mantz, A., et al. 2010, MNRAS, 407, 83 Enßlin, T. A., & Röttgering, H. 2002, A&A, 396, 83
Ferrari, C., Govoni, F., Schindler, S., Bykov, A. M., & Rephaeli, Y. 2008, Space Sci. Rev., 134, 93
Feretti, L., Giovannini, G., Govoni, F., & Murgia, M. 2012, A&ARv, 20, 54 Galametz, A., Stern, D., Pentericci, L., et al. 2013, A&A, 559, A2 Giacintucci, S., & Venturi, T. 2009, A&A, 505, 55
Gladders, M. D., & Yee, H. K. C. 2005, ApJS, 157, 1 Grevesse, N., & Sauval, A. J. 1998, Space Sci. Rev., 85, 161
Hambly, N. C., Irwin, M. J., & MacGillivray, H. T. 2001, MNRAS, 326, 1295 Heald, G., et al. (LOFAR Collaboration) 2013, in AAS Meeting Abstracts, 221,
21507
Horesh, A., Maoz, D., Ebeling, H., Seidel, G., & Bartelmann, M. 2010, MNRAS, 406, 1318
Intema, H. T., van der Tol, S., Cotton, W. D., et al. 2009, A&A, 501, 1185 Johnston, S., Taylor, R., Bailes, M., et al. 2008, Exp. Astron., 22, 151 Kalberla, P. M. W., Burton, W. B., Hartmann, D., et al. 2005, A&A, 440, 775 Kantharia, N. G., Das, M., & Gopal-Krishna. 2009, J. Astrophys. Astron., 30, 37 Kassim, N. E., Lane, W. M., Cohen, A. S., et al. 2003, BAAS, 35, 1301 Kempner, J. C., Blanton, E. L., Clarke, T. E., et al. 2004, in The Riddle
of Cooling Flows in Galaxies and Clusters of galaxies, eds. T. Reiprich, J. Kempner, & N. Soker, 335
Kravtsov, A. V., Vikhlinin, A., & Nagai, D. 2006, ApJ, 650, 128
Lane, W. M., Cohen, A. S., Cotton, W. D., et al. 2008, in Frontiers of Astrophysics: A Celebration of NRAO’s 50th Anniversary, eds. A. H. Bridle, J. J. Condon, & G. C. Hunt, ASP Conf. Ser., 395, 370
Lane, W. M., Cotton, W. D., Helmboldt, J. F., & Kassim, N. E. 2012, Radio Sci., 47 [arXiv:1205.4695]
Macario, G., Venturi, T., Intema, H. T., et al. 2013, A&A, 551, A141
Mantz, A., Allen, S. W., Ebeling, H., Rapetti, D., & Drlica-Wagner, A. 2010, MNRAS, 406, 1773
Mao, M. Y., Sharp, R., Saikia, D. J., et al. 2010, MNRAS, 406, 2578 Murtagh, F., Starck, J.-L., & Bijaoui, A. 1995, A&AS, 112, 179 Planck Collaboration 2013, A&A, 550, A134
Planck Collaboration XXIX. 2014, A&A, in press DOI:10.1051/0004-6361/201321523
Rengelink, R. B., Tang, Y., de Bruyn, A. G., et al. 1997, A&AS, 124, 259 Smith, R. K., Brickhouse, N. S., Liedahl, D. A., & Raymond, J. C. 2001, ApJ,
556, L91
Smolˇci´c, V., Schinnerer, E., Finoguenov, A., et al. 2007, ApJS, 172, 295 Tingay, S. J., Goeke, R., Bowman, J. D., et al. 2013, PASA, 30, 7 van Haarlem, M. P., Wise, M. W., Gunst, A. W., et al. 2013, A&A, 556, A2 Vikhlinin, A., Burenin, R. A., Ebeling, H., et al. 2009, ApJ, 692, 1033 White, N. E., Giommi, P., & Angelini, L. 1994, BAAS, 26, 1372
Zhang, B., Fadili, M. J., Starck, J.-L., & Digel, S. W. 2008, Stat. Methodol., 5, 387