HAL Id: hal-02395014
https://hal.archives-ouvertes.fr/hal-02395014
Submitted on 20 Nov 2020
HAL is a multi-disciplinary open access
archive for the deposit and dissemination of
sci-entific research documents, whether they are
pub-lished or not. The documents may come from
teaching and research institutions in France or
abroad, or from public or private research centers.
L’archive ouverte pluridisciplinaire HAL, est
destinée au dépôt et à la diffusion de documents
scientifiques de niveau recherche, publiés ou non,
émanant des établissements d’enseignement et de
recherche français ou étrangers, des laboratoires
publics ou privés.
Central Gulf of Aden conjugate margins
(Yemen-Somalia): Tectono-sedimentary and magmatism
evolution in hybrid-type margins
Chloé Nonn, Sylvie Leroy, Marc Lescanne, Raymi Castilla
To cite this version:
Chloé Nonn, Sylvie Leroy, Marc Lescanne, Raymi Castilla. Central Gulf of Aden conjugate margins
(Yemen-Somalia): Tectono-sedimentary and magmatism evolution in hybrid-type margins. Marine
and Petroleum Geology, Elsevier, 2019, 105, pp.100-123. �10.1016/j.marpetgeo.2018.11.053�.
�hal-02395014�
Central Gulf of Aden conjugate margins (Yemen-Somalia): tectono-sedimentary and magmatism evolution in
1
hybrid-type margins
2
Chloé NONN 1, Sylvie LEROY 1, Marc LESCANNE 2, Raymi CASTILLA2
3
1 - Sorbonne Université, CNRS-INSU, Institut des Sciences de la Terre Paris, ISTeP UMR 7193, F-75005 Paris,4
France.5
2 - Total, CSTJF, Research & Development, Av Larribau Pau, France.6
7
Magma-rich and magma-poor passive margins are generally studied separately. Yet, the spatial evolution from8
one type to another is not well understood. Central Gulf of Aden margins are at the transition between these9
two types of margins. Based on new seismic data, published wells and gravity data, we determine seismic
10
stratigraphy and structural patterns. We map the distinct crustal domains (continental, Ocean-Continent
11
Transition (OCT), oceanic domains) and propose a tectonic evolution of the Yemeni and Somalian conjugate
12
margins in an oblique rifting context. The most striking results are the significant segmentation, narrowness13
and asymmetry of conjugate margins, as well as the gradual eastward decrease in the intensity of magmatic14
activity of these hybrid-type margins. West of Bosaso-Hami Fracture Zone (BHFZ), the Hami-Ahl Medo segment15
presents magmatic-type margin features in the distal Yemeni margin related to the strong influence from the16
Afar plume: Seaward dipping reflectors develop since the late syn-rift stage (~21 - 18 Ma) near the Xiis-Al
17
Mukalla Fracture Zone. Conversely, east of BHFZ, the Bosaso-Sayhut margins segment is characterized by
18
magma-poor margins for which the exhumation stage is characterized by the unroofing of mantle along
19
multiple detachment faults in the OCT and shortly followed by diachronous volcanism (~18 Ma). The central20
Gulf of Aden is affected by a major uplift during the final syn-rift stage and up to OCT formation. This event is21
associated with the formation of erosional surfaces in the east and with gravitational deformation taking place22
on decoupling surfaces at the base of the syn-rift sequence (lower Ghaydah Fm) that lead to the sliding of syn-23
rift units on top of the exhumed mantle rocks in the OCT.24
25
Key words: hybrid margins, Gulf of Aden, crustal domains, tectono-stratigraphic evolution, asymmetry,
26
magmatism.
27
28
Manuscript: Nonn C., Leroy S., Castilla, R., Lescanne M. 2019. Central Gulf of Aden conjugate margins (Yemen-Somalia): tectono-stratigraphic and magmatic evolution of hybrid-type margins. Marine & Petroleum Geology. 105. 100-123. 10.1016/ j.marpetgeo.2018.11.053
29
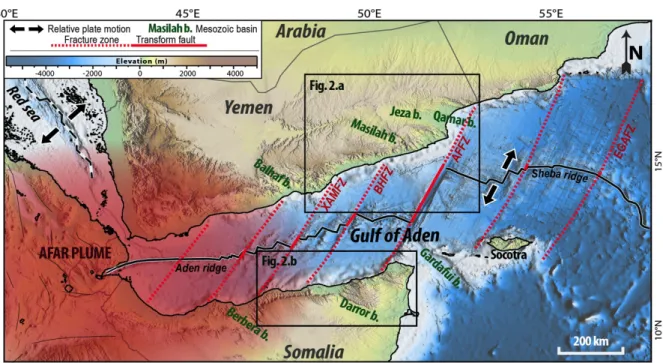
Figure 1- Topographic and bathymetric map of the Gulf of Aden (modified from Nonn et al., 2017) showing the first-order30
fracture zones. Black arrows represent the relative plate motion; the studied area is framed in black in the central Gulf of31
Aden, between the Xiis Al Mukalla Fracture Zone (XAMFZ) and the Alula Fartak Fracture Zone (AFFZ). The Mesozoic basins32
correspond to: (i) the Balhaf, the Masilah, the Jeza and the Qamar basins (b.) in Yemen; (ii) the Berbera, the Darror and the33
Gardafui basins (b.) in Somalia. BHFZ: Bosaso-Hami Fracture Zone. EGAFZ: Eastern Gulf of Aden Fracture Zone.34
35
1. Introduction36
To improve our understanding of how the deformation localized in distal part of the margins, towards the
37
future area of lithospheric breakup, we need to better figure out the actual architecture of crustal domains in
38
present-day passive margins. Despite of variable tectonic and magmatic processes involved during their
39
formation, magma-poor and magma-rich rifted margins present major crustal domains displaying structural
40
similarities at first-order (Péron-Pinvidic et al., 2013). The continental domain is characterized by unequivocal41
continental crust that is progressively thinned in distal parts of the margins. The Ocean-Continent Transition42
(OCT) corresponds to the gradual transition from the thinned continental domain to the stable oceanic crust.43
The rifting process is driven by lithospheric mantle dynamic until the OCT formation (Lagabrielle, 2009; Jolivet44
et al., 2015; Péron-Pinvidic and Osmundsen, 2016). Subsequently, the formation of steady-state oceanic crust45
is driven by asthenospheric mantle dynamic. The geological and geophysical attributes of the OCT contrast
46
from one margin to another, as does the amount of volcanic supply (Péron-Pinvidic and Osmundsen, 2016;
47
Stab et al., 2016).
48
During and after rifting, magmatism is an essential process in the formation of continental passive
49
margins. The question of whether conjugate passives margins are magma-poor or magma-rich, and the along
50
strike variation from one to another, are significant issues for the understanding of rift systems with lateral
51
changes in thermal state. The distinction between margins that are magma-rich (related to large volumes of
52
magma) or magma-poor (related to lithospheric detachment faulting) is based on the timing and degree of
53
mantle melting associated with lithospheric thinning as well as with crustal and lithospheric break-up (White
54
and McKenzie, 1989; Coffin and Eldholm, 1994; Courtillot et al., 1999; Geoffroy et al., 2015). However, the
55
occurrence of hybrid margins, for which the volume of volcanic products varies along strike from magma-poor56
to magma-rich settings (Reston and Manatschal, 2011), show that these definitions are still ambiguous. In any57
case, significant and localized magma supply can contribute to focusing the extension (e.g. Buck, 1991; Ebinger58
and Casey, 2001; Péron-Pinvidic et al., 2013), while diffuse volcanic supply can lead to a wider distribution of59
the extensional stress (Corti et al., 2003).60
In the present study, we focus on the type of stratigraphic, structural and magmatic architectures that61
can develop on a hybrid continental margin. We focus on the central Gulf of Aden located between the Xiis-Al62
Mukalla (XAMFZ) and Alula Fartak (AFFZ) Fracture Zones (area Framed in black, Fig. 1). In this oceanic basin, the63
Somalia-Yemen conjugate margins were formed by a polyphase and oblique divergence of the Arabian and
64
African plates during the Mesozoic and Cenozoic. The little-known studied area is located between magma-rich65
margins in the western part (influenced by the Afar plume; Tard et al., 1991; Beydoun et al., 1998; Leroy et al.,66
2012; Stab et al., 2016) and magma-poor margins in the eastern part (Leroy et al., 2004, 2012, d’Acremont et67
al., 2005, 2006; Autin et al., 2010b; Watremez et al., 2011; Nonn et al., 2017). The aim of this paper is to
68
explore the Cenozoic syn- to post-rift tectonic history of the central Gulf of Aden conjugate margins. Based on
69
interpretations of a dense grid of seismic profiles combined with wells, bathymetric, gravimetric data, we
70
correlate the onshore and offshore stratigraphy; we map the structures and the crustal domains in order to
71
correlate the conjugate margin and constrain their spatial evolution. We attempt to address questions on the
72
nature of the seismic basement in various crustal domains and on the relationships between the
tectono-73
stratigraphic and magmatic evolution of the conjugate margins in an area of along strike transition from
74
volcanic to non-volcanic margins. The mapping of crustal domains shows the narrowness and the asymmetrical
75
style of these hybrid-type margins. The observation of the sedimentary sequences reveals the activity of
76
decoupling surface at the base of the syn-rift sequence from the late syn-rift period to the syn-OCT period. We
77
observed that the period of formation of the OCT is marked by a phase of significant uplift of the whole
78
margins also recorded by significant erosion in the central Gulf of Aden distal margins.79
80
2. Geological setting81
2.1 Kinematic context
82
The continental rifting of Gulf of Aden started 34 Ma ago between the Arabian and Somalian plates (Figs. 1, 2)83
with a direction of extension (N20°E) oblique to the trend of the rift (N70°E) (Roger et al., 1989; Watchorn et84
al., 1998; Leroy et al., 2012; Pik et al., 2013; Robinet et al., 2013). The obliquity led to a significant
85
segmentation characterized by various fault sets including several major fracture zones parallel to the
86
divergence such as the XAMFZ, the AFFZ and the Bosaso Hami Fracture Zone (BHFZ) (in grey, Figs. 1, 2). None
87
inherited zones of weakness trending ~N70°E parallel to the Gulf is reactivated (Autin et al., 2010a, 2013;
88
Bellahsen et al., 2013a). Oceanic seafloor spreading started during the Burdigalian at ~17 Ma in the Gulf of
89
Aden (e.g. Leroy et al., 2004; d’Acremont et al., 2006, 2010; Leroy et al., 2010; Nonn et al., 2017). The oceanic90
spreading rate increases from the west (13 mm yr-1 along N35°E) towards the eastern Sheba-Ridge (18 mm yr-91
1 along N25°E, Jestin et al., 1994; Fournier et al., 2001) (Fig. 2). Extension resulted in magma-rich margins in the92
western part near the Afar plume (Tard et al., 1991; Beydoun et al., 1998; Leroy et al., 2012; Stab et al., 2016)93
and magma-poor margins in the eastern Gulf of Aden, leading to mantle exhumation from the AFFZ to the
94
EGAFZ (Leroy et al., 2004, 2010a; d’Acremont et al., 2005, 2006; Autin et al., 2010b; Watremez et al., 2011;95
Leroy et al., 2012; Nonn et al., 2017) (Fig. 1).96
97
2.2 Structural framework onland and crustal thickness98
In the central Gulf of Aden, significant outcrops of Cenozoic pre-rift units (in orange, Figs. 2, 3.a) occur in series99
of grabens and horsts on the conjugate margins. On the Yemeni margin, the EW to N110°E-trending Masilah100
basin is bounded to the southwest by the Mukalla High, to the northeast by the Fartak High and to the north by101
the Hadramaut Arch (Fig. 2.a). Along the coastline, the Hami graben is limited to the north by the highest relief102
of the Yemeni margin that reaches an elevation of ~2000 m and trends EW (Lat. 15°N, Long. 50°E, Fig. 2.a).103
Basins, plateaus and mountains also form the morphology of the onshore Somalian margin (Fig. 2.b). In the
104
western part, the EW trending Ahl Medo High (2000 m of elevation) borders the Ahl Medo and Bosaso basins105
(Lat. 11°10’N, Long. 49°E, Fig. 2.b). In the eastern part, the Ahl Miskat and the Ahl Bari highs border the major106
WNW-ESE Darror (10°30’N, 49°30’E, Fig. 2.b), the Qandala El Gal and Alula basins (Lat. 11°25’N, Long. 50°10’E107
and Lat. 11°50’N, Long. 50°50’E, Fig. 2.b).108
On the onshore conjugate margins, the continental crust is thinned of ~30-50% towards the ocean (Fig.109
2): Moho depths range from 20 km near the coastline to 35 km at a distance of ~75 km from the coastline to 42110
km in the outer parts of the rift system (Ali and Watts, 2013; Korostelev et al., 2016).111
112
Figure 2 - Simplified geological map of the Central Gulf of Aden conjugate margins (Ellis et al., 1996; Birse et al., 1997; Beydoun, 1970; Bott et al.,113
1992; Bosence, 1997; Brannan et al., 1997; Fantozzi and Sgavetti, 1998; Nichols and Watchorn, 1998; Watchorn et al., 1998; Fantozzi and Ali-114
Kassim, 2002; Leroy et al., 2012; Ali, 2015) (location on Figure 1) showing bathymetry from GEBCO 30 arc-second global grid (2014) and115
interpretation of seismic data, with topographic map in background, for the northern (a) and southern (b) margins. The offshore areas covered116
by seismic profiles are surrounded by the dark purple lines and the conjugate coastlines (represented in black). The colour coding of the117
geological map is the same as on Figure 3: in red, the Neoproterozoic crystalline basement (metamorphic and igneous rocks (e.g. Menzies et al.,118
1992, 1994, 1997; Redfern and Jones, 1995) crops out with a global EW structural trend (e.g. Fantozzi and Ali-Kassim, 2002) near the Mukalla119
High in Yemen (Bosence et al., 1996; Watchorn et al., 1998), near Erigavo and Bosaso cities in Somalia (Warden and Horkel, 1984; Kröner and120
Sassi, 1996). In blue, Jurassic basement; in green, Cretaceous basement; in light orange, Cenozoic pre-rift units (Palaeocene – Eocene); in dark121
brown, syn- rift units (Priabonian – Burdigalian); in light brown, post-rift units (Burdigalian – Pliocene); in white, Quaternary units; in violet, Oligo-122
Miocene volcanic formations. Colourful circles: Onshore crustal thicknesses (a) from receiver function analysis (Korostelev et al., 2016) and (b)123
derived from gravity and flexure modelling (Ali and Watts, 2013). The hydrological network is inferred from sea bottom observations. The124
location of wells is derived from Ahlbrandt (2002), Ali and Watts (2013) and Bott et al. (1992) and other references therein. Top-left inset:125
simplified regional map indicating the relative motions of the Arabian and Somalian plates (red arrows), the fracture zones (in dashed grey) and126
the location of Figures a and b. AFFZ: Alula Fartak Fracture Zone. XAMFZ: Xiis Al Mukalla Fracture Zone. BHFZ: Bosaso Hami Fracture Zone.127
128
129
130
131
132
133
134
135
136
137
138
139
140
141
142
143
144
145
146
147
148
149
150
151
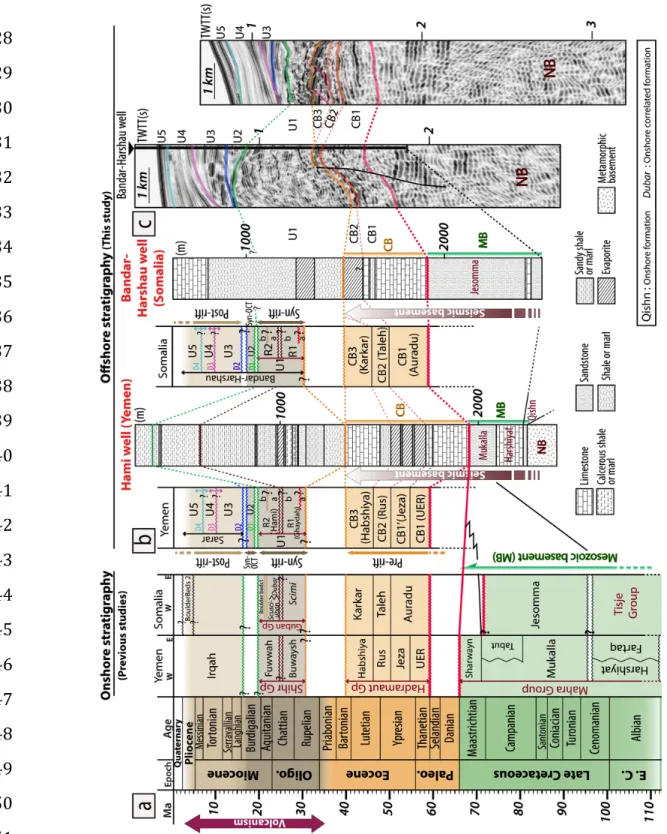
Figure 3 - Synthesis of onshore stratigraphy and correlation with various units proposed for the stratigraphy of offshore
152
profiles. (a) Synthesis of onland stratigraphy of the central Gulf of Aden conjugate margins taking into account the spatial153
distribution (Azzaroli, 1958; Menzies et al., 1992, 1997; Ali Kassim, 1991; Bott et al., 1992; Redfern and Jones, 1995; Kröner154
and Sassi, 1996; Bosence et al., 1996; Beydoun et al., 1996, 1998; Beydoun, 1997; Bosence, 1997; Fantozzi and Sgavetti,155
1998; Fantozzi and Ali-Kassim, 2002; Nichols and Watchorn, 1998; Watchorn et al., 1998; Ahlbrandt, 2002; Bosworth et al.,156
2005; Hakimi et al., 2010; Ali and Watts, 2013; Ali, 2015) (b) Summary of different units in Yemen and Somalia suggested as157
correlating with the offshore stratigraphy. Correlation with Hami well (Yemen) (Bott et al., 1992) and Bandar-Harshau well158
(Somalia) (Ali, 2015; Bott et al., 1992). (c) Correlation with segment of seismic line in Somalia published by (Ali and Watts,159
2013; Ali, 2015) showing the seismic facies and various units mentioned here. The working correlation is based on well data,160
seismic facies, sediment geometries and location of sedimentary units in the stratigraphic column in accordance with the161
tectono-sedimentary evolution of the Gulf of Aden. See text for explanation. CB: Cenozoic basement. Gp: Group. MB:
162
Mesozoic basement. NB: Neoproterozoic basement. UER: Umm Er Radhuma.
2.3 Tectono-stratigraphic record: previous works in the central Gulf of Aden
164
Previous field works and well studies show the relationships between the sedimentary record and tectonic events of165
the central segment of the Gulf of Aden, along the conjugate margins bordering Yemen (e.g. Brannan et al., 1997;166
Huchon and Khanbari, 2003) and Somalia (e.g. Fantozzi and Ali-Kassim, 2002; Ali and Watts, 2016) (Fig. 3). Note that167
the terms ‘pre-rift’, ‘syn-rift’, and ‘post-rift’ are used here with respect to the Oligo-Miocene rifting of the Gulf of168
Aden. In this work, the Mesozoic series are included in the pre-rift sequence.169
170
2.3.1 Pre-rift sequence: Mesozoic and Cenozoic sequences171
The Cenozoic pre-rift succession, which is widely exposed in the central Gulf of Aden segment (Fig. 2), lies
172
unconformably on the Mesozoic basement. Its eastward thickening expresses the eastward increase of
173
subsidence (Beydoun, 1970, 1997; Brannan et al., 1997; Ali and Watts, 2013). In Yemen, the Hadramaut Group174
represents the Palaeocene to Eocene sequence and is composed of the Umm Er Radhuma (UER), Jeza, Rus and175
Habshiya Fms (in orange, Figs. 2, 3.a, b) (Beydoun, 1997; Bosence, 1997; Brannan et al., 1997; Watchorn et al.,176
1998).177
A first major transgression is recorded by the shallow marine reefal carbonates of the UER (Thanetian –178
Ypresian) and marly carbonates of the Jeza Fms (Ypresian) in Yemen (Beydoun et al., 1998) correlated to the179
limestone of the Auradu Fm (Thanetian – Ypresian) in Somalia (Figs. 3.a, b) (Beydoun, 1970; Fantozzi and Ali-180
Kassim, 2002). A second period of regression (middle Ypresian – early Lutetian) is associated with the
181
evaporites of the Rus Fm in Yemen and Taleh Fm in Somalia (Beydoun, 1970; Brannan et al., 1997; Beydoun et
182
al., 1998) (Figs. 3.a, b). The latest transgression (Lutetian) led to the accumulation of the Habshiya Fm in Yemen
183
and Karkar Fm in Somalia (Figs. 3.a, b), which are made up of shallow marine reefal carbonates (Beydoun,
184
1970; Fantozzi and Ali-Kassim, 2002). The Eocene is characterized by a major uplift of the conjugate margins185
recorded by broad erosion at the top of the carbonates of the Habshiya and Karkar Fms (Brannan et al., 1997;186
Leroy et al., 2012) (Figs. 3.a, b).187
188
2.3.2 Syn-rift sequence189
On the northern margin, the onshore syn-rift succession (Shihr Group, Upper-Priabonian – Burdigalian, Fig. 3.a)190
(Watchorn et al., 1998; Beydoun et al., 1998; Ahlbrandt, 2002) crops out along the coast to the East of Al
191
Mukalla city (Fig. 2). On the southern margin, the syn-rift sequence (Guban Group and lower Bandar-Harshau
192
Fms, Fig. 3.a) (Azzaroli, 1958; Fantozzi and Ali-Kassim, 2002) is restricted to the Darror basin and along the
193
coastline east of Qandala city (Lat. 11°N, Long. 49°E, Fig. 2).
194
During the Oligocene, the rifting is characterized by a phase of tectonic subsidence as shown by a
195
transition from clastic to carbonate deposits on the conjugate margins. In onshore Yemen, the Buwaysh Fm is196
composed of alternating shales, sandstones, conglomerates and anhydrites (Beydoun et al., 1998; Ahlbrandt,197
2002) (Fig. 3.a). Offshore Yemen, the Ghaydah Fm (Rupelian – Early Chattian) is characterized by sandstones198
and conglomerates in the lower part and anhydrites and marls in the upper part (Fig. 3. b); this unit is more199
evaporitic towards the west and mainly carbonate-bearing towards the east (Beydoun, 1970; Bott et al., 1992;200
Bosence et al., 1996; Beydoun et al., 1998; Watchorn et al., 1998). In Somalia, the base of the syn-rift sequence201
seen onshore is composed of sandstones and conglomerates correlated with the Scimi Fm (e.g. Fantozzi and202
Ali-Kassim, 2002; Bosworth et al., 2005; Ali and Watts, 2016) (Fig. 3.a). Offshore Somalia, the lower part of
203
Bandar-Harshau Fm comprises anhydrites and shales recorded in the Bandar-Harshau-1 (Bott et al., 1992; Ali
204
and Watts, 2013) (Fig. 3.b).
205
During the Chattian – Burdigalian, rifting intensified and is associated with the development of major
206
faults (Leroy et al., 2012). Onshore Yemen, carbonate marls and conglomerates form the base and a carbonate207
platform forms the top of the Fuwwah Fm (Beydoun et al., 1998; Ahlbrandt, 2002) (Fig. 3.a). Offshore Yemen,208
this sequence is equivalent to the Hami Fm defined by alternations of carbonate marls and sandstones passing209
up into limestones (Beydoun, 1970; Bott et al., 1992; Bosence et al., 1996; Beydoun et al., 1998; Watchorn et210
al., 1998) (Fig. 3.b). The onshore Somalia succession corresponds to reefal carbonates (correlated with the
211
Dubar Fm) which passes laterally into lagoon and fluvial facies (correlated with the Scusciuban Fm) (Azzaroli,212
1958; Ali Kassim, 1991; Bott et al., 1992; Fantozzi and Sgavetti, 1998; Fantozzi and Ali-Kassim, 2002; Bosworth213
et al., 2005; Ali and Watts, 2016) (Fig. 3.a). Offshore Somalia, the Bandar-Harshau Fm corresponds to deep-214
marine deposits (Hughes and Beydoun, 1992) (Figs. 3.b, c).215
216
2.3.3 Syn-OCT development sequence
217
The end of rifting is characterized by a regional uplift and late-stage tilting of the conjugate margins (Leroy et218
al., 2012). On the Somalian margin, the upper part of the syn-rift sequence displays regressive facies overlain219
by syn-tectonic conglomeratic deposits of the Boulder beds 1 Fm (Fig. 3.a) near the coast of Somalia with
220
alluvial fan deposits along normal faults (Fantozzi and Ali-Kassim, 2002).
221
2.3.4 Post-rift sequence
223
On the emerged Yemen margin, the middle Miocene-Pliocene post-rift sequence (Beydoun et al., 1998)
224
unconformably overlies the Shihr Group (Fig. 3) and is composed of marine sandstones, conglomerates and
225
siltstones of the Irqah Fm (Bosence et al., 1996; Nichols and Watchorn, 1998; As-Saruri et al., 2010). However,
226
this unit is restricted to the coastline and is poorly documented onshore (Fig. 2.a). The post-rift sequence
227
records at least three uplift pulses (Watchorn et al., 1998). Offshore Yemen, the Sarar Fm (Figs. 2.a, 3.a)
228
consists of various lithologies including turbidite sands, shales and marls (Bott et al., 1992). On the emerged229
Somalian margin, the post-rift sequence is recorded on the coastline and in the Darror basin (Figs. 2.b, 3). It is230
composed of a conglomeratic unit, named Boulder beds 2 Fm, dated as probably Pliocene (Fantozzi and Ali-231
Kassim, 2002) (Fig. 3.b). Offshore Somalia, the upper part of the Bandar-Harshau Fm (Figs. 2, 3.b, c) is
232
characterized by shale, carbonates and evaporites observed in the Dab-Qua-1 and Bandar-Harshau-1 wells
233
(Bott et al., 1992; Ali and Watts, 2013). Plio-Quaternary volcanic formations dated from ~3 - 6 Ma to present,234
are recorded in the Hami graben (Yemeni, Fig. 2.a), in the Bosaso and the Qandala basins (Somalia, Fig. 2.b) and235
are located in the prolongation of the BHFZ and AFFZ (Bott et al., 1992; Fantozzi and Sgavetti, 1998; Watchorn236
et al., 1998; Leroy et al., 2010b).237
238
3. Data of the central Gulf of Aden conjugate margins239
This study is based on investigations of oil industry data including deep reflection seismic surveys and
240
published information on wells (Bott et al., 1992; Ahlbrandt, 2002; Ali and Watts, 2013; Ali, 2015) (Fig. 2). This
241
analysis benefits from access to a large number of seismic reflection profiles across and along the conjugate
242
central margins of the Gulf of Aden (see area covered by seismic profiles, Fig. 2). The offshore seismic data
243
were acquired during a large-scale and dense seismic survey carried out in the 1980s. Unfortunately, we are
244
not able to show the seismic profiles. Further control on this interpretation is obtained through well data (Figs.
245
3.b, c, 4) and field observations of onshore stratigraphy derived from literature (Bott et al., 1992; Fantozzi,
246
1996; Bosence et al., 1996; Beydoun et al., 1996; Beydoun, 1997; Beydoun et al., 1998; Watchorn et al., 1998;247
Fantozzi and Sgavetti, 1998; Nichols and Watchorn, 1998; Fantozzi and Ali-Kassim, 2002; Bosworth et al., 2005;248
Ali and Watts, 2013; Ali, 2015). The depth to basement and thickness maps are compiled from interpretations249
of all densely spaced seismic data available in the area. The Sismage® software was used to perform grids
250
obtained by interpolating interpreted horizons with a spacing of 10 to 15 km. The depth conversions for the
251
maps and seismic interpretations are carried out according to estimated P-waves velocities from processing
252
stack velocities (Dix formula; Dix, 1955) (1500 m.s-1 for the water and surface sediments, 1800 to 2200 m.s-1
253
for post-rift and syn-OCT units, 2500 m.s-1 for the syn-rift sequence, 5500 m.s-1 for the continental basement,254
6500 m.s-1 for the transitional basement and 7000 m.s-1 for the whole oceanic crust).255
256
4. Results from seismic stratigraphy and crustal domains mapping of the central Gulf of Aden conjugate
257
margins258
For both the northern and southern margins of the central Gulf of Aden segment, we describe the offshore259
seismic stratigraphy using the seismic units and major discontinuities based on a compilation of seismic and260
well data (Figs. 3, 4) correlated with the offshore and previous onshore geological studies (e.g. Bott et al., 1992;261
Fantozzi and Ali-Kassim, 2002; Bosworth et al., 2005). We summarize the seismic units patterns (boundaries,262
geometries, continuity, amplitude, frequency and ages), and the onshore-offshore correlations in Figure 3 and263
Table 1. In a second section, we describe the major features of acoustic basement morphology of offshore
264
conjugate margins thanks to the depth to basement maps (Figs. 5.a, b).265
266
4.1 Seismic stratigraphy267
4.1.1 Pre-rift sequence268
At the top of the tilted blocks in the continental domains, we identify three main sequences (Figs. 2, 3, 4; Tab.269
1): the Neoproterozoic crystalline basement, the Mesozoic basement and the Cenozoic basement (CB1 to CB3).270
In the Cenozoic basement, the CB1 subunit can be correlated to carbonates of the Umm Er Radhuma and Jeza271
Fms on the Yemeni margin and to the Auradu Fm on the Somalian margin using the well data (Figs. 3.c, d).272
Wells data show that CB2 corresponds to the evaporitic Rus Fm on the northern margin and the Taleh Fm on273
the southern margin (Fig. 3). CB3 is composed of double reflectors that are very remarkable, deposited
274
unconformably above the eroded CB2 subunit (Fig. 3.c; Tab. 1), and locally cut by small-offset normal faults
275
that are rooted at a common decollement layer on CB2 (Right segment of seismic line, Fig. 3.c). According to
276
the wells considered, CB3 corresponds to the carbonates of the Habshiya and the Karkar Fms in offshore
277
Yemen and Somalia, respectively (Figs. 3.b, c, 4.a).
278
279
280
281
282
283
284
285
286
287
288
289
290
291
292
293
294
295
296
297
298
299
300
301
302
303
304
305
306
307
308
309
310
311
312
313
314
315
316
317
318
319
320
321
322
323
324
325
326
327
328
329
330
331
332
333
334
335
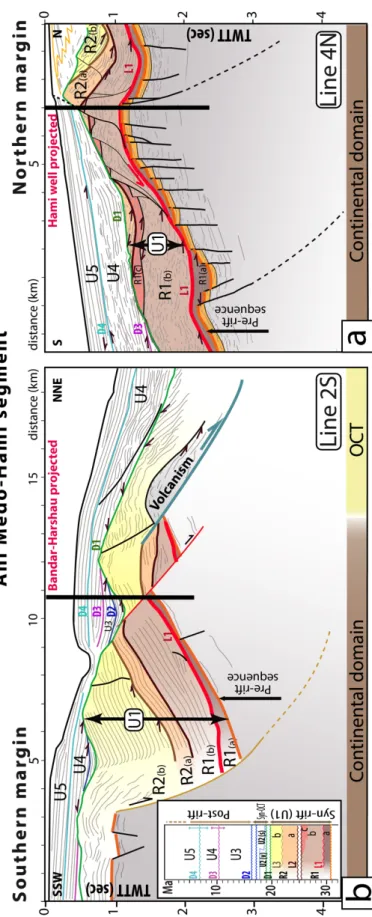
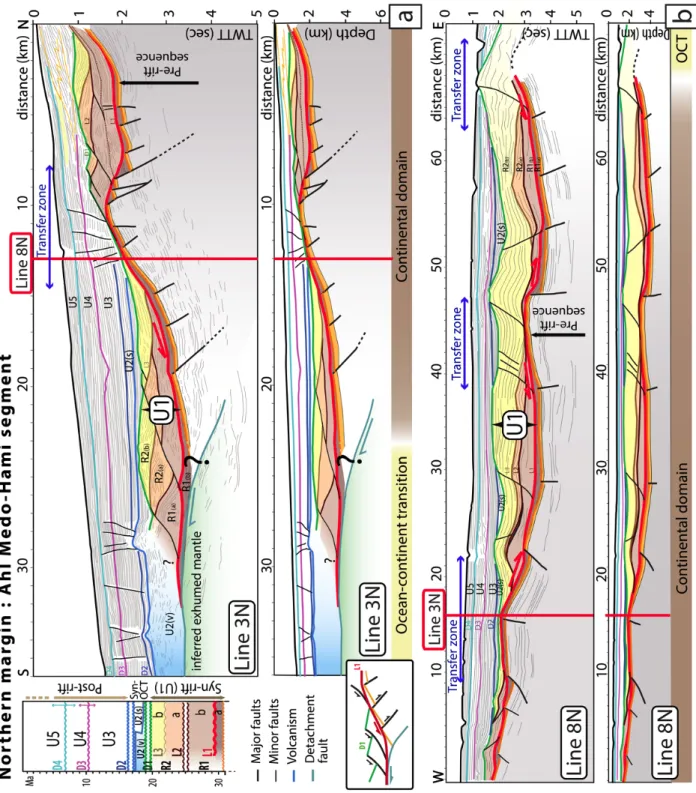
Figure 4 - Interpreted line drawing of (a) the northern part of the seismic line 5N in the northern margin (Location on Figure336
2.a) (b) the seismic line 2S in the southern margin (in the Ahl Medo-Hami segment) with the different sedimentary
337
sequences identified on the seismic profiles in the continental domain and Ocean-Continent Transition (OCT) (vertical
338
exaggeration ~1.8) and the projected Hami well and Bandar-Harshau well. The pre-rift sequence (CB1-2 and the Mesozoic
339
basement) and the upper crust are represented in grey and the top of the pre-rift sequence is represented in orange (CB3).
341
342
343
344
345
346
347
348
349
350
351
352
353
354
355
356
357
358
359
360
361
362
363
364
365
366
367
368
369
370
371
372
373
374
375
376
377
378
379
380
381
382
383
384
385
386
387
388
389
390
391
392
393
394
395
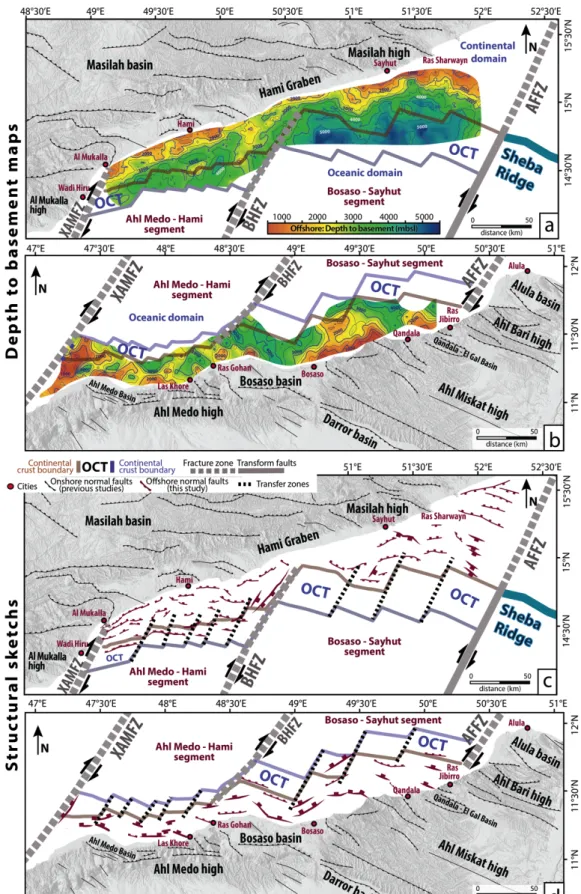
Figure 5 – Upper panels: Depth to seismic basement maps of (a) the Yemeni and (b) Somalian margins established from396
seismic reflection data. Onshore first-order structures (after Beydoun, 1970; Bott et al., 1992; Bosence, 1997; Brannan et al.,397
1997; Fantozzi and Sgavetti, 1998; Nichols and Watchorn, 1998; Watchorn et al., 1998; Fantozzi and Ali-Kassim, 2002; Leroy398
et al., 2012; Ali, 2015) and other references therein. Lower panels: Structural sketches of the northern (c) and southern (d)399
margins with different crustal domains and major structures that affect the continental and transitional seismic basements.400
Thicker lines represent major faults. Note that structures are drawn at the foot of the faults. OCT: Ocean-Continent
401
Transition. AFFZ: Alula Fartak Fracture Zone. BHFZ: Bosaso Hami Fracture Zone. XAMFZ: Xiis Al Mukalla Fracture Zone.
402
Shaded topography is shown onshore (SRTM, Jarvis et al., 2008).
403
404
405
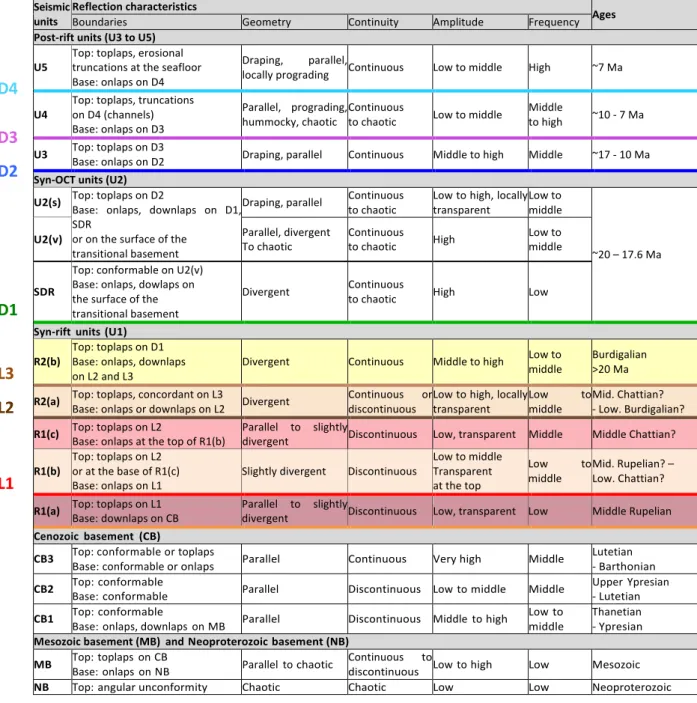
Table 1 - Summary of key observations of the seismic units, with their reflection characteristics and ages.406
407
D4
D3
D2
D1
L3
L2
L1
Seismic units Reflection characteristics AgesBoundaries Geometry Continuity Amplitude Frequency Post-rift units (U3 to U5)
U5 Top: toplaps, erosional truncations at the seafloor Base: onlaps on D4
Draping, parallel,
locally prograding Continuous Low to middle High ~7 Ma U4 Top: toplaps, truncations on D4 (channels)
Base: onlaps on D3
Parallel, prograding,
hummocky, chaotic Continuous to chaotic Low to middle Middle to high ~10 - 7 Ma U3 Top: toplaps on D3 Base: onlaps on D2 Draping, parallel Continuous Middle to high Middle ~17 - 10 Ma Syn-OCT units (U2)
U2(s) Top: toplaps on D2 Base: onlaps, downlaps on D1, SDR
or on the surface of the transitional basement
Draping, parallel Continuous to chaotic Low to high, locally transparent Low to middle
~20 – 17.6 Ma U2(v) Parallel, divergent To chaotic Continuous to chaotic High Low to middle
SDR
Top: conformable on U2(v) Base: onlaps, dowlaps on the surface of the transitional basement
Divergent Continuous to chaotic High Low Syn-rift units (U1)
R2(b) Top: toplaps on D1 Base: onlaps, downlaps
on L2 and L3 Divergent Continuous Middle to high
Low to
middle Burdigalian >20 Ma R2(a) Top: toplaps, concordant on L3 Base: onlaps or downlaps on L2 Divergent Continuous discontinuous or Low to high, locally transparent Low middle to Mid. Chattian? - Low. Burdigalian? R1(c) Top: toplaps on L2 Base: onlaps at the top of R1(b) Parallel to slightly divergent Discontinuous Low, transparent Middle Middle Chattian? R1(b) Top: toplaps on L2 or at the base of R1(c)
Base: onlaps on L1 Slightly divergent Discontinuous
Low to middle Transparent at the top
Low to
middle Mid. Rupelian? – Low. Chattian? R1(a) Top: toplaps on L1 Base: downlaps on CB Parallel to slightly divergent Discontinuous Low, transparent Low Middle Rupelian Cenozoic basement (CB)
CB3 Top: conformable or toplaps Base: conformable or onlaps Parallel Continuous Very high Middle Lutetian - Barthonian CB2 Top: conformable Base: conformable Parallel Discontinuous Low to middle Middle Upper Ypresian - Lutetian CB1 Top: conformable Base: onlaps, downlaps on MB Parallel Discontinuous Middle to high Low to middle Thanetian - Ypresian Mesozoic basement (MB) and Neoproterozoic basement (NB)
MB Top: toplaps on CB Base: onlaps on NB Parallel to chaotic Continuous discontinuous Low to high to Low Mesozoic NB Top: angular unconformity Chaotic Chaotic Low Low Neoproterozoic
408
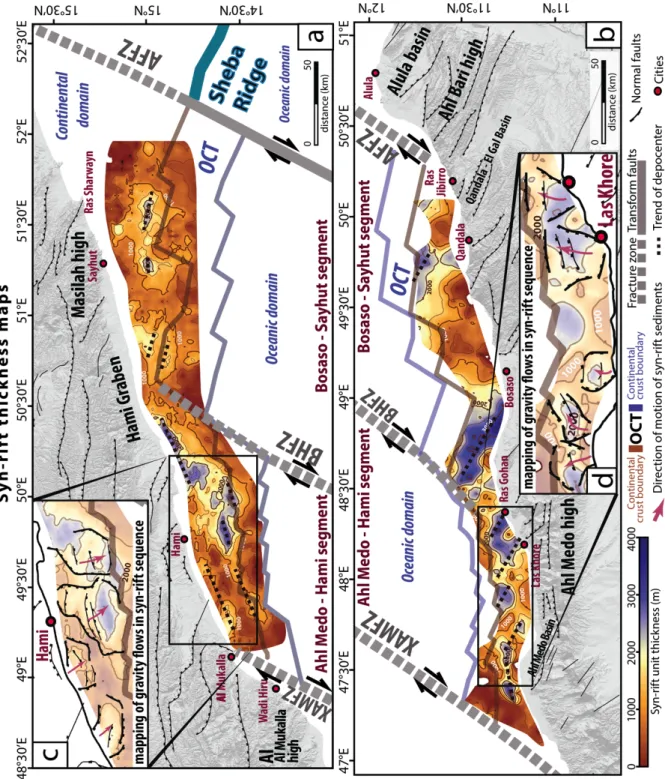
Figure 6 - Isopach map of the syn-rift unit (U1) inferred from our interpretation of the datasets for (a) the Yemeni margin409
and (b) the Somalian margin. In black insets: mapping of gravity flows in the syn-rift sequence U1 and direction of motion;410
major normal faults are represented by thick lines and no evidence of reverse faults is observed. OCT: Ocean-Continent
411
Transition. AFFZ: Alula Fartak Fracture Zone. BHFZ: Bosaso Hami Fracture Zone. XAMFZ: Xiis Al Mukalla Fracture Zone.
412
Onshore topography is shaded (SRTM, Jarvis et al., 2008).
413
415
Figure 7 - Interpreted line drawing of (a) the seismic profiles 4N and (b) the along-strike seismic line 9N in the northern
416
margin (in the Ahl Medo-Hami segment) with the different sedimentary sequences identified on the profiles and
417
interpretation of crustal domains (vertical exaggeration ~1.8). See location on Figure 2.a. (a) Seismic profiles 4N: Some intra-418
R1(b) decollement layers are recorded. Lower pannel: depth converted seismic line and its interpretation, with no vertical
419
exaggeration. (b) seismic line 9N: the transfer zones are characterized by positive relief delimiting syn-rift basins. Lower
420
panel: depth converted seismic line 9N and its interpretation, with no vertical exaggeration. In grey under the orange unit421
(CB3), the top of the pre-rift sequence CB1-2 and the Mesozoic basement (~2 km of thickness, characterized by sub-parallel422
to chaotic reflections), the Neoproterozoic basement and the upper crust are in contact with the exhumed mantle in distal423
part of the margin (at a distance of 16 – 25 km from the North of the cross-section). Inset: Sketch of the line 4N showing the424
geometry of the faults and their chronology. Left panel: Simplified seismic stratigraphic column.425
4.1.2 Syn-rift sequence
426
The syn-rift sequence U1 in the central Gulf of Aden is dated as Oligo-Miocene (Fig. 3) and composed of a
427
clastic to carbonate deposits in the Hami well (Yemen, Figs. 3.b, 4.a) and Bandar-Harshau well (Somalia, Figs.428
3.b, 4.b). The thickness of U1 varies from 0 to 3500 m in the continental domain (Figs. 6 to 10) and decrease429
westwards from the Ahl Medo-Hami (Figs. 6 to 8, 10.a, b, c) to the Bosaso-Sayhut segment (Figs. 6, 9, 10.d). U1430
is thinner on the northern margin (reaching 2500 m, Figs. 6.a) in interpreted profiles 2N to 8N (Figs. 4.a, 7 to 9),431
than on the southern margin (reaching 3500 m, Fig. 6.b) in interpreted profiles 1S to 5S (Figs. 4.b, 10).432
The deformation of U1 is decoupled from the basement structures (Figs. 3.c, 4.a, 6.c, d, 7 to 9). U1 is
433
mainly recorded in the centre of the syn-rift sub-basins (that trend N70°E to N80°E, EW to N120°E; Figs. 6.a, b)434
and between the areas of positive topography corresponding to and N30°E to N40°E transfer fault zones (Figs.435
5, 7):436
• N70°E to N80°E-trending depocenter: On the Yemeni margin in the Ahl Medo-Hami segment, U1 displays437
N70°E-trending depocenter and is up to 2500 m thick (Figs. 6.a, 7, 8). Four main submarine landslides are438
mapped with a global SE direction of flow (orthogonal to the depressions along a N70°E-axis parallel to the439
coastline; Fig. 6.c). On the Somalian margin, U1 displays a N80°E-elongate depocenter east of the XAMFZ440
(Fig. 6.b).441
• EW to N120°E-trending depocenter: On the Yemeni margin in the Bosaso-Sayhut segment, U1 fills en
442
echelon N110°E-elongated basins and reaches up to ~2000 m (e.g. South of Ras Sharwayn, Figs. 6.a, 9.b).443
On the Somalian margin, from north of the Ahl Medo basin to the northwest of the Bosaso city, several en444
echelon sedimentary packages (up to ~3200 m thick, Fig. 6.b) trending N120°E are obvious (Figs. 10.a, b, c).445
Five main submarine landslides are observed with global NE direction of flow (orthogonal to depressions446
along a EW to N120°E-axis; Fig. 6.d).447
• N30°E to N40°E-trending highs: On the Yemeni margin, U1 is 1500 m thick with a N30°E-trend southwest448
of the Hami graben and along the western border of the BHFZ (Fig. 6.a). On the Somalian margin, U1 is less449
than 500 m thick in N40°E-trending zones northeast of Bosaso city (Fig. 6.b). U1 reaches less than 100 m450
and is eroded with a N40°E-trend at the eastern border of the XAMFZ in the eroded basement high (Figs.451
6.b, 10.a).452
453
454
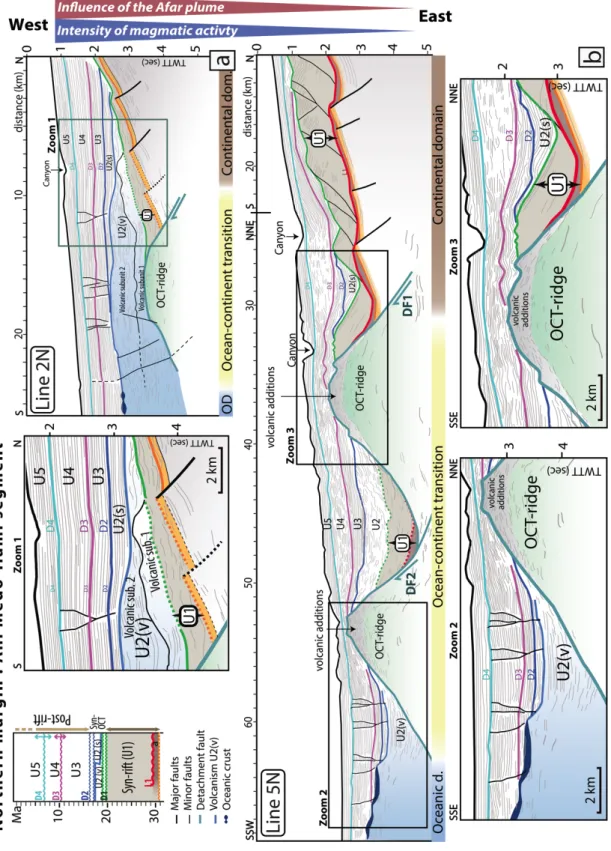
Figure 8 - Interpreted line drawing of the seismic profiles (a) 2N and (b) 5N in the Ahl Medo-Hami segment in the northern455
margin with the different sedimentary sequences identified on the seismic profiles and interpretation of crustal domains in456
the Ahl Medo-Hami segment (vertical exaggeration ~1.8). See location on Figure 2.a. (a) Zoom 1: Close-up view of line 2N457
showing the interpretation of basement structures, volcanic and sedimentary units in the OCT. (b) Zoom 2: Close-up view of458
line 5N showing the interpretation of an OCT-ridge and associated volcanic formations. Zoom 3: Close-up view of line 5N459
showing the interpretation of an OCT-ridge and structural relation between the pre- and syn-rift units in the continental
460
domain and OCT domain. Left panel: simplified seismic stratigraphic column. OD: Oceanic domain.
461
463
464
465
466
467
468
469
470
471
472
473
474
475
476
477
478
479
480
481
482
483
484
485
486
487
488
489
490
491
492
493
494
495
496
497
498
499
500
501
502
503
504
505
506
507
508
509
510
511
512
513
514
515
516
517
518
519
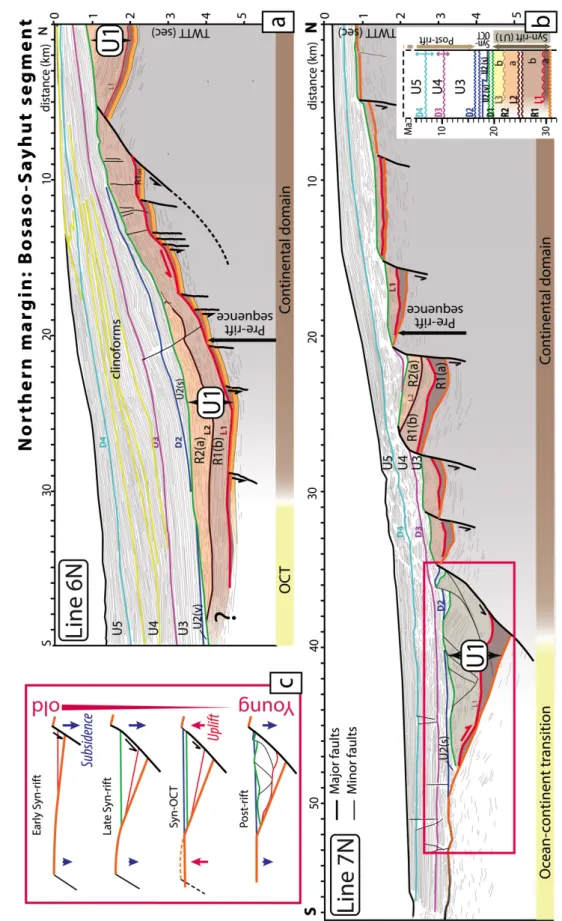
Figure 9 - Interpreted line drawing (a) of the seismic line 6N and (b) of the seismic line 7N in the northern margin (in the520
Bosaso-Sayhut segment) with the different sedimentary sequences identified on the profiles and our interpretation of crustal521
domains (vertical exaggeration ~1.8). Upper left inset: sketch of OCT evolution from the syn-rift (at top) to post-rift phases522
(at bottom). Bottom right panel: simplified seismic stratigraphic column. In grey: the top of the pre-rift sequence (CB1-3 and523
the Mesozoic basement for the seismic line 6N and CB1-CB2 and the Mesozoic basement for the seismic line 7N) and the524
upper crust.525
526
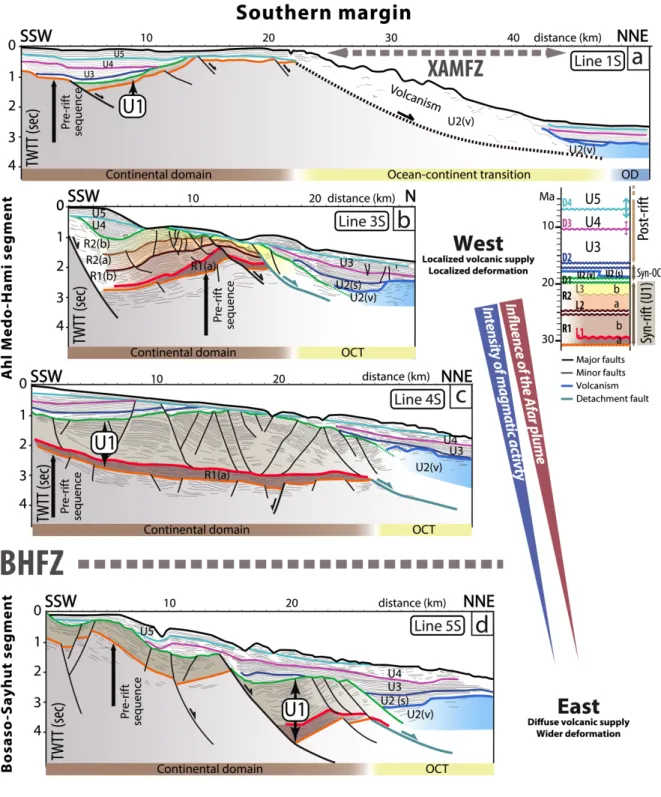
Figure 10 - (a) to (d) Interpreted line drawing of the seismic profiles 1S, 3S, 4S and 5S in the southern margin, with the
527
different sedimentary sequences identified on the profiles and our interpretation of crustal domains (vertical exaggeration
528
~1.8). Location of seismic profiles on Figure 2.b. OD: Oceanic Domain. OCT: Ocean Continent Transition. Right panel:
529
simplified seismic stratigraphic column. In grey: the top of the pre-rift sequence (CB1-2 and the Mesozoic basement) and the530
upper crust.531
532
U1 is composed of two units (R1 and R2, Fig. 3, Tab. 1) and subunits mainly recorded in the Ahl Medo-Hami533
segment, on the Yemeni (Figs. 4.a, 7) and Somalian margins (Figs. 4.b, 10.b), and in the Bosaso-Sayhut segment534
on the Yemeni margin (Figs. 9, 3.b, c). The seismic horizons of U1 are in general parallel and do not display535
significant fan-shape as expected for deposits contemporaneous with fault activity (Fig. 4).536
In the Ahl Medo-Hami segment, unit R1 corresponds to the Ghaydah Fm on the northern margin (Hami
537
well; Figs. 3.b, 4.a; Tab. 1) and to the base of the Bandar-Harshau Fm on the southern margin (Bandar-Harshau538
well; Figs. 3.b, c, 4.b). The unit R1 is composed of three distinct subunits named R1(a), R1(b) and R1(c) (Figs.539
3.a, 4; Tab. 1). The L1 discontinuity delimits the onlaps at the base of the R1(b) subunit and the toplaps of R1(a)540
subunit (Fig. 4, Tab. 1). On the northern margin, some intra-R1(b) decollement layers are recorded on Line 3N541
(Fig. 7.a). South of Hami city, the R1(c) subunit is locally observed and onlaps onto the top of R1(b) on a local542
boundary under the L2 discontinuity (in black, Fig. 7.a; Tab. 1). Extensional faults affecting the R1(b) unit are543
rooted on L1, L2 discontinuities and/or attenuated in R1(a) and R1(c) (Fig. 4.a). R2 is composed of the R2(a) and544
R2(b) subunits delimited by the L3 discontinuity (Figs. 3, 4). The whole syn-rift sequence (U1) is affected by
545
normal faults (in black, Figs. 4, 7, 8.b line 5N, zoom 3, 9.a, 10.b, c, d) and rooted on the L1 discontinuity at the546
base of U1.547
548
4.1.3 Syn-OCT sequence549
The syn-OCT sequence (U2) was deposited during a period of complex transition between the end of the syn-550
rift phase and the onset of the steady-state oceanic spreading (~17 Ma; Leroy et al., 2010a; Nonn et al., 2017)551
(Fig. 3, Tab. 1). U2 is characterized by onlaps that directly cover the OCT basement and the pre- and syn-rift552
sediments in the continental domain (see dark blue horizon for top of U2, Figs. 3.c, 7 to 10, 11.b). U2 is absent553
on the steady-state oceanic crust (Figs. 8, 11.a, zoom 1 on Fig. 11.b). The syn-OCT sequence may correspond to554
the sedimentary subunit U2(s) (Figs. 3.c, 7 to 10; Tab. 1) and/or to the volcanic deposits of U2(v) (Fig. 7, zoom 1555
on Fig. 8.a, zoom 2 on Fig. 8.b, Figs. 10, 11; Tab. 1). U2(v) onlaps on top of exhumed basement and displays556
wedge-shape horizons towards the OCT ridge in the western part (zoom 2, Fig. 8.b). In the Yemeni margins on557
the Ahl Medo-Hami segment, two volcanic subunits are recorded on U2(v) (zoom 1, Fig. 8.a). U2(s) onlaps, in558
some place, on top of U2(v) at the end of the syn-OCT period (Figs. 7, 8, 10, zoom 2 on Fig. 11). Near the
559
XAMFZ, the U2 is more complex and composed of seaward dipping reflectors (SDR1 and SDR2; Fig. zoom 2 on
560
11.b) emplaced during the deformation of highly intruded continental crust. The SDR1 and SDR2 display fan-561
shape growth structures controlled by low-angle normal faults, dipping toward the continent with
high-562
amplitude/low-frequency facies. The top of U2(s) correspond to the erosional discontinuity D2 (Figs. 3, 7, 8,
563
10.b, 11).
565
Figure 11 - (a) Map of the depth to top of volcanic formations in the continental (U2(v)), transitional (U2(v)) and oceanic
566
domains (Oceanic crust). Onshore topography is shaded (SRTM, Jarvis et al., 2008) and location of the seismic line 1N
567
presented in b. (b) Interpreted line drawing of the seismic line 1N in the northern margin (near XAMFZ), with the different568
sedimentary sequences identified on the profiles and interpretation of crustal domains (vertical exaggeration ~1.8. Zoom 1:569
Close-up views of the line 1N showing the interpretations of the low-angle detachment fault in the oceanic crust. The top of570
the oceanic substratum exhibits a highly reflective uppermost reflector identified by its low frequency and high amplitude,571
showing a significant impedance contrast with the overlying post-rift sediments. A very specific transparent seismic unit
572
marks the base of the post-rift sediments. Zoom 2: Close-up views of the line 1N showing the interpretations of the OCT near
573
XAMFZ showing SDRs. In grey: the top of the pre-rift sequence (Cenozoic basement (CB1-2), Mesozoic and Neoproterozoic
574
basements) and the upper crust. Upper right panel: simplified seismic stratigraphic column. OCT: Ocean-Continent
575
Transition. AFTF: Alula Fartak Transform Fault. BHFZ: Bosaso Hami Fracture Zone. XAMFZ: Xiis Al Mukalla Fracture Zone.
576
4.1.4 Post-rift sequence
577
The post-rift sequence (Fig. 3) covers a large part of the continental slope over continental, transitional and578
oceanic crust and thickens oceanward (Figs. 4, 7 to 10, 11.b). On the northern margin, west and east of the579
BHFZ, it attains a thickness of 2300 m and 4000 m (depth converted seismic profiles on Fig. 7). On the southern580
margin, the post-rift sequence is up to 1 600 m thick (Fig. 10). The post-rift sequence lies between D2 and the581
erosional seafloor. It comprises three main units that correlate in terms of timing with post-rift units of the
582
eastern Gulf of Aden (Autin et al., 2010a; Bache et al., 2011; Nonn et al., 2017): U3, U4 and U5 units separated
583
by the erosional unconformities D3 and D4 (Figs. 3, 4, 7 to 11; Tab. 1). U4 shows some occurrences of MTCs
584
(Mass Transport Complexes) on the proximal margins (zoom 2 on Fig. 11.b; Tab. 1). In the Ahl Medo-Hami
585
segment, U4 displays current-formed features corresponding to canyon indentation or contourites which also
586
distort the D4 unconformity at the Yemeni continental shelf break (Figs. 4.a, 7.a). In the Bosaso-Sayhut
587
segment, U4 is defined by large clinoforms (Fig. 9.a).588
589
4.2 Conjugate margins architecture590
Three major domains can be identified according to the geometry, bathymetry, sedimentation infill, gravimetry591
and seismic facies (Figs. 3 to 12): (i) the continental domain is marked by a succession of basins and basement592
highs; (ii) the steady-state oceanic crust is characterized by a rough top seismic basement; (iii) the
ocean-593
continent transition (OCT) is defined as a complex transitional domain between the continental and oceanic594
domains (Figs. 3 to 12).595
596
4.2.1 Major features of acoustic basement morphology from offshore conjugate margins597
In the continental domains of the central Gulf of Aden conjugate margins, the depth to acoustic basement
598
maps (Figs. 5.a, b) corresponds to: (i) the top of the pre-rift sequences in the continental domain; (ii) the top of
599
the intermediated seismic basement in the OCT; and (iii) the top of the oceanic substratum in the oceanic
600
domain in agreement with previous studies in the eastern Gulf of Aden (Autin et al., 2010b; d’Acremont et al.,601
2005; Nonn et al., 2017). The depth to basement maps represents the discontinuity between the upper-layered602
sedimentary seismic facies and a lower more chaotic seismic facies of the seismic substratum (Tab. 1, Figs. 5.a,603
b, 7 to 11).604
The depth to basement map shows steep and narrow slopes all along the conjugate margins. The basement
605
abruptly drops down from 0 mbsl near the coastlines to 5500 mbsl at the foot of the continental slope in the606
northern margin (Fig. 5.a) and to 4000 mbsl at the foot of the continental slope on the southern margin, over607
distance of less than 40 km (Figs. 5.a, b). The basement shows an eastward deepening in agreement with the608
eastward thickening of the sedimentary cover. On the overall morphology of the basement of conjugate margins,609
three main trends are observed (EW to N120°E, N70°E to N80°E and N30°E to N40°E; Figs. 5.a, b):610
• EW to N120°E-trending basins and highs: On the northern margin, in the Ahl Medo-Hami segment and to the611
east of Al Mukalla city (Lat. 14°40’N, Long. 49°30’E; Fig. 5.a), EW escarpments cut the N70°E-trending relief. In612
the Bosaso-Sayhut segment, to the east of the Sayhut city (from Long. 51°30’E to Long. 52°E, Fig. 5.a, 9.a) a613
major basement high has a global N110°E trend toward the AFFZ. On the southern margin and in the Ahl614
Medo-Hami segment, a N80°E-trending basin reaches ~3000 mbsl of depth (Lat. 47°45’E to 47°45’E, Long.615
11°15’N, Figs. 4.b, 5.b, 10.b). In the Southeastern prolongation of the BHFZ, N120°E-trending basin and high616
intersect the N40°E-trending structures (Long. 47°45’E to 48°15’E; Fig. 5.b). In the Bosaso-Sayhut segment,617
trends of basins and highs is N130°E at the North of Bosaso basin (Lat. 11°20’N and Long. 49°E; Fig. 5.b). This618
N120°E trend is also recorded in the northwest of Qandala city (Fig. 5.b).619
• N70°E to N80°E-trending basins and highs: On the northern margin and in the Ahl Medo-Hami segment, a620
N70°E-trending basement high is parallel to the coastline of the Yemen margin and culminates at 1000 mbsl621
near Hami city (Lat. 14°30’N to 14°50’N, Long. 49°E to 50°15’E; Figs. 4.a, 5.a, 7.a). Farther south, at around 55622
km south of Hami city, a N70°E-trending basement high culminates at a depth of 2300 mbsl (Fig. 5.a).
623
Eastward in the Bosaso-Sayhut segment, a basement high (Lat. 14°50’N to 15°15’N) has a global N70°E
624
direction from Long. 51°E up to Long. 51°30’E (Fig. 5.a). On the southern margin, in the Bosaso-Sayhut
625
segment, trends of basins and highs is N70°E in the coastline (from Lat. 11°15’N to 11°30’N and from Long.626
49°15’E to 49°45’E, Fig. 5.b).627
• N30°E-trending basin and highs are recorded near Fracture zones in the Ahl Medo-Hami segment: On the628
Yemeni margin and southwestward of the Hami graben, the western border of the BHFZ is marked by a
629
N30°E-trending basement high at 2000 mbsl depth (Fig. 5.a). On the southern margin, the eastern border of630
the XAMFZ is marked by a steep N40°E-trending basement high at 300 mbsl depth (from Lat. 11°N to 11°30’N631
at Long. 47°15’E; Figs. 5.b, 10.a). In the prolongation of the BHFZ, northeast of Las Khore city (Long. 47°45’E to632
48°15’E, Fig. 5.b), N30°E to N40°E-trending elongate highs and basins vary in depth from 1500m to 4000
633
mbsl.
635
Figure 12 - (a, b) Free-air anomaly and (c, d) Bouguer anomaly maps from the International Gravimetric Bureau (Drewes et636
al., 2012). Onshore topography is shaded (SRTM, Jarvis et al., 2008). The boundaries of crustal domains are drawn. OCT:637
Ocean-Continent Transition. AFFZ: Alula Fartak Fracture Zone. AFTF: Alula Fartak Transform Fault. BHFZ: Bosaso Hami
638
Fracture Zone. XAMFZ: Xiis Al Mukalla Fracture Zone.
639
4.2.2 Continental domain
640
The continental domain of conjugate margins presents a long-wavelength rough morphology at depths ranging641
from 0 to 4500 mbsl (Figs. 5.c, d). The continental seismic basement is characterized by series of angular tilted642
blocks bounded by normal faults (Fig. 5.c, d), completely buried under the sedimentary cover (Figs. 3.b, 4, 6 to643
11). The top of the continental seismic basement is defined by the carbonates of the Cenozoic basement (e.g.644
Figs. 3, 7), the Mesozoic or the Neoproterozoic basement (e.g. Figs. 3, 10) depending on the amount of erosion645
of the pre-rift units. We define oceanward boundary of the continental domain at the place where no more646
pre-rift basement is identified, on the distal margins (neither the Cenozoic basement, nor the Mesozoic
647
basement, nor the Neoproterozoic basement; Figs. 4.b, 5 to 10, 11.b, Tab. 1). However, some thick volcanic648
formations and/or post-rift formations can mask reflections from the seismic basement on the distal margins (Figs.649
4.b, 7.a, Zooms 1 and 2 on Fig. 8, Figs. 10, 11).650
On the northern margin, most of the normal faults exhibit small offsets (~100 - 500 m of dip-slip motion, Figs.651
4.a, 7, 8, 11.b). In the Ahl Medo-Hami segment, the faults dip toward the continent (Figs. 4.a, 7, 8, 11.b); In the652
Bosaso-Sayhut segment, the faults are also mainly continentward-dipping (Fig. 9). On the southern margin, they
653
show greater dip-slip (from 1000 to 4000 m of vertical throw, Figs. 4.b, 10) than on the northern margin (from 100 to654
400 m, e.g. Figs. 4.a, 7, 8, 11.b).655
On the northern margin, the free-air (Fig. 12.a) and the Bouguer (Fig. 12.c) anomalies are negative and positive656
west and east of BHFZ, respectively. On the southern margin, gravity data reveal large-amplitude, long-wavelength657
negative free-air and Bouguer anomalies (Figs. 12.b, d).658
659
4.2.3 Ocean-continent transition660
The transitional domain corresponds to the distal part of the margin where: (i) the geological and geophysical
661
characteristics are typical neither of continental nor steady-state oceanic crust; (ii) a record of the U2 unit (Tab. 1),
662
deposited during the formation of the OCT (Autin et al., 2010; Leroy et al., 2010b), is identified. At the boundary with
663
the continental domain, the OCT domain begins with the disappearance of the clearly identified the Cenozoic,
664
Mesozoic or Neoproterozoic basements (Figs. 7.a, 8 to 10, 11.b; Tab. 1). The top of the transitional basement is
665
difficult to identify and less well defined than the oceanic or continental substratums. Chaotic reflectors characterize666
the internal facies of the OCT basement (Figs. 7.a, 8). The mapped OCT mainly corresponds to an abrupt passage667
from negative to positive free-air (up to ~40 mGal, Figs. 12.a, b) and Bouguer anomalies (~100 mGal, Figs. 12.c, d),668
except in the OCT in the vicinity of the XAMFZ in the northern margin where the free-air (~-50 mGal in the OCT, Fig.
669
12.a) and Bouguer anomalies (~-10 mGal in the OCT, Fig. 12.a) are negative.670
The OCT on the northern margin (Figs. 5.a, c, 6.a) is wider in the eastern segment (~23 - 45 km) than in the671
western segment (~17 – 33 km). On the southern margin, the OCT (Figs. 5.b, d, 6.b) is also wider in the Bosaso-672
Sayhut segment (~ 23 km) than in the Ahl-Medo-Hami segment (~10 – 20 km). The difference in width of the
673
conjugate margins OCTs highlights the asymmetry of the Yemeni and Somalian margins.674
The depth to basement maps (Figs. 5.a, b) reveals an eastward deepening of the transitional basement from675
~3000 mbsl up to ~5200 mbsl in the eastern Bosaso-Sayhut segment on the northern margin. The conjugate margins676
OCTs are completely buried beneath syn-OCT to post-rift cover (Figs. 4.b, 7.a, 8 to 10, 11.b) and locally by the syn-rift677
units slided on the discontinuity L1 (Figs. 4.b, 6, 7.a, 8, 9.b, 10.b, c, d); U2 onlaps the top of the acoustic basement678
and on the allochthon syn-rift units on the OCT substratum (Figs. 4.b, 6, 7.a, 8, 9.b, 10.b, c, d). In both margins, U2(s)679
to U4 are affected by minor normal faults (with offsets of a few metres) and sealed by the discontinuity D3 (e.g. Figs.680
11.b).681
The transitional basement of the northern margin is defined by a flat (Fig. 9) or dome-shaped footwall on682
the edge of the continental domain (called OCT-ridges, Figs. 7.a, 8) capped by a detachment faults. This fault is683
low-angle and northward dipping under the continental domain (Figs. 7.a, 8). In the OCT on the northern
684
margin, the detachment faults are oriented (i) N80°E in the western sub-segment near the XAMFZ (Fig. 5.c) and685
(ii) EW to N95°E in the other five sub-segments of the Ahl Medo-Hami segment at the west of the BHFZ (east of686
Long. 49°25’E; Figs. 5.c, d, 7, 8). West of the BHFZ, two detachment faults (DF1 and DF2) form two OCT-ridges687
(zooms 2, 3; Fig. 8.b): the upper basement DF1 is cut by a second detachment fault DF2 (45 – 49 km to the688
south). On the southern margin, the morphology of the acoustic basement indicates the presence of a basin at689
the foot of the continental slope (Figs. 5.b, 10).690
Evidences of volcanism are identified in the OCT domain: (1) Near the XAMFZ, the northern margin OCT is691
characterized by SDRs (Zoom 2, Fig. 11.b). The SDR1 wedge overlies a continental block characterized by a domed-692
structure referred to here as the outer-high (Zoom 2, Fig. 11.b). The SDR2 and the outer-high are cut by several693
small offset normal faults (Fig. 11.b). (2) The southern margin OCT is affected by volcanism at the location of the694
XAMFZ (Fig. 10.a) and by a volcano that disturbs the overlaying syn-rift cover slided in the OCT (Fig. 10.b). (3) Near695
the BHFZ, the basement of the two OCT-ridges is rough and affected by volcanic additions (hummocky or chaotic,696
high-amplitude low-frequency reflectors; zooms 2, 3 on Fig. 8.b).697
698
4.2.4 Oceanic domain
699
The oceanic domain is defined by a characteristic rough topography of the top of the seismic basement, mostly700
found at ~2000 to 4000 mbsl (Figs. 8.a, 11.a), and entirely covered by post-rift units (Figs. 8, 11.b). The depth to701
oceanic crust basement map (Fig. 11.a) reveals an eastward deepening of the top of the oceanic crust. Near the702
XAMFZ, the oceanic crust is at a depth of 2000 mbsl and dips eastward to reach 3000 mbsl near the BHFZ. In the703
Bosaso-Sayhut segment, the oceanic crust deepens towards the centre of the basin and reaches 4200 mbsl (Lat.704
14°20’N, Long. 50°50’E, Fig. 11.a). We observe a locally a strong reflector that may be interpreted as the Moho (at705
~6.3 s TWTT, Fig. 11.b). It allows us to determine the limit of the steady-state oceanic crust (Figs. 11.a). The
706
oceanic domain displays characteristic free-air gravimetric anomalies, varying from -50 mGal on the oceanic
707
transform faults of XAMFZ, BHFZ and AFFZ to 50 mGal on either side of the AFFZ, with a mean value of -10 mGal in
708
the basin (Figs. 12.a, b). The Bouguer anomaly varies from 100 mGal to 200 mGal (Figs. 12.c, d). Low-angle
709
detachment fault in the oceanic basement (close-up view 1, Fig. 11.b) is associated with a large rotation and
710
exposure of the domal-shaped footwall of the fault over a short distance (~4 km in length).711
712
4.3 Conjugate margins segmentation713
Mapping of the structural domains and syn-rift thicknesses (Fig. 6) highlight NE-trending en echelon offsets of the714
structures (Figs. 5.c, d). Two wavelengths of segmentation are mapped in the central Gulf of Aden. (i) The long-715
wavelength type corresponds to the major dextral fracture zones (XAMFZ, BHFZ and AFFZ), trending ~N30°E on716
the northern margin and ~N40°E on the southern margin (Figs. 5.c, d). (ii) In the Ahl Medo-Hami segment, six sub-717
segments 10 - 30 km in length are subdivided by five ~N30°E-trending transfer zones corresponding to the short-718
wavelength type (Figs. 5, 7). In the Bosaso-Sayhut segment, the sub-segments of 30 - 50 km in length are
719
delimited by three ~N30°E to N40°E -trending transfer zones (Fig. 5). These transfer zones are well correlated all720
along both margins (Fig. 5). They show variable offsets (from 3 to 23 km) affecting the continental and the entire721
OCT domains (Fig. 5), but have so far not developed on the proximal margins. Along the margin, the depth to722
basement map (Figs. 5.a, b) and the along-strike seismic profiles (Fig. 7.b) display basement highs at the location723
of transfer zones. These highs delimit the sub-basins corresponding to the syn-rift depocentres (Fig. 7.b).724
725
4.4 Decollement layer726
The syn-rift unit U1 depocentres (Fig. 6) are characterized by EW to N120°E, N70°E to N80°E and N30°E to N40°E727
trends (Figs. 5.c, d). U1 depocentres seem to be controlled by the overall morphology of the basement (basins and728
highs with EW to N120°E, N70°E to N80°E and N30°E to N40°E trends, Figs. 5.c, d, 7). Indeed, the syn-rift faults
729
appear to be rooted on a common L1 surface on top of R1(a) (in red, Figs. 7, 8). In U1, the subunit R1(a) unit acts
730
as a disharmonic layer (see brown unit, Figs. 7, 8, 9.a, 10.c). The syn-rift structures show various degrees of
731
coupling between the rheologically distinct sedimentary cover and the basement (Figs. 7 to 10, 11.b). Hence, the
732
faults can be restricted to the acoustic basement and to the syn-rift cover above R1(a) and the L1 unconformity
733
(Figs. 4.a, 7, 8, 9.a, 10.c), or can affect the whole syn-rift sequence (including R1(a)) as well as the acoustic
734
basement, e.g. Figs. 4.b, 9, 10.b, d). R1(a) depocentres controlled by the slope are slided into the distal part of the735
margin, towards the ocean. As such, undifferentiated syn-rift units slide locally on the OCT substratum owing to736
the decollement layer L1 (Figs. 6 to 10).737
738
5. Discussion739
The stratigraphic and structural study of our data set (Figs. 3 to 12) in the central Gulf of Aden conjugate
740
margins enable us to discuss (i) the nature of the seismic basement in various crustal domains; (ii) the
741
relationships between sedimentary deposits and volcanism in these hybrid-type conjugate margins; (iii) the
742
tectono-sedimentary and magmatic evolution of the margins system. We compiled these observations on 3D
743
synthetic diagram showing a reconstruction of the conjugate margins at the syn-OCT stage (Fig. 13)744
745
5.1 Nature of the seismic basement and tectonic style746
5.1.1 Continental domain747
In agreement with previous studies in the eastern Gulf of Aden conjugate margins (d’Acremont et al., 2005;748
Leroy et al., 2010b; Nonn et al., 2017), we defined the continental domain in the offshore part of central Gulf of749
Aden conjugate margins based on the following observations: (i) it exhibits a slope morphology; (ii) it is
750
characterized by a series of angular tilted blocks bounded by normal faults; (iii) it is buried beneath the syn- to
751
post-rift sedimentary sequences and (iv) the top of the seismic basement corresponds to the pre-rift units.
752
On rifted margins, three main sub-domains are generally studied separately: (i) the weakly thinned
753
proximal margin (~30-40 km thick); (ii) the necking zone of continental crust defined as an area of intense
754
crustal thinning from ~30 to less than 10 km where the seismic Moho converge towards the top of the
755
basement (e.g. the Norwegian margin, Péron-Pinvidic and Osmundsen, 2016; the Socotra margin, Ahmed et al.,
756
2014) and (iii) the hyper-extended of continental crust that has been observed e.g. in Bay of Biscay-Pyrenees