HAL Id: hal-03079619
https://hal.archives-ouvertes.fr/hal-03079619
Submitted on 17 Jan 2021
HAL is a multi-disciplinary open access
archive for the deposit and dissemination of
sci-entific research documents, whether they are
pub-lished or not. The documents may come from
teaching and research institutions in France or
abroad, or from public or private research centers.
L’archive ouverte pluridisciplinaire HAL, est
destinée au dépôt et à la diffusion de documents
scientifiques de niveau recherche, publiés ou non,
émanant des établissements d’enseignement et de
recherche français ou étrangers, des laboratoires
publics ou privés.
seismic and aseismic slip
Marion Y. Thomas, Jean-Philippe Avouac, Nadia Lapusta
To cite this version:
Marion Y. Thomas, Jean-Philippe Avouac, Nadia Lapusta. Rate-and-state friction properties of the
Longitudinal Valley Fault from kinematic and dynamic modeling of seismic and aseismic slip. Journal
of Geophysical Research : Solid Earth, American Geophysical Union, 2017, 122 (4), pp.3115-3137.
�10.1002/2016JB013615�. �hal-03079619�
Rate-and-state friction properties of the Longitudinal
Valley Fault from kinematic and dynamic
modeling of seismic and aseismic slip
Marion Y. Thomas1 , Jean-Philippe Avouac2 , and Nadia Lapusta2,3
1Department of Earth Sciences, University of Oxford, Oxford, UK,2Department of Geological and Planetary Sciences,
California Institute of Technology, Pasadena, California, USA,3Division of Engineering and Applied Science, California
Institute of Technology, Pasadena, California, USA
Abstract
The Longitudinal Valley Fault (LVF, Taiwan) is a fast-slipping fault (∼5 cm/yr), which exhibits both seismic and aseismic slip. Geodetic and seismological observations (1992–2010) were used to infer the temporal evolution of fault slip. This kinematic model is used here to estimate spatial variations of steady state velocity dependence of fault friction and to develop a simplified fully dynamic rate-and-state model of the LVF. Based on the postseismic slip, we estimate that the rate-and-state parameter (a − b)̄𝜎 decreases from ∼1.2 MPa near the surface to near velocity neutral at 19 km depth. The inferred (a − b) values are consistent with the laboratory measurements on clay-rich fault gouges comparable to the Lichi Mélange, which borders the LVF. The dynamic model that incorporates the obtained (a − b)̄𝜎 estimates as well as a velocity-weakening patch with tuned rate-and-state properties produces a sequence of earthquakes with some realistic diversity and a spatiotemporal pattern of seismic and aseismic slip similar to that inferred from the kinematic modeling. The larger events have moment magnitude (Mw∼6.7) similar to the 2003 Chenkung earthquake, with a range of smaller events. The model parameterization allows reproducing partial overlap of seismic and aseismic slip before the earthquake but cannot reproduce the significant postseismic slip observed in the previously locked patch. We discuss factors that can improve the dynamic model in that regard, including the possibility of temporal variations in (a − b) due to shear heating. Such calibrated dynamic models can be used to reconcile field observations, kinematic analysis, and laboratory experiments and assess fault behavior.1. Introduction
Observations of fault behavior based on seismological and geodetic observations show that within the seis-mogenic depth range, frictional properties must vary spatially allowing for both seismic and aseismic slip [e.g., Obara, 2002; Miyazaki et al., 2011; Thomas et al., 2014a; Avouac, 2015; Wang and Bilek, 2014]. These obser-vations, combined with numerical studies, have demonstrated that the seismic/aseismic segmentation has a strong influence on earthquake sequences: locked segments may rupture independently or together with neighboring patches, producing irregular seismic events of different sizes [Kaneko et al., 2010; Dublanchet
et al., 2013; Thomas et al., 2014b]. This complex behavior arises from the interaction of stress transfer, levels
of prestress, and fault frictional properties. The southern segment of the Longitudinal Valley Fault (LVF) is an outstanding example where such spatial variations of friction can be estimated.
The LVF (Figures 1a and 1b), which runs parallel to the east coast of Taiwan, marks the suture zone between the Eurasian and Philippine Sea Plate [Lee et al., 1998]. It accommodates a reverse left-lateral motion, and it is known to display both seismic and aseismic behavior at seismogenic depth. The LVF creeps near the sur-face [e.g., Angelier et al., 1997; Chang et al., 2009; Thomas et al., 2014a], but it has also produced Mw> 6.8
earthquakes, including four events in 1951 [Shyu et al., 2007] and the Mw6.8 Chengkung earthquake of 2003 [e.g., Wu et al., 2006a; Hsu et al., 2009]. The spatiotemporal evolution of fault slip over the 1992–2010 period [Thomas et al., 2014a] suggests a patchwork of velocity-weakening patches, where the earthquakes can nucle-ate, and velocity-strengthening patches, which produce mostly aseismic creep in the interseismic period or during postseismic transients (Figures 1c–1e). The interseimic, coseismic, and postseismic models largely complement each other, and, to the first order, this simple picture compares well with theoretical models of
RESEARCH ARTICLE
10.1002/2016JB013615
Key Points:
• Time series of afterslip and dynamic modeling are used to estimate friction properties
• Inferred frictional properties are consistent with laboratory values for the effective normal stress distribution with fluid overpressure • Fully dynamic modeling is used
to explore how field observations, geodetic analysis, and laboratory experiments can be reconciled
Supporting Information: • Supporting Information S1 Correspondence to: M. Y. Thomas, mthomas.tectonics@gmail.com Citation:
Thomas, M. Y., J.-P. Avouac, and N. Lapusta (2017), Rate-and-state friction properties of the Longitudinal Valley Fault from kinematic and dynamic modeling of seismic and aseismic slip, J. Geophys.
Res. Solid Earth, 122, 3115–3137,
doi:10.1002/2016JB013615.
Received 3 OCT 2016 Accepted 9 MAR 2017
Accepted article online 17 MAR 2017 Published online 10 APR 2017
©2017. American Geophysical Union. All Rights Reserved.
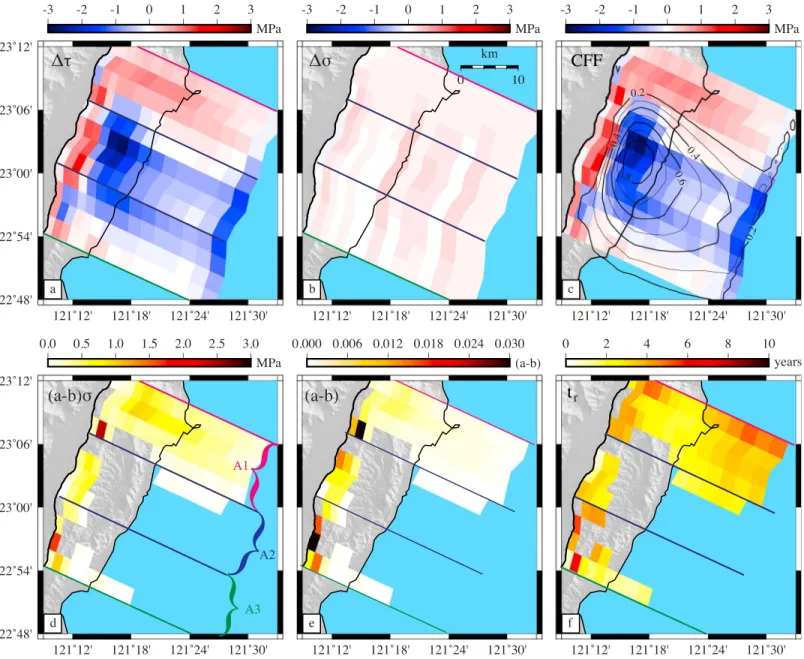
Figure 1. (a) Regional tectonic setting of the Longitudinal Valley Fault. The blue rectangle indicates the location of Figure 1b. DF: deformation front; LCF:
Lishan-Chaochou Fault; and LVF: Longitudinal Valley Fault. (b) Simplified geological map of eastern Taiwan. The Coastal Range is composed of a volcanoclastic formation (Tuluanshan), remnants of forearc basins (Takangkou), and the collision Lichi Mélange [Thomas et al., 2014c]. The grey rectangle indicates the location of Figures 1c–1e, 2, and 4. The black star here and in Figures 1c–1e indicates the epicenter of the 2003Mw6.8 Chengkung earthquake. (c–e) Kinematic inversion for the time evolution of slip on the southern section of the LVF over the period 1997–2010 (see Thomas et al. [2014a] for details). Preseismic slip distribution model inferred from the inversion of the campaign GPS data, the cGPS, and creepmeter time series (Figure 1c). Coseismic slip distribution model of the 2003
Mw6.8 Chengkung Earthquake inferred from the inversion of the static coseismic displacements determined at the cGPS and accelerometric stations (Figure 1d). Postseismic slip distribution determined from the inversion of cGPS and creepmeter time series, leveling data, and permanent scatters (Figure 1e). Black curves show contour lines of coseismic slip distribution.
earthquakes sequences based on rate-and-state friction laws, where the stability of slip on the fault is con-trolled by the lateral and depth variation of frictional properties [e.g., Shibazaki and Matsuura, 1992; Rice and
Ben-Zion, 1996; Scholz, 1998; Lapusta et al., 2000; Kato, 2004; Duan and Oglesby, 2005; Hillers et al., 2006; Ziv and Cochard, 2006; Dieterich and Richards-Dinger, 2010; Kaneko et al., 2010; Barbot et al., 2012]. However, there
are areas of significant overlap of seismic and postseismic slip.
Here we analyze the results of the kinematic inversion of geodetic, remote sensing, and seismological data on the LVF [Thomas et al., 2014a] to derive some of the fault friction properties and to develop a 3-D dynamic model of the seismic cycle on the southern section of the LVF. The expression “seismic cycle” refers here to the recurring episodes of nucleation, propagation, and arrest of seismic slip. It does not imply a periodic behavior. Hereafter, we first describe in details the slip history on the LVF over the area where the 2003 earth-quake happened. We then estimate some frictional parameters from the time series of slip at depth using an
analytical solution [Perfettini and Avouac, 2004] and compare the results with laboratory experimental data [den Hartog et al., 2012]. We finally use this integrative kinematic study to develop a simplified fully dynamic model [Lapusta et al., 2000; Lapusta and Liu, 2009] of the southern section of the LVF, capable of reproducing a long-term slip history compatible with the interseismic, coseismic, and postseismic observations collected along this fault during the most recent seismic cycle. The model is used to assess the method of inferring the steady state friction properties as well as to discuss the discrepancies between the observations and simple rate-and-state models.
2. Slip History on the LVF Over the 2003 Earthquake Area
Thomas et al. [2014a] determined the time evolution of slip on the LVF over the period 1997–2010,
encom-passing the 2003 Chengkung earthquake and the preseismic and postseismic period. The results are summa-rized in Figures 1 and 2, which provide a synoptic view of the time evolution of fault slip in the area of the
Mw6.8 Chengkung earthquake of 2003. This section of the LVF is particularly well constrained and displays noticeable temporal and spatial variations of slip over the study period.
The kinematic model demonstrates that a large fraction (80–90%) of the long-term slip budget on the LVF in the 0–26 km seismogenic depth range, as defined by local seismicity, is actually the result of aseismic creep (Figure 1). The spatial pattern of aseismic creep on the LVF is heterogeneous, showing both along-dip and along-strike variations. Creep is observed at the surface along the southern portion of the LVF, where it cor-relates with the Lichi Mélange [Thomas et al., 2014c]. The Mw6.8 Chenkgung earthquake of 2003 ruptured a 12 km × 16 km patch that had remained locked in the interseismic period; it extends over depths between 8 and 20 km (Figure 1c). The earthquake seems to have nucleated at the boundary of the locked zone, where stress builds up in the interseismic period. Slip then propagated through the locked patch, and partly into the surrounding creeping areas, but failed to rupture the surface (Figure 1d). Afterslip, due to enhanced creep in the immediate vicinity of the rupture (Figure 1e), released a moment equivalent to 0.8 times the seismic moment of the earthquake and decreased approximately logarithmically with time [Thomas et al., 2014a]. Figure 2 illustrates the time evolution of slip in the Chengkung earthquake area. The map view displays the interseismic coupling (ISC), defined as the ratio of interseismic slip rate deficit (long-term slip rate minus inter-seismic slip rate) over the long-term slip rate, and the time evolution of slip is plotted for six representative patches. Time series for all the patches are displayed in the supporting information (Figures S2–S4). The ISC quantifies the degrees of locking of the LVF fault. If ISC = 1, then the fault patch is fully locked, whereas ISC = 0 means that the patch is creeping at the long-term slip rate. The cumulative slip vector at each epoch is pro-jected onto the direction of the long-term slip vector, predicted by the block motion of the Coastal Range relative to the Central Range determined by Thomas et al. [2014a]. The different time series show that slip resulted from a combination of steady creep, afterslip, and seismic slip in proportions that vary in space. Slip distributions before, during and after the 2003 Chengkung earthquake show how seismic and aseismic slip complement each other and sometimes overlap. The rupture extent coincides closely with the area that remained mostly locked in the interseismic period and relocked soon after (Figure 1). Patch 291, which lies at a depth of about 15 km in the middle of the area that produced the largest coseismic slip, is representative of this locked zone (Figure 2). Based on the inversion, this patch slipped about 0.91 m during the main shock and relocked 1 year after it. This patch is representative of the fault area where coseismic slip exceeded 0.60 m. The Chengkung earthquake ruptured the entire well-locked area where ISC was larger than 0.5. The surrounding area, where coseismic slip was lower, shows both coseismic and aseismic slip (Figure 1d). The overlap, which is most prominent at depth where the resolution of our inversions is lower, is only partially explained by the smoothing introduced by the regularization procedure used in the inversions [Thomas et al., 2014a, Figure 5]. The shallow creeping portion of the fault (at the depths of less than about 7 km) seems to have acted as a rather effective barrier during the 2003 seismic rupture, in agreement with the absence of surface ruptures observed in the field [Lee et al., 2006]. For example, patches 197, 257, and 333 (Figure 2) display almost no coseismic slip.
We also find the along-strike and along-dip variations of interseismic creep for the LVF. Close to the surface, a high interseismic creep rate was inferred (6.1 cm/yr) for patch 197, 5.7 cm/yr for patch 257 farther up north, whereas patch 333 displays the smallest creep velocity (4.6 cm/yr). These differences in creep rates are likely due to a combination of heterogeneous stresses due to prior seismic and aseismic slip and heterogeneous frictional properties.
Figure 2. Time series of slip on the fault from the inversions of geodetic data over the period 1997–2010 [Thomas et al., 2014a, Figure 1]. The map view displays
the coupling model on the southern section of the LVF (see Figure 1b for location), with the contour lines of the coseismic slip model (black lines) and epicenter (star) of the 2003 Chengkung earthquake. Graphs around the map view show the time evolution of slip at six patches along the direction of the slip vector predicted by the block motion of the Coastal Range relative to the Central Range. Blue, red, and green curves represent, respectively, the preseismic, coseismic, and postseismic periods. The average slip rate over the preseismic and postseismic period is given. Patches 333, 257, and 197 sample the upper creeping zone. Patch 291 is characteristic of the zone locked before the Chengkung earthquake. Patches 353 and 328 illustrate the behavior of the middle and the deeper fault portion, respectively. Black curves correspond to the fit of the retrieved patch time series, following the relaxation law as described in Perfettini et al. [2010] (equation (5)). Figure S1 in the supporting information displays the same time series minus the preseismic slip rate. Other time series are displayed in Figures S2–S4.
Figure 3. Along-dip variations of slip through time, for three vertical sections on the LVF . The three panels display the cumulative slip (averaged along strike) for
the three vertical swath sections A1, A2, and A3 marked in the map view on Figure 2. Isochrons of the cumulative slip are plotted with an increment of 1 year for the preseismic (blue) and the postseismic (green) periods; red shading shows coseismic slip due to the 2003 earthquake.
During the postseismic period, we observe an abrupt increase of the creep rate right after the earthquake, followed by a relaxation that leads to an approximately logarithmic increase of slip with time, but at different rates for the three patches. Over the 7 years of afterslip, we infer that patches 333 and 257 slipped at a faster rate after than before the Chengkung earthquake, whereas patch 197 underwent a decrease in slip velocity (4.9 cm/yr). At larger depths, in the northern creeping section of the fault, patch 353 displays a behavior similar to that of the shallower patch 333. The higher slip velocities still observed after 7 years could be due to a long relaxation time, or the 2006 Mw6.1 Peinan earthquake that occurred in the same area, or a combination
of both.
For the deepest part of the fault, the spatial resolution strongly decreases [Thomas et al., 2014a]. The resolution is typically less than 1 km near the surface and increases to about 5 km beneath the coastline, where the fault depth is ∼20 km, and reaches gradually about 15 km at the downdip extent of the model, at the depth of ∼30 km. Patch 328 illustrates the overall behavior of the deep section of the fault. According to our model, this patch had been creeping at 4.4 cm/yr in the preseismic period, slipped during the Chengkung earthquake (∼0.15 m of coseismic slip), and was creeping more rapidly in the postseismic period (7.7 cm/yr), with a typical logarithmic behavior.
It is instructive to compare the along-dip variations of slip through time, for three vertical sections: section A1 north of the locked patch, section A2 centered right on the zone of maximum coseismic slip, and section A3 located south of the locked zone (Figure 3; see Figure 2 for the location of the sections). For each section, we average the slip along strike determined at all the patches at the same depth, within a swath spanning four patches (3.16 × 12.64 km). Then we plot the cumulative slip along dip with an increment of 1 year for the pre-seismic and postpre-seismic periods. The last prepre-seismic curve was chosen to represent the total slip accumulated over a full year before the Chenkung earthquake, and the first postseismic curve represents the cumulative slip over 1 year after the main event. Therefore, the areas in red represent the slip due to the coseismic event.
The northern section A1 displays creep all over, from the surface down to the deepest patches of our inversion.
It also records some coseismic displacement, ∼13 cm at the maximum. Before the event, the shallow part of the fault is creeping at the rate higher than the one at depth : around 6.7 cm/yr near the surface versus ∼2.7 cm/yr at 12 km depth and ∼4.8 cm/yr at depths greater than 20 km. Creep increases abruptly at the time of the Chengkung earthquake and decreases gradually during the postseismic period. Unlike for the preseismic period, the decrease of afterslip is more pronounced in the upper part of the fault (7.4 cm/yr on average) than at depth (9.2 cm/yr over the 7 years of postseismic slip at 25 km depth).
The middle section A2 spans the area with the highest coupling and corresponds to the area where most of
the coseismic slip occurs. Before December 2003, this section of the fault was creeping at depths shallower than 8 km and deeper than 17 km, though with a slower creep rate than in section A1 (∼4.3 cm/yr). In the 8–17 km depth range, the fault was ∼80% locked in the preseismic period and fully relocked nearly 1 year
after the Chengkung earthquake. The rupture area of the 2003 earthquake coincides approximately with the area which was locked in the preseismic period, although somewhat offset to larger depths. In contrast, the rupture hardly reaches the surface. Coseismic slip reaches a maximum of 78 cm at 14 km depth. As stated already, the overlap of seismic and aseismic slip at depth is only partially due to the smoothing induced by the regularization of our inversions. After the Chengkung earthquake, aseismic slip occurs at shallow depth, and it relaxes to nearly its preseismic value within a year. Increase of creep rate is also inferred at depth, but the slip rate does not quite come back to its preseismic value after 7 years. Given the lower resolution at depth [Thomas
et al., 2014a], it is unclear whether this observation is really required by the data and warrants interpretation. The southern section A3 shows a ∼8.3 cm/yr creep rate at depth shallower than 5 km before the 2003
earth-quake. At greater depth, the fault is also creeping throughout the study period, though at a lower rate (∼3.7 cm/yr). During the Chengkung earthquake, this section of the LVF seems to have produced some slip with a maximum of ∼42 cm and no significant coseismic slip in the 0–7 km depth range. High postseismic slip is observed at shallow depths (3–12 km) during the first few years following the main chock, with a maximum rate of 10.8 cm/yr around 7 km, but the creep rate rapidly slows down after 1 year. Some afterslip is inferred in the first year at intermediate depths (from 12 to 21 km), but the fault apparently locks up later on. The deep-est portion of the fault (from 21 km to 30 km) roughly creep at the same rate than before the earthquake (∼4.8 cm/yr).
Altogether, the kinematic model shows that the study area has been mostly creeping over the study period, with the Chengkung earthquake and aftershocks accounting for at most 20% of the released moment (or equivalent slip potency) [Thomas et al., 2014a]. Creep is nonuniform, with a deficit of creep in a 10 km × 12 km partially locked zone. The 12 km × 16 km rupture area of the Chengkung earthquake approximately coincides with the locked fault zone, although the rupture area is broader and extends into the deeper portion of the fault. As the first step, our dynamic model (section 4) represents this fault segment as one velocity-weakening patch embedded in a creeping zone displaying velocity-strengthening friction (see section 3 for the defini-tions). Over the 14 years of the study period, coseismic and aseismic slip do not quite even out to uniform slip. The cumulative slip is, on average, larger than the 0.7 m that would have occurred if the fault had been creeping at its long-term slip rate of about 4.5 cm/yr. This is consistent with the finding that the return period of Mw6.8 earthquakes, similar to the Chengkung earthquake, needs to be of the order of 36 years, so that
the moment released by afterslip and coseismic slip adds up to compensate the deficit of the moment accu-mulating during the interseismic period [Thomas et al., 2014a]. The kinematic model does, however, suggest a somewhat more complicated earthquake sequence pattern than the repetition of Chengkung-like earth-quakes. In particular, the coseismic slip and afterslip do not exactly compensate for the deficit of slip observed along the different sections (Figure 3). Presumably, recurring earthquakes must have different but comple-mentary slip distributions to even out the heterogeneities of slip recorded for a single event. It is possible that some seismic ruptures propagate into the shallow creeping fault portion. This may have happened during the a Mw7.1 earthquake in 1950 [Shyu et al., 2007]. So, clearly, this fault segment exhibits a richer behavior than the mere repetition earthquake identical to the 2003 Chengkung earthquake. In spite of this complex-ity, the kinematic model is relatively simple and compares well enough with idealized numerical earthquake sequence models [e.g., Rice, 1993; Lapusta et al., 2000; Lapusta and Liu, 2009], so that a quantitative comparison with prediction from dynamic modeling simulations is possible.
3. Estimate of Frictional Parameters of Velocity-Strengthening Patches
3.1. Method
Let us estimate frictional parameters based on the observed postseismic relaxation. We assume that the fault obeys a rate-and-state friction law with the aging form of the state variable evolution [Dieterich, 1979;
Ruina, 1983]: 𝜏 = ̄𝜎f = (𝜎 − p) [ f0+ a ln ( V V0 ) + b ln ( V0𝜃 L )] , (1) d𝜃 dt = 1 − V𝜃 L , (2)
where𝜏 is the shear stress, 𝜎 is the normal stress, f is the friction coefficient, V is the slip velocity, p is the pore pressure,𝜃 is the state variable, L is the characteristic slip for state variable evolution, f0is the value of
parameters. At constant slip velocity V, the shear stress𝜏 and the state variable 𝜃 evolve to their steady state values𝜏ssand𝜃ssrespectively:
𝜃ss(V) = L V, (3) 𝜏ss= (𝜎 − p) [ f0+ (a − b) ln ( V V0 )] . (4)
Hence, the value of (a − b) defines the fault behavior at steady state: (a − b)> 0 corresponds to velocity-strengthening (VS) frictional properties, which lead to stable slip with the imposed loading rate, while (a − b) < 0 defines potentially seismogenic velocity-weakening (VW) regions. We further refer to VS or VW regions with the implicit understanding that this labeling refers to the steady state behavior.
We compare the time evolution of slip deduced from the inversions of the geodetic data with that predicted from a velocity-strengthening friction law. We assume steady state, since the slip-at-depth time functions retrieved from the inversions do not show the transient early increase of postseismic slip rate, which would reflect the adjustment of the state variable [Perfettini and Avouac, 2007; Perfettini and Ampuero, 2008; Fukuda
et al., 2009]. In the steady state approximation, for a VS material, the friction law only depends on the slip
velocity, and the frictional stress𝜏 increases linearly with the logarithm of the sliding velocity V. If elastic interactions among the various creeping patches are ignored, an analytical solution can be derived [Perfettini
and Avouac, 2004], which can then be used to infer the fault friction properties, as done in a number of studies
[e.g., Perfettini et al., 2010; Hsu et al., 2006]. This model predicts that postseismic slip U(t) evolves as follows:
U(t) ≈ Vpltrln [ 1 + V+ Vpltrt ] , (5)
where tris the relaxation time, Vplis the long-term slip rate, and V+is the sliding velocity on the fault
imme-diately after the earthquake. Then, according to the rate-strengthening friction law, assuming steady state, the frictional parameter (a − b)̄𝜎, where the effective normal stress ̄𝜎 = 𝜎 − p, depends on the ratioVV+
pland
static Coulomb stress change induced by the main shock, ΔCFF = Δ𝜏 − f0Δ𝜎 (with the geomechanical con-vention that normal stress is positive in compression and friction coefficient f approximated as f0) [Perfettini
and Avouac, 2004; Perfettini et al., 2010], as follows:
(a − b)̄𝜎 = ΔCFF ln(V+
Vpl
) . (6)
Using equations (5) and (6), an estimation of the parameter (a − b)̄𝜎 can therefore be deduced by computing the static Coulomb stress change from our coseismic model [Thomas et al., 2014a] and fitting the time evolu-tion of slip for all patches that record postseismic slip to get V+(Figures 2 and 4). The GPS time series used in
the kinematic inversion have been corrected for the effect of the 2006 Mw6.1 Peinan earthquake [Wu et al.,
2006b; Thomas et al., 2014a]. Nevertheless to avoid any bias, we use only the inferred fault-slip motion from 11 December 2003 to 1 April 2006 to determine the frictional parameters.
3.2. Results and Discussion of Frictional Properties of the Velocity-Strengthening Patches
To derive the parameter (a − b)̄𝜎, we first compute the shear and normal stress changes from our coseismic model [Thomas et al., 2014a] using the Coulomb3 software [Lin and Stein, 2004] and then combine them into the calculation of ΔCFF assuming a friction coefficient of 0.6. Stress increase or decrease is computed on each patch for a rake that corresponds to the direction of the slip vector predicted by the block motion of the Coastal Range relative to the Central Range [Thomas et al., 2014a].
The fault geometry used in the kinematic inversions of Thomas et al. [2014a] follows the complex surface fault trace to be compatible with the high spatial resolution afforded by interferometric synthetic aperture radar. However, it is improbable that variations of strike seen at the surface, where the strike is influenced by topography and local geology, hold at depth. Therefore, we compute the change in shear and normal stresses assuming a constant strike equal to the average fault strike (23.4∘) for all fault patches. Changes in shear stress, normal stress, and Coulomb stress are displayed in Figure 4.
The parameter (a − b)̄𝜎 estimated from equation (6) is plotted in Figure 4d. Only patches that show accel-erated creep after the Chengkung earthquake, as well as a positive Coulomb stress change, were selected.
Figure 4. Changes in (a) shear stress, (b) normal stress (positive in unclamping), and (c) Coulomb stress (ΔCFF= Δ𝜏 + 0.6Δ𝜎), from the coseismic model by
Thomas et al. [2014a]. Black curves show contour lines of coseismic slip distribution. Frictional parameters (d)(a − b)̄𝜎, (e)(a − b)assuming overburden minus hydrostatic pore pressure, and (f ) relaxation timetrpredicted from the velocity-strengthening friction law (equation (5)). Only patches that show accelerated
creep after the Chengkung, earthquake as well as a positive Coulomb stress change, were selected.
The friction parameter (a − b) can then be computed assuming the effective normal stress is known. The typ-ical assumption is to calculate the distribution of effective normal stress ̄𝜎 with depth assuming hydrostatic pore pressure and a rock density of 2700 kg/m3. We use this approach in this section (Figures 4 and 5) and
then revisit the inferred (a − b) values with a different effective normal stress distribution suggested by our dynamic modeling in section 4.4. The frictional parameter (a − b) varies with depth from 0.018 near the sur-face (Figure 4e) to less than 0.001 at depth larger than 19 km. The (a − b) values obtained at shallow depth (> 7 km) from our inversion compare well with the estimated values of 0.013 before the Chengkung earth-quake and 0.0066 after the main event, derived from the modeling of seasonal variations of slip rate induced by pore fluid pressure variations [Chang et al., 2009].
We thus observe a general trend toward larger (a − b) values near the surface. Note that our estimated (a − b) values are comparable to the values obtained in laboratory experiments for illite-rich lithology, sim-ilar in lithology to the Lichi Mélange, and assumed to be representative of subduction mélanges in general
Figure 5. (a–c) Along-dip variations of frictional parameters (a − b) predicted from a velocity-strengthening friction law (equation (6), withf0= 0.6and the effective normal stress given by overburden minus hydrostatic pore pressure) for patches within swath sections A3, A2, and A1, respectively (see Figure 4d for location). Dots correspond to values computed based on the time series of one single patch, whereas the lines correspond to an average value within the swath. We averaged the time series for patches at the same depth when they meet the criteria of a positive Coulomb stress change. Then we apply equation (5) on the averaged time series. Negative values of (a − b) (open circles) are hypothetical and based on the coupling model (map view in Figure 2): if the patch is locked (ISC>0.8), we assume that the friction law is velocity weakening. (d) Downdip variations of the averaged (a − b) with temperature based on the thermokinematic model of Simoes et al. [2007]. Green, blue, and pink lines correspond the values obtained for sections A3, A2, and A1, respectively. Black triangles are the (a − b) values obtained in laboratory experiments for illite-rich lithology [den Hartog et al., 2012]. The orange boxes highlight the temperature at which illite-gouge displays VW behavior.
[den Hartog et al., 2012; Ikari et al., 2011]. If we plot the estimated values against the temperature distribution derived from the thermokinematic model of Simoes et al. [2007] (Figure 5d), we observe a trend similar to that observed experimentally on illite-rich gouges [den Hartog et al., 2012], most convincingly for section A2. In particular, the patches inferred to be VW (ISC> 0.8) fall into the 250–400∘C range for which the VW behav-ior is observed in the laboratory. So the temperature may well be the factor explaining depth variations of frictional properties, at least for the section A2: from VS at 150–250∘C to VW at 250–370∘C and VS again for temperatures higher than 380∘C. At depth greater than 20 km, (a − b) stays small implying a nearly velocity neutral friction. These values are smaller than expected from laboratory experiments. As previously under-lined, for the deepest part of the fault, the spatial resolution strongly decreases. At depth greater than 20 km the resolution typically decreases from 5 to 15 km at the downdip extent of the model. Hence, the coseimic model is smoother, which potentially leads to a smaller ΔCFF and underestimation of a − b (equation (6)). We confirmed the robustness of the results by varying (1) the smoothing applied in the kinematic inversion of coseismic slip and (2) the value of the friction coefficient used in equation (6), with f0= 0.6, 0.4 and 0.0. The last case (f0= 0.0) is the end-member of a range of potential situations with low friction coefficient which are
characteristic of some of the velocity-strengthening minerals. Results are displayed in the supporting informa-tion for comparison (Figures S5–S7). Note that the inferred values at depth may be affected by the decreasing resolution of our kinematic inversion [Thomas et al., 2014a].
Note, however, that the thermokinematic model is not well constrained for the LVF, given the lack of thermo-metric and thermochronological data from the Coastal Range. Moreover, the variation in temperature fails to explain the observed lateral variations in friction parameter (a − b), since thermal gradient is probably quite uniform along strike on the LVF. An alternative or additional explanation for the variations in (a − b) can be the presence of competent blocks [Fagereng and Sibson, 2010], which can be kilometer size in the Lichi Mélange [Teng, 1980; Teng et al., 1988], or significant and chronic fluid overpressure that leads to creep even if the fric-tion coefficient is VW. To summarize, the comparison of our results with experimental laboratory studies, with regard to the order of magnitude of the rate dependency of friction for a clay-rich fault zone, suggests that the temperature could at least partly explain the observed variations of slip stability.
3.3. Fault Areas Showing Both Seismic and Aseismic Behavior
While the slip distributions before, during, and after the 2003 Chengkung earthquake show that seismic and aseismic slip are largely complementary, there are some significant overlaps. In particular, we identify two different areas for which the potential physical mechanisms are discussed in the following sections.
In the southernmost section of the fault, few patches near the surface (section A3) display both coseismic slip motion up to 25 cm and large afterslip, with a typical logarithmic behavior (blue polygon in Figure 1e). Consequently, the negative ΔCFF obtained for a long-term fault rake (Figure 4c) is not consistent with the observed postseismic slip. This part of the fault is actually located slightly up north of the area where a joint analysis of leveling and GPS measurements have highlighted two active fault branches for the LVF, the Luyeh fault, and the Lichi fault [Chen et al., 2012]. This subdivision could lead to a slip partitioning. In fact, if we consider the strike-slip and dip-slip motion separately (Figures 6a and 6d) and compute the ΔCFF for a rake of 0∘ and 90∘, respectively (Figures 6b and 6e), the fault behavior is easier to explain. Most of the postseismic slip motion is actually strike slip, and the predicted ΔCFF for a rake of 0∘ on those patches is positive. Therefore, one can imagine that along the southernmost section of the fault, near the fault tip, the behavior is more complex, with two active fault branches that our geodetic data set could not resolve spatially but which have an impact on the computation of the ΔCFF. The corresponding parameter (a−b)̄𝜎 estimated from equation (6) is plotted in Figures 6c and 6f. The friction parameter (a − b), computed by assuming a distribution of ̄𝜎, is displayed in the supporting information (Figure S8).
We also observe afterslip within the rupture area of the Chenkung earthquake which was ∼80% locked in the preseismic period (Figure 3). For this area, the explanation based on slip partitioning developed above appears unlikely. First, there is no evidence of fault branching at the surface, although such evidence could be missed. Second, unlike for the southernmost part of the fault, this area displays the dip-slip and strike-slip components for both coseismic and postseismic slip and consequently shows a negative ΔCFF for a rake of 0∘ as well as for a rake of 90∘ (Figure 6). The potential physical mechanisms that can explain the overlap in this region are discussed in details in section 5.
4. Dynamic Modeling of Earthquake Sequences
The analysis in section 3 is based on the analytical formulation derived from the equation of motion of a 1 degree of freedom spring-and-slider system. It may be too simplistic, in particular, because it ignores the inter-actions between neighboring patches due to elastic stress transfer. In addition, the analysis does not provide any insight on the properties of the VW patch that governs the characteristics of the seismic events, including the coseismic stress drop and their return period. We therefore carry out numerical fully dynamic simula-tions of earthquake sequences and slow slip to qualitatively reproduce the wide range of observasimula-tions for the southern segment of the LVF. The model setup is designed based on the kinematic model summarized in Figures 1 and 3. We follow an approach similar to that of Barbot et al. [2012] who developed a model calibrated to reproduce the earthquakes sequences and slow slip on the Parkfield segment of the San Andreas Fault. As discussed by Thomas et al. [2014b], a quasi-dynamic approximation would be less costly but the inferences made could be biased. We therefore conduct only fully dynamic simulations.
4.1. Modeling Approach
Our simulations are conducted using the BICycle (Boundary Integral Cycles of Earthquakes) program based on the methodological developments by Lapusta et al. [2000], Lapusta and Liu [2009], and Noda and Lapusta [2010]. The computational approach uses a boundary-integral method in the Fourier domain that allows to concomitantly model slow (interseismic, postseismic, and nucleation) and fast (coseismic) fault slip. The model
Figure 6. Postseismic (a) dip-slip and (d) strike-slip distribution of slip rates determined from the inversion of cGPS and creepmeter time series, leveling data,
and permanent scatters. Black curves show contour lines of coseismic slip distribution. (b and e) Changes in Coulomb stress (ΔCFF= Δ𝜏 + 0.6Δ𝜎) due to the coseismic model by Thomas et al. [2014a] for the rake of 90∘and 0∘, respectively. (c and f ) The corresponding frictional parameters(a − b)̄𝜎predicted from the velocity-strengthening friction law (equation (5)). Only patches that show both accelerated creep after the Chengkung earthquake and a positive Coulomb stress change were selected.
assumes a planar thrust fault segment embedded into a uniform, isotropic, elastic medium, loaded at the average long-term slip rate on the fault (5 cm/yr) and governed by the rate-and-state friction laws. The method does not allow to include the free surface for thrust faults or complex geometry, but their effects are partially incorporated by defining the effective normal stress distribution with depth. To account for the listric shape of the LVF, the z axis of the models corresponds to distance along dip, hereafter referred as the “equivalent depth” (zeq), rather than the “true” depth z of our model:
zeq= −0.008z2+ 0.999z − 0.292, (7)
where z and zeqare in kilometers.
Slip evolution is controlled by the fault frictional properties and the effective normal stress distribution. Here we assume that a patch with VW friction (a−b< 0), where seismic slip can nucleate, is embedded in a VS area. We explore the response of two kinds of models, with different distributions of the effective normal stress (Figure 7) and (a − b) with depth.
Figure 7. Effective normal stress distribution
assumed for the kinematic analysis (blue curve, hydrostatic pore pressure), for the model A (green) and the model B (red, dotted line).
In model A, the effective normal stress increases with depth according to the following:
̄𝜎 = zeq(𝜌g (1 − 𝜆)) . (8)
This distribution follows the listric shape of the LVF and corre-sponds to fluid overpressure of𝜆 = 0.86. Note that the kine-matic modeling is interpreted in section 3 using a higher effective normal stress corresponding to hydrostatic pore pressure. However, our dynamic modeling shows that such high values would be incompatible with the experimental measurements of rock friction, as discussed in the following. Furthermore, they are difficult to explore numerically, as they result in small cohesive zone sizes at the rupture tip for the typical values of the rate-and-state parameter b [Liu and
Lapusta, 2008], requiring spatial resolution that would prevent
the 3-D modeling presented here. The frictional properties of the VS area vary smoothly for simplicity, as the point of the model is to simulate the large-scale features of the fault behavior. Based on the kinematic study of section 3, we apply the value of a − b = 0.0066 in the VS zone bordering the VW patch and increase it to a − b = 0.01 farther away from the patch, including near the surface (Figure 8a). The transition from velocity weakening to velocity strengthening is assumed smoother at depth, to potentially favor overlap of seismic and aseismic slip. The spatial distribution of (a − b) used in this dynamic model A in VS areas is similar to the kinematic analy-sis, but (a−b)̄𝜎 is smaller (Figure 8b). The values of (a−b) in the VW patch are constrained by the dynamic modeling and its comparison with the seismic history, as discussed in the next section.
Model B puts together the inferences of (a − b)̄𝜎 from the kinematic model for the VS areas and from dynamic model A for the VW patch with the simplest effective normal stress distribution that makes the resulting values of (a − b) correspond to the laboratory measurements reported in Figure 5d. It turns out that the suitable effective normal stress distribution follows the overburden minus hydrostatic pore pressure to 11 km depth and then stays constant at ∼150 MPa (Figure 7). Such an effective stress distribution, which implies increasing fluid overpressure with depth, has been advocated for a number of fault zones [Suppe, 2014].
In both models, the reference friction coefficient f0= 0.6 is constant over the fault; the choice of f0only affects the average stress level on the fault. The prestress𝜏0is assumed to be equal to the steady state value at plate rate, except for one location where𝜏0is slightly increased over a 1 × 1 km2patch, at the right bottom boundary
between the VS and VW regions. This setup promotes the nucleation of the first event. More details about the elastodynamic relations and the constitutive laws can be found in Thomas et al. [2014b] and in Lapusta and
Liu [2009].
4.2. Constraining Properties of the Velocity-Weakening Region
The rate-and-state parameters of the velocity-weakening region are constrained using dynamic model A (Figure 8); they are adjusted to reproduce approximately the seismic kinematic observations, based on the analysis presented in the previous section. Note that the seismogenic region is represented in the model by the standard logarithmic rate-and-state friction (section 3.1) only; this is a convenient conceptual frame-work that allows us to reproduce seismic events with realistic slip rates, rupture speeds, and stress drops and hence to study the interaction between seismic and aseismic slip [e.g., Barbot et al., 2012]. However, ample experimental evidence indicates that enhanced coseismic weakening may be acting during fast seismic slip, e.g., due to shear heating Platt et al. [2014]. In fact, our estimates of shear heating (section 5) indicate that dynamic friction coefficients of the order of 0.1 or lower are needed to avoid wholesale melting of the shear-ing layer, which would indicate significant weakenshear-ing from the typical rate-and-state friction coefficients of
Figure 8. Fault model A and simulations of earthquake sequences, with gradual transition of (a − b) at depth. (a) Variation of the rate-and-state parameter (a − b). (b) Along-dip variation of(a − b)̄𝜎. For Figures 8a and 8b the blue, red, and black curves correspond, respectively, to the kinematic analysis (swath A2), the dynamic model, and the laboratory experiment [den Hartog et al., 2012]. (c) Catalogue of simulated seismic events. (d and e) Cumulative slip on the fault for two depth profiles, one in the middle of the fault (Figure 8e) and one on the left side (Figure 8d). See Figure 8b for the locations. Red lines are plotted every 2 s when the maximum slip velocity on the fault exceeds 1 mm/s, while blue lines plotted every 5 years illustrate the aseismic behavior of the fault. The slip is plotted on the fault after the first large (Mw> 6.5) event for both profiles.
0.6. Even at such lower dynamic resistance, the temperatures are still predicted to increase by several hun-dreds of degrees, making shear heating mechanisms such as flash heating and thermal pressurization of pore fluids [e.g., Rice, 2006] quite plausible. If the melting is allowed to occur, that itself would result in significant weakening [Platt et al., 2014]. The effects of the enhanced coseismic weakening, which can also act in the velocity-strengthening areas [Noda and Lapusta, 2013; Jiang and Lapusta, 2016], on the interaction between seismic and aseismic slip need to be more fully examined. In this work, as the first step of building a fully dynamic model and exploring basic seismic/aseismic slip interactions, we use the standard rate-and-state friction only.
The choice of the characteristic slip L is governed by the following consideration. The kinematic model displays uneven slip accumulation along sections A2 and A3 (Figure 3), suggesting a somewhat more com-plicated earthquake sequence than the repetition of Chengkung-like earthquakes. Relatively large value of the rate-and-state nucleation size, compared to the size of the VW patch, prevents generating smaller size earthquakes; the nucleation size is given by the following:
h∗= 𝜋
2
G∗bL
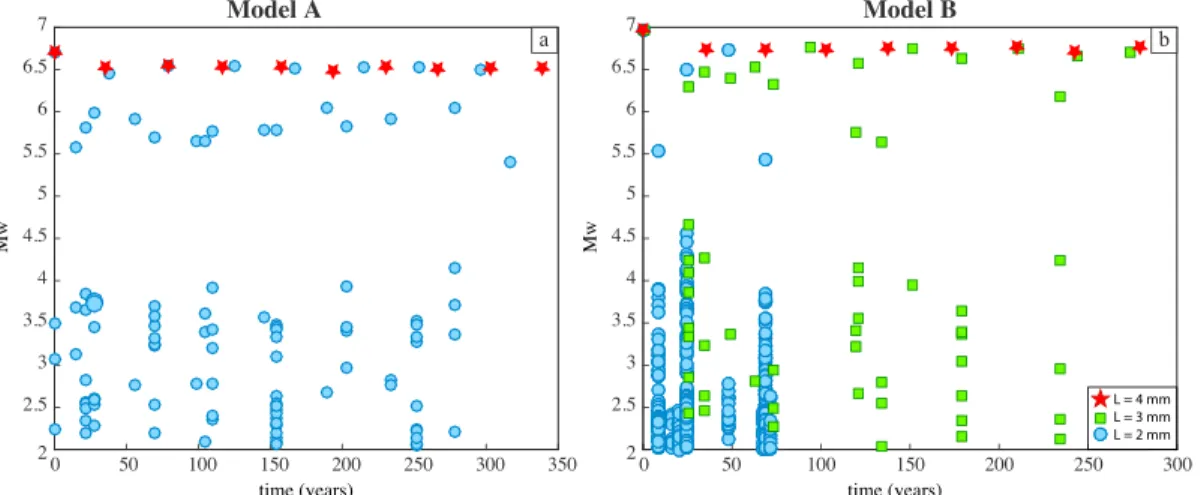
Figure 9. Catalogue of simulated seismic events for numerical models sharing the same set of parameters other than
the characteristic slipL. (a) Numerical models of type A. For these two models,(a − b) = −0.005in the VW patch. (b) Numerical models of type B. For these two models,(a − b) = −0.0035in the VW patch. Red stars correspond to the models withL = 4mm, the green squares, to the model withL = 3mm, and the blue dots represent the models with
L = 2mm. The simulation withL = 2mm for model B is run for a shorter time, due to the numerical expense of simulating multiple small events.
where G∗is equal to the shear modulus G for mode III and G∕(1 −𝜈) for mode II [Rubin and Ampuero, 2005;
Lapusta and Liu, 2009]. Therefore, given the distribution of (a − b) and effective normal stress, one can choose
the value of L to introduce some complexities. Note that L cannot be too small for the problem to be numer-ically tractable. For L = 4 mm, the dynamic model predicts a relatively simple earthquake sequence with the quasiperiodic return of similar earthquakes, rupturing the whole VW patch (Figure 9). A lower value of
L = 2 mm allows for more complexity and more diversity in the slip distributions (Figures 8d and 9). This
choice yields a nucleation size h∗varying from 400 m to 5.0 km in the VW patch, depending on the depth.
The frictional parameter (a − b) within the VW zone is adjusted so that ruptures of the whole patch would produce Mw6.7 earthquakes with a return period comparable to our estimate of the return period of the Chengkung-type earthquake on the LVF, i.e., 34 years based on the kinematic study or 36 years based on the seismic catalog [Thomas et al., 2014a]. The return period T can be estimated as [Barbot et al., 2012]:
T = (b − a) ̄𝜎W GVr ln(Vco Vint ) , (10)
where W = 12 km is the width of the VW patch, G is the shear modulus (30 GPa), Vco= 1 m/s is the coseismic
slip velocity, Vint= 10−10m/s is the interseismic velocity and V
r= 50 mm/yr is the long-term velocity inferred
from the kinematic inversion. If we take a mean value of 75 MPa for the effective normal stress, equation (10) suggests that (a−b) = −0.005 should correspond to the observed T of ∼ 35 years. This is indeed what we find in a simulation with L = 4 mm, yet the return period of Mw> = 6.5 events increases by ∼23% for the case with
L = 2 mm. Note that equation (10) does not depend on L; it was derived assuming that the recurrence interval
is controlled by the time needed to reload the entire fault segment by the representative stress drop, as an approximation to provide general guidance for parameter selection. However, the recurrence period is also controlled by nucleation: a smaller nucleation size leads to more frequent nucleation attempts (with some of the required stress increases for rupture propagation reached due to dynamic stress transfers) as well as more complexity and diversity in the slip distributions and magnitude of events. This is indeed what we observe for
L = 2 mm. In addition to the larger recurrence time of MW= 6.5 events than for the case with L=4 mm, the
model produces largest events of smaller magnitude, Mw= 6.5 instead of 6.7, as well as a range of additional
much smaller events. To reach the right magnitude and recurrence time of the largest events in the simulation, we decrease (a − b) to −0.0075.
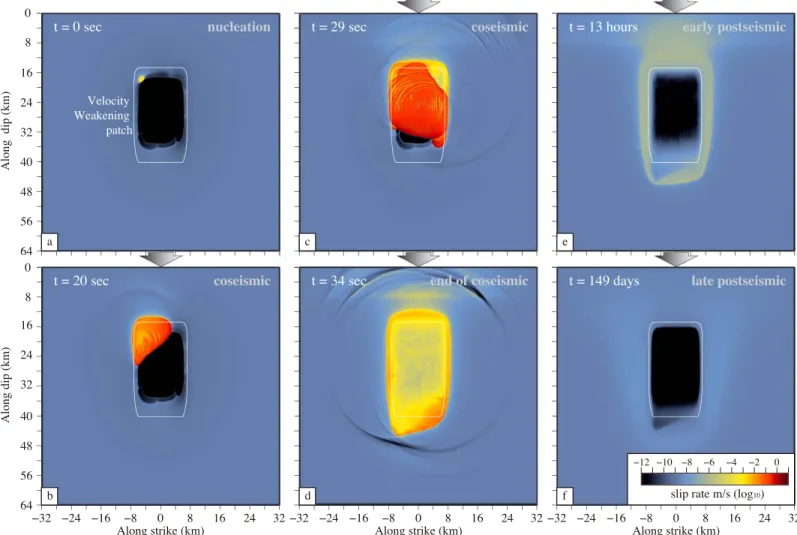
Figure 10 displays the simulation of one Mw6.6 earthquake (event 5 in Figure 8e) that includes the nucleation
at the transition between the locked patch and the creeping section, followed by the downdip propagation of the seismic event. The scenario also displays the early stage of accelerated creep during the postseismic period which emphasize the dual seismic/aseismic behavior that sections on the fault might undergo.
Figure 10. Slip velocity snapshots for aMw6.6 earthquake (event 5 in Figure 8e). Rupture nucleates spontaneously at the transition between the locked patch and the creeping section, propagates downdip, rupturing the whole VW patch, and is followed by a postseismic phase.
To summarize, the model with a VW patch of (a − b) = −0.075 and L = 2 mm leads to an average return period of 34.8 years for the largest events ranging from Mw6.6 to 6.7 (Figure 8c). The model also allows the rupture to propagate downdip in the VS area but less so at shallow depth where the transition from VW to VS is more abrupt. We do note that some earthquakes occasionally rupture all the way to the surface (event 7 in Figure 8e), as it may have happened on the Longitudinal Valley Fault in 1951 [Shyu et al., 2007]. We cau-tion that this propagacau-tion all the way to the free surface is facilitated by the lower values of (a − b)̄𝜎 in this model compared to the kinematic estimates. Model B, which incorporates the kinematic values, does not show such propagation. However, it also does not incorporate properly the free surface, which would promote near-surface rupture [Kozdon and Dunham, 2013].
Lastly, the distribution of the frictional parameters together with a diversity in the coseismic events (Mw rang-ing from 2.2 to 6.9) leads to a complex creeprang-ing pattern, with variable creeprang-ing rates similar to the kinematic model described in section 2. We discuss this pattern further for model B in section 4.4.
4.3. Verification of the Kinematic Approach to Estimate(a − b) ̄𝝈 in VS Areas
The dynamic models can be used to evaluate the analytical approach described in section 3 that allows to estimate the (a − b)̄𝜎 parameters of the creeping sections of the LVF (Figure 5). To test the analytical approach, we first extract the time series of slip displacement on the simulated fault at two locations in the VS zone (Figure 11), patch VSM at 15 km depth in the middle of VS and patch VSU is the upper creeping section right above the locked patch (at 3.5 km depth). We then infer the parameter (a − b)̄𝜎 or, equivalently using the known ̄𝜎 from the model, the friction property (a − b) that would allow to match quantitatively the observed postseismic relaxation based on equations (5) and (6) for seven earthquakes of Mw ≥ 6.3. We
esti-Figure 11. Time series of fault slip derived from our best dynamic model for points (a) VSU and (b) VSM (see esti-Figure 8a
for location). Accumulation of slip with time is plotted for seven events ofMw≥ 6.3(red), with 2.5 years of presesimic slip (blue) and 2.5 years of postseismic slip (green). Black curves correspond to the fit of the retrieved time series, following the relaxation law as described in Perfettini et al. [2010] (equation (5)). Mean derived(a − b)value and relaxation timetr, with their corresponding standard deviation, are given for the two points.
mate (a − b) = 0.0064 ± 0.0011 and (a − b) = 0.0068 ± 0.0024 for patches VSM and VSU, respectively, with the known input values of 0.0066 and 0.005. For both patches, the analytical approach returns values compa-rable to the assigned ones, with a better fit for the VSM patch. The discrepancy, which approaches 35% in the VSU patch, is likely due to the assumptions of the analytical approach, which (1) considers two steady state conditions on the fault to relate the earthquake-induced stress change to the resulting postseismic slip through (a − b) only and (2) ignores any stress transfers due to spatially inhomogeneous postseismic slip. However, in general, a fault segment may not be in steady state at the time of the stress perturbation due to earthquake, especially for patches like VSU that records both aseismic and seismic displacement. Furthermore, the postseismic slip would be largest in the areas closest to the earthquake, decaying away from the earthquake, and that would result in stress transfers and postseismic slip propagation [e.g., Jiang and
Lapusta, 2016]. In our fully dynamic simulations, both effects are present. Such simulations can help devise
better estimation techniques for rate-and-state parameters based on postseismic slip, especially in regions of seismic/postseismic slip overlap.
4.4. Dynamic model B Consistent With Kinematic Estimates
The dynamic modeling of section 4.2 established that the average values of (a − b)̄𝜎 in the VW patch that reproduce the observed seismic behavior of the LVF are about −0.4 MPa. If the overburden minus hydrostatic pore pressure is assumed for the effective normal stress distribution, such values of (a−b)̄𝜎 would correspond to the values of (a−b) which are an order of magnitude smaller than the experimental measurements reported in Figure 5. At the same time, reducing the effective normal stress everywhere, as done in model A, while keeping the values of (a−b) similar to the laboratory ones, results in values of (a−b)̄𝜎 in the shallow VS region of model A which are much smaller than our kinematic estimates.
This suggests that the effective stress in the shallow depth indeed follows the overburden minus hydro-static pore pressure but becomes smaller than that in the deeper portions of the fault. The simplest such distribution would make the effective normal stress constant below a certain depth. This is exactly what we assume in model B (Figure 7). The corresponding depth distribution of (a − b) is computed to match the kinematic/dynamic estimates of (a − b)̄𝜎 for the VS/VW areas from sections 3 and 4.2, respectively. The result-ing distribution of (a − b) is a close match for the laboratory measurements in the shallow VS and in the VW regions (Figure 12). In the deeper VS region, these kinematically based values of (a − b) are lower than the experimental measurements. (An alternative model, which can be explored in future work, would assume the laboratory-based values of (a − b) in the deeper velocity-strengthening region as well and adjust the effective normal stress there to very low values consistent with the near-zero kinematic values of (a − b)̄𝜎, implying even more severe fluid overpressure at larger depths.)
Model B successfully reproduces the seismic observations for the LVF (Figures 9 and 12). With a VW patch of (a − b) = −0.0035 and L = 3 mm, it leads to an average return period of 34.2 years for the largest events ranging from Mw6.5 to 6.9. The model also features more small events for smaller values of L and fewer smaller
events for large values of L, with the corresponding effects on the recurrence period of the largest events, as discussed for model A (Figure 9). Consistently with the higher values of (a − b)̄𝜎 near the free surface in this
Figure 12. Fault model B and simulations of earthquake sequences, with gradual transition of (a − b) at depth. (a) Variation of the rate-and-state parameter (a − b). (b) Along-dip variation of(a − b)̄𝜎. For Figures 12a and 12b the blue, red, and black curves correspond, respectively, to the kinematic analysis (swath A2), the dynamic model, and the laboratory experiment [den Hartog et al., 2012]. (c) Catalogue of simulated seismic events. (d and e) Cumulative slip on the fault for two depth profiles, one in the middle of the fault (Figure 12e) and one on the left side (Figure 12d). See Figure 12b for the locations. Red lines are plotted every 2 s when the maximum slip velocity on the fault exceeds 1 mm/s, while blue lines plotted every 5 years illustrate the aseismic behavior of the fault. The slip is plotted on the fault after the first large (Mw> 6.5) event for both profiles.
model compared to model A, the postseismic slip is reduced in those regions. The occasional propagation of large events to the free surface is also suppressed in this model, but the inclusion of true free surface would promote dynamic rupture, potentially allowing such propagation even for the higher (a−b)̄𝜎 values assumed in model B.
The overall pattern of preseismic and postseismic slip is well reproduced by model B, as illustrated by com-parison with the kinematic model for two cross sections (Figure S9). However, model B still fails to reproduce the observed overlap of seismic and aseismic slip.
5. Possible Causes of Seismic/Postseismic Slip Overlap
As mentioned in section 2, along fault section A2, significant aseismic afterslip is observed at the bottom of the rupture area of the Chenkung earthquake, which was ∼ 80% locked in the preseismic period (Figure 3). Similar overlap between coseismic and postseismic slip has also been observed for the Maule earthquake [Bedford et al., 2013]. However, with the frictional law used in our dynamic models, we cannot fully reproduce such feature. Seismic slip in the models is mostly restricted to the VW area of the model. The simulations do
produce aseismic slip within the VW area in the preseismic period, due to “erosion” of the locked zone, but they do not produce aseismic afterslip within the VW area during the following year (Figure 10).
We propose that the overlap in the VW area may occur due to shear heating-induced transient change of rate-and-state properties from VW to VS as discussed below. Some areas of the overlap between seismic and aseismic slip display a negative stress change ΔCFF. However, slip in the 2003 Chengkung earthquake may not have completely released the accumulated stress on the fault. In fact, in most dynamic models, including the ones presented here, only a fraction of shear stress is released due to a dynamic event (see Figure S10 in the supporting information). Hence, it is still possible to release stress by aseismic slip. In the areas of the negative ΔCFF, the overall frictional strength after the seismic slip would also need to be reduced, either due to increased fluid pressure or lower reference friction coefficient, so that the state of stress after the seismic slip would still be elevated with respect to the stress needed to slide at the plate rate, causing the elevated postseismic slip rates.
The dependence of quasi-static (slow-rate) friction properties on bulk temperature has been well estab-lished [He et al., 2007; Blanpied et al., 1991, 1995; King and Marone, 2012; den Hartog et al., 2012; Niemeijer and
Collettini, 2014; Verberne et al., 2014]. Typically, at high enough temperatures, the rate-and-state properties
transition from VW to VS, the feature often encapsulated in the depth dependence of friction properties as also done in our dynamic models. We hypothesize that such transition from VW to VS can also transiently occur within the VW region due to coseismic shear heating. The (rapid) coseismic shear heating is often invoked in conjunction with (rapid) enhanced coseismic weakening (section 4.2). However, there could be an addi-tional longer-term consequence, in the form of the evolution in the rate-and-state parameter (a − b) with heat diffusion.
We test the plausibility of this hypothesis by (1) considering two simplified estimates of the temperature changes induced by seismic slip of the 2003 earthquake and then (2) using laboratory studies to deter-mine the associated potential changes in (a − b). There is a lot of uncertainty in estimating relevant fault properties, but our goal is to see whether reasonable assumptions would lead to temperature changes of the order of several hundreds of degrees, as would be needed to affect a significant change in (a − b). Following Rice [2006], we assume that all dissipated energy turns into heat. This is an approximation, since some dissipated energy goes into creation of off-fault inelastic deformation such as damage [e.g., Froment
et al., 2014], as well as to creation of new surfaces within the shearing layer; we assume that dissipation due to
heat dominates.
To obtain the first estimate, we further assume that the heat is generated during uniform shear over a fault core of thickness h at the constant (dynamic) shear stress𝜏dand ignore the diffusion of heat; the change in temperature due to coseismic slip can then be computed as follows:
ΔTco(z) =𝜏d𝛿(z)
𝜌ch
, (11)
where𝜌cis the specific heat per unit volume and𝛿(z) is the amount of coseismic slip. We use a
representa-tive value of𝜌c≈ 2.7 MPa/∘C [Rice, 2006] and 𝛿(z) corresponding to the coseismic slip profile on section A2.
We take 12 km as a representative centroidal depth of the slipping area, which leads to an effective normal stress of ∼ 190 MPa, assuming a hydrostatic pore pressure and a rock density of 2700 kg/m3. There is a lot
of uncertainty in the dynamic resistance𝜏dand shear zone thickness h; the shear resistance can, in principle, vary from the one motivated by the friction coefficient of 0.6 to near-zero values due to thermal pressuriza-tion. Motivated by laboratory experiments at high slip rates, we use the dynamic friction coefficient of 0.1 [Wibberley et al., 2008], leading to𝜏d = 19 MPa. The shear zone thickness can be less than a millimeter
due to localization of shear slip within the gouge layer [e.g., Chester et al., 2004], and we consider such a case later. The upper estimate of the shear zone thickness is of the order of a centimeter, and we use
h = 2 cm here. Such a “thick” layer is also consistent with the assumption of negligible heat diffusion
during seismic slip [e.g., Rice, 2006]. The coseismic temperature change at 15 km depth is then given by (19 MPa × 0.79 m)/(2.7 MPa/∘C × 0.02 m) = 278∘C. As mentioned, there is a significant uncertainty in this esti-mate, but it shows that such temperature changes are plausible. If we use a narrower shear layer, or a higher coseismic friction coefficient, then this estimate of temperature change increases.
For the second estimate, we use the model of Rice [2006] of slip on a plane with thermal pressurization of pore fluids and off-fault diffusion of heat and fluids, targeting the regime in which the shear zone is much narrower
Figure 13. (a) Cumulative slip with depth on section A2 of the LVF, derived from kinematic inversion of geodetic data
[Thomas et al., 2014a]. Isochrons of preseismic and postseismic slip are plotted every year (blue), whereas red shading corresponds to the 2003 earthquake. (b) Evolution of temperature with time along the fault plane. The preseismic temperature distribution based on Simoes et al. [2007] (black dashed line) is added to the estimated temperature increase due to shear heating during the 2003 earthquake, resulting in the temperature distribution immediately after the earthquake (red line). Then the temperature evolves through off-fault diffusion of heat. (c) The corresponding evolution of rate-and-state parameter (a − b) with time. (a(T) − b(T)) is determined for each temperature profile, based on laboratory data [den Hartog et al., 2012]. Dashed line corresponds to the (a − b) profile before the event. (d) The corresponding extent of the VW zone with time.
than the 2 cm assumed in the first estimate. As shown in Rice [2006], for slips large relative to the characteristic weakening distance L∗defined in that work (which ranges from 1 to 50 mm for reasonable model parameters),
the temperature rise is determined by the initial (preseismic) effective normal stress, off-fault thermal and hydraulic diffusivity, and undrained pressurization factor, resulting in values of ∼300∘C or more for typical fault properties, depending on the assumption about hydraulic diffusivity, the most uncertain parameter. Hence, both estimates suggest temperature changes in the actively shearing layer of ∼300∘C or more. To estimate the effect of such temperature increases on the value of (a − b), we proceed with estimate (1), for simplicity. We compute the new temperature profile T(z, t = 0), where t = 0 corresponds to the time right after the cosesimic event, by adding ΔTco(z) to Tgeo(z), given by the local geotherm [Simoes et al., 2007]. Note
that this is not exactly correct as the local geotherm should be defined as the long-term average temperature. Finally, interpolating the laboratory results from den Hartog et al. [2012], we can determine a new (a−b) profile based on T(z, t = 0) (red curve in Figure 13b).
To approximately solve for the evolution of temperature over the postseismic period, we consider the off-fault heat diffusion. The energy equation can be written as follows [Carslaw and Jaeger, 1959]:
𝜕T(z, y, t) 𝜕t =𝛼th
𝜕2T(z, y, t)
𝜕y2 , (12)
where𝛼this the thermal diffusivity, taken to be 1.8×10⁻⁶m2/s [Eppelbaum et al., 2014]. We solve this equation
numerically, starting with T(z, y = 0, t = 0) = Tgeo(z) + ΔTco(z) and T(z, y, t = 0) = Tgeo(z), and using an
explicit finite difference method:
𝜕T(z, y, t) 𝜕t ≈ T(z, y, tn+1) − T(z, y, tn) tn+1− tn = T(z, y, tn+1) − T(z, y, tn) Δt (13) and 𝜕2T(z, y, t) 𝜕y2 = 𝜕𝜕y ( 𝜕T(z, y, t) 𝜕y ) ≈T(z, yi+1, t) − 2T(z, yi, t) + T(z, yi−1, t) (Δy)2 , (14)

![Figure 2. Time series of slip on the fault from the inversions of geodetic data over the period 1997–2010 [Thomas et al., 2014a, Figure 1]](https://thumb-eu.123doks.com/thumbv2/123doknet/14791259.601537/5.918.64.860.159.947/figure-time-series-inversions-geodetic-period-thomas-figure.webp)