HAL Id: insu-01713153
https://hal-insu.archives-ouvertes.fr/insu-01713153
Submitted on 20 Feb 2018HAL is a multi-disciplinary open access archive for the deposit and dissemination of sci-entific research documents, whether they are pub-lished or not. The documents may come from teaching and research institutions in France or abroad, or from public or private research centers.
L’archive ouverte pluridisciplinaire HAL, est destinée au dépôt et à la diffusion de documents scientifiques de niveau recherche, publiés ou non, émanant des établissements d’enseignement et de recherche français ou étrangers, des laboratoires publics ou privés.
evolution of the western Central Range and
Cenderawasih Bay (Indonesia)
Julien Babault, Marc Viaplana-Muzas, Xavier Legrand, Jean van den
Driessche, Manuel González-Quijano, Simon Mudd
To cite this version:
Julien Babault, Marc Viaplana-Muzas, Xavier Legrand, Jean van den Driessche, Manuel González-Quijano, et al.. Source-to-Sink constraints on tectonic and sedimentary evolution of the western Central Range and Cenderawasih Bay (Indonesia). Journal of Asian Earth Sciences, Elsevier, 2018, 156, pp.265-287. �10.1016/j.jseaes.2018.02.004�. �insu-01713153�
Source-to-Sink constraints on tectonic and sedimentary evolution of the western Central Range and Cenderawasih Bay (Indonesia)
Julien Babault, Marc Viaplana-Muzas, Xavier Legrand, Jean Van Den Driessche, Manuel González-Quijano, Simon M. Mudd
PII: S1367-9120(18)30044-0
DOI: https://doi.org/10.1016/j.jseaes.2018.02.004
Reference: JAES 3410
To appear in: Journal of Asian Earth Sciences Received Date: 28 March 2017
Revised Date: 30 January 2018 Accepted Date: 4 February 2018
Please cite this article as: Babault, J., Viaplana-Muzas, M., Legrand, X., Van Den Driessche, J., González-Quijano, M., Mudd, S.M., Source-to-Sink constraints on tectonic and sedimentary evolution of the western Central Range and Cenderawasih Bay (Indonesia), Journal of Asian Earth Sciences (2018), doi: https://doi.org/10.1016/j.jseaes. 2018.02.004
This is a PDF file of an unedited manuscript that has been accepted for publication. As a service to our customers we are providing this early version of the manuscript. The manuscript will undergo copyediting, typesetting, and review of the resulting proof before it is published in its final form. Please note that during the production process errors may be discovered which could affect the content, and all legal disclaimers that apply to the journal pertain.
Source-to-Sink constraints on tectonic and sedimentary evolution of the western
Central Rangeand Cenderawasih Bay (Indonesia)
Julien Babaulta, Marc Viaplana-Muzasb, Xavier Legrandc, Jean Van Den Driessched, Manuel González-Quijanoe, Simon M. Muddf
a
LFCR, Université de Pau et des Pays de l'Adour, 64013 Pau Cedex, France (Corresponding author), [email protected]
b
Group of Dynamics of the Lithosphere, Institute of Earth Sciences Jaume Almera ICTJA – CSIC, Lluís Solé i Sabarís s/n, 08028, Barcelona, Spain. [email protected], [email protected]
c
Petronas CariGali, Twin Tower KLCC, 50088, Kuala Lumpur, Malaysia. [email protected]
d Univ Rennes, CNRS, Géosciences Rennes - UMR 6118, F-35000 Rennes, France.
e
Repsol Exploration, Jakarta, Indonesia. [email protected]
f School of GeoSciences, University of Edinburgh, Drummond St., Edinburgh EH8
Abstract
The island of New Guinea is the result of continent-arc collision that began building the island’s Central Range during the late Miocene. Recent studies have shown that rapid subduction, uplift and exhumation events took place in response to rapid, oblique convergence between the Pacific and the Australian plates. The tectonic and sedimentary evolution of Cenderawasih Bay, in the northwestern part of the New Guinea Island is still poorly understood: this bay links a major structural block, the Kepala Burung block, to the island’s Central Ranges. Previous studies have shown that Cenderawasih Bay contains a thick (> 8 km) sequence of undated sediments. One hypothesis claims that the embayment resulted from a 3 Ma opening created by anticlockwise rotation of the Kepala Burung block with respect to the northern rim of the Australian plate. Alternatively, the current configuration of Cenderawasih Bay could have resulted from the southwest drift of a slice of volcanics and oceanic crust between 8 and 6 Ma. We test these hypotheses using i) a geomorphologic analysis of the drainage network dynamics, ii) a reassessment of available thermochronological data, and iii) seismic lines interpretation. We suggest that sediments started to accumulate in Cenderawasih Bay and onshore in the Waipoga Basin in the late Miocene since the inception of growth of the Central Range, beginning at 12 Ma, resulting in sediment accumulation of up to 12200 m. This evidence is more consistent with the second hypothesis, and the volume of sediment accumulated means it is unlikely that the embayment was the result of recent (2-3 Ma) rotation of structural blocks. At first order, we predict that infilling is mainly composed of siliciclastics sourced in the graphite-bearing Ruffaer Metamorphic Belt and its equivalent in the Weyland Overthrust. Ophiolites, volcanic arc rocks and diorites contribute minor
proportions. From the unroofing paths in the Central Range we deduce two rates of solid phase accumulation (SPAR) since 12 Ma, the first one at a mean SPAR ranging between 0.12-0.25 mm/a with a maximum SPAR of 0.23-0.58 mm/a, and the second during the last 3 Ma, at a mean SPAR ranging between 0.93-1.62 mm/a and with a maximum SPAR between 2.13-3.17 mm/a, i.e., 6700-10000 m of Plio-Pleistocene sediment accumulation. Local transtensional tectonics may explain these unusually high rates of sedimentation in an overall sinistral oblique convergence setting.
Keywords: source-to-sink, drainage reorganization, river capture, seismic
interpretation, volume balance, accumulation rate, sediment composition, subsidence, transtension
Highlights:
Eroded volumes, combined with inferred sediment flux rates, imply sediments started to accumulate 12 million years ago in Cenderawasih Bay.
The main source of sediments in Cenderawasih Bay is the Ruffaer Metamorphic Belt. 55-82% of the eroded volume has been removed during the last 3 million years.
Combining sediment volumes, flux rates and seismic information we infer that Plio-Pleistocene sediments are ~6-10 km thick.
These unusually high rates of sedimentation suggest transtensional tectonics in Cenderawasih Bay.
1 Introduction
The geology of South East Asia is the result of interactions of small blocks jammed between the Eurasian, Australian and Pacific plates. At the northern rim of the Australian plate, the Central Range of the island of New Guinea is considered as a type-example for island arc-continent collision (Baldwin et al., 2012; Cloos et al., 2005; Cooper and Taylor, 1987; Davies, 2012; Dewey and Bird, 1970; Kulig et al., 1993; McCaffrey, 1996). One of the main characteristics of the geology of SE Asia is that relative plate velocities are fast, on the order of tens of kilometers up to one hundred kilometers per million years (DeMets et al., 1994; DeMets and Stein, 1990; Scotese et al., 1988; Stevens et al., 2002). Consequently, associated uplift, erosion and sedimentation rates are also rapid as evidenced by well-preserved transient landscapes and rapidly subsiding and filling sedimentary basins. In the NE part of the island of New Guinea, Plio-Pleistocene marine sediments have been uplifted to ~2500 m a.s.l. (Abbott et al., 1997) and Late Miocene shelf marine limestones now outcrop at >4500 m a.s.l. in the western highlands of the Central Range, testifying to recent and rapid surface uplift (Cloos et al., 2005). Relatively fast surface and deep processes have given rise to the formation of young, rapidly subsiding sedimentary basins with high rates of sediment accumulation. In the western part of the island, Cenderawasih Bay holds a thick sequence of late Cenozoic clastic sediments (Decker et al., 2009; Hamilton, 1979; Kingston, 1988; Sapiie et al., 2010; Visser and Hermes, 1962). Despite some petroleum exploration, the tectonic evolution of the bay, the origin of the clastic sediments, their composition, and reservoir potential remain unknown.
The origin of Cenderawasih Bay has been related to the Kepala Burung (Bird’s Head) tectonic evolution over the years. At present, the Bird’s Head block is coupled to the Pacific Plate and is moving rapidly away from the Australian plate along the Tarera/Aiduna Fault (Figure 1) (Bock et al., 2003; McCaffrey, 1996; Michel et al., 2001; Puntodewo et al., 1994; Rangin et al., 1999; Stevens et al., 2002). On the basis of the triangular shape of Cenderawasih Bay, which opens to the North, and on GPS-derived Kepala Burung motion, the embayment has been interpreted as resulting from a triangular pull-apart that would have been associated to 30-40º counterclockwise rotation of the Kepala Burung since 5 Ma (Charlton, 2000; Charlton, 2010), implying angular velocities in the range of 6º/Ma to 8º/Ma.
In contrast, based on stratigraphic similarities it has been suggested that the Kepala Burung area and Lengguru area have been part of the north Australian passive margin since the Permian and that before the Neogene collision it was located not far from its present position (Dow and Sukamto, 1984, 1986). Following this argument, Dow and Sukamto (1984) proposed that the geometry of the crust of Cenderawasih Bay would have mostly remained unchanged since the collision, with no need for 30-40º of counterclockwise rotation of the Kepala Burung block. These authors consider that only the geometry of its southern margin, the Weyland Overthrust, would have been modified when it was thrust 25-km-southward (Figure 1). François at al. (2016) dated this southwestward drift as Late Miocene (6-8 Ma). This movement would have been accommodated by strike-slip faults on the eastern and western margins of the bay, with right-lateral strike-slip movement in the Wandamen peninsula and left-lateral strike-slip movement in the Waipoga area (Figure 1)(Dow and Sukamto, 1984). This model is supported by seismic evidence of modern strike-slip motion in the
southwestern (right-lateral) and eastern (left-lateral) margins of the bay (Cloos et al., 2005; Pubellier and Ego, 2002; Stevens et al., 2002).
Our study focuses on the western island of New Guinea (Irian Jaya) including the western Central Range. We use a source-to-sink approach to shed light on the tectonic evolution of Cenderawasih Bay and the Kepala Burung block. Our results are based on a comparative study of the amounts of sediments in the Waipoga Basin, which includes Cenderawasih Bay and the Waipoga Trough, and of the amounts of clastic outflux coming from the main source catchments that fed the basin. We then use these results to derive the infilling composition and sedimentation rates. We estimate the eroded volumes in the Central Range using a geomorphic analysis of drainage dynamics, and published erosion rates. We estimate the counterpart volume of sediments deposited in Cenderawasih Bay and the evolution of the deep-sea routing system from seismic line interpretations and high-resolution bathymetry analysis. We finally discuss the implications of our sedimentary balance in term of tectonic evolution of the region and of sedimentation rates and infill composition of the Waipoga Basin.
2 Geological setting
2.1 Main geological features of the western Central Range
The Central Range extents along all the island of New Guinea (Irian Jaya), it is 1300 km long and 150 km wide. The chain is a result of strong oblique convergence between the Pacific and Australia plates at 95 mm/a over a period of several tens of millions of
years before the Pliocene (DeMets et al., 1994; DeMets and Stein, 1990). Since 3-5 Ma (Harbert and Cox, 1989, 1990; Pollitz, 1986) the relative motion of the Australian-Pacific plate has changed in azimuth, becoming more oblique with increased speed (Scotese et al., 1988) to its present 114 mm/a velocity (DeMets et al., 1994). Most of the left-lateral convergence is likely absorbed by the Tarera Fault Zone (Figure 1) (Bock et al., 2003; McCaffrey, 1996; Michel et al., 2001; Puntodewo et al., 1994; Rangin et al., 1999; Stevens et al., 2002). As a result, the Bird's Head block appears to be coupled to the Pacific Plate and this block is moving rapidly West South-West away from Australian plate. This involves subduction of the Bird’s Head lithosphere beneath the Seram trough. Some of the oblique convergence is absorbed by folding and thrusting, particularly within the western Central Range and the Mamberamo Basin (Abers and McCaffrey, 1988; Bock et al., 2003).
One of the main features of the western Central Range is the presence in its central part of a highly elevated plateau, the Kemabu Plateau, lying at ~3700 m a.s.l., and surrounded by steep flanks with jagged mountains (Figures 2A and 2B). Three main tectonometamorphic units define the western Central Range (Figures 1 and 2C): a fold-and-thrust belt (Irian Fold Belt) involving Proterozoic to Cenozoic sediments deposited on top of Australian passive margin, a metamorphic belt and oceanic rocks including ophiolite and volcanic arc assemblages. Late Neogene and Quaternary foreland sedimentary basins overlie continental Australian crust in the South (Arafura Basin) and ocean crust and volcanic arc assemblages in the North flank of the Central Range (Mamberamo Basin or North Basin which encompass the Meervlakte sub-basin). In the western part of the southern Arafura foreland basin, the Akimeugah Basin, clastic sediments (Buru Fm.) reach 6000 m in thickness (Hamilton, 1979; Kingston, 1988)
where it conformably overlays the New Guinea Limestone Group (Bär et al., 1961; Pigram and Panggabean, 1983)(Figure 2C). The New Guinea Limestone Group (Figure 3) contains the most recent sediments deposited across the undeformed Australian continental shelf from the Maastrichtian and Paleocene, until mid-Miocene (Cloos et al., 2005; Parris, 1994; Pieters et al., 1983; Quarles van Ufford, 1996).
To the North, in the south flank of the western Central Range, a 30-km-wide, 300-km-long, basement-cored anticline, called the Mapenduma anticline (Figures 1 and 2C), has been thrust 35 km southward above the Akimeugah foreland basin (Hill et al., 2004; Kendrick, 2000; Nash et al., 1993; Quarles van Ufford, 1996; Weiland and Cloos, 1996). It exposes Precambrian to early Paleozoic sediments and metasediments. Stratigraphically above and to the North, in the western Highlands or Kemabu plateau, the Jurassic-Cretaceous Kembelangan Group (Figure 3) and the New Guinea Limestone Group of the Australian passive margin are involved in a series of folds and thrusts (Irian Fold Belt, Figure 2C) with angular anticlines and rounded synclines (Kendrick, 2000). The kilometer-scale folds trend 120-130°N and are arrayed in echelon slightly oblique to the 100-110ºN trend of the Central Range (Granath and Argakoesoemah, 1989; Granath et al., 1991; Quarles van Ufford, 1996).
The northern flank of the western Central Range is mostly composed by the Ruffaer Metamorphic Belt (also called the Derewo Metamorphic Belt), trending EW over >500 km, and 10 to 30 km wide. It consists of pelitic rocks (Slate and Phyllites) containing graphite. The most widespread protoliths are Australian passive margin sediments (Kembelangan Group) metamorphosed under greenschist-facies conditions (Bär et al., 1961; Dow, 1977; Dow et al., 1988; Nash et al., 1993; Visser and Hermes, 1962; Warren
and Cloos, 2007). The northern edge of the Derewo Metamorphic Belt is bounded by a thrust fault that places the Irian Ophiolite Belt above the metamorphic rocks (Figure 1). The Irian Ophiolite Belt is interpreted as an exhumed slab of ocean lithosphere uplifted some 13 km and tilted 30º to the North (Davies, 1971; Weiland, 1999).
Volcanic rocks dated at 7.5 Ma and 2.5 Ma (Dow, 1968; Dow et al., 1986; McDowell et al., 1996; McMahon, 2000a, b; O'Connor et al., 1994; Page, 1975; Parris, 1994) and the related intrusive rock are exposed along the spine of the Central Range, commonly where the elevations are the highest (Cloos et al., 2005).
2.2 Geological features South and West of Cenderawasih Bay
Cenderawasih Bay is bounded to the south by the Weyland Overthrust where, from North to South, ophiolite slices, arc-type magmatic Middle Miocene diorite and high-grade metamorphic rocks have been thrust on top of the highlands fold belt (Dow et al., 1990; Dow et al., 1988; Dow and Sukamto, 1984). The Weyland Overthrust have been considered the equivalent of the Ruffaer Metamorphic Belt (Dow et al., 1988).
Cenderawasih Bay is bounded to the North by the E-W-trending, left-lateral slip Yapen-Sorong fault zone and to the South by the E-W-trending, left-lateral strike-slip Aiduna-Tarera fault zone (Figure 1) (Abers and McCaffrey, 1988; Bock et al., 2003; Charlton, 1996; Dow and Sukamto, 1984; Hamilton, 1979; Kreemer et al., 2000; Letouzey et al., 1983; McCaffrey, 1996; McCaffrey and Abers, 1991; Michel et al., 2001; Pubellier, 1999; Puntodewo et al., 1994; Stevens et al., 2002). The Yapen-Sorong fault zone has been the main boundary between Pacific and Australian plates during the Oligocene to the mid-Pliocene (e.g., Charlton, 1996; Hall, 1996; Hall and Wilson, 2000;
Lee and Lawver, 1995; Monnier et al., 1999; Packham, 1996; Pubellier et al., 2004; Struckmeyer et al., 1993). The region between the Weyland Overthrust and the western end of the Highlands is affected by recent transtentional tectonics involving normal faults and left-lateral strike-slip faults in the Paniai (PFZ) and Lowland (LFZ) regions (Figure 1) (Pubellier and Ego, 2002).
Farther West, the Lengguru fold-and-thrust belt, located in the west coast of Cenderawasih Bay (“the Bird’s Neck”), is made of southwest-verging linear folds and thrust faults that show a regular spacing of 10 to 20 km. Within this belt folds and thrust faults affect the Kambelangan group and the New Guinea Limestone Group. In the west coast of Cenderawasih Bay, the sedimentary cover of the internal part of the Lengguru prism has been unroofed and metamorphic rocks (eclogites, migmatites and amphibolites) crop out in the Wandamen Peninsula (Bailly et al., 2009; François et al., 2016). High angle north-south normal faults are connected to a low-angle detachment that has offset the metamorphic units. The occurrence of normal faults argues for ongoing roughly east-west extension (Bailly et al., 2009; McCaffrey, 1996; Pubellier, 1999; Pubellier and Ego, 2002; Stevens et al., 2002). Triassic to Lower Jurassic granites, east of the metamorphic units (Dow et al., 1988; Permana, 1998) are considered to belong to the upper plate, which constrains the location of a late Triassic subduction suture along the western shore of Cenderawasih Bay (Bailly et al., 2009).
2.3 Nature of the underlying crust of Cenderawasih Bay
The nature of the underlying crust of Cenderawasih Bay remains undetermined. However, high positive gravity values have been observed along the western and
northern coasts of the bay, positive values along the southwestern coasts (Visser and Hermes, 1962). The positive gravity values in the bay and the ultramafic rocks and/or island arc volcanics that have been reported in the surroundings of the bay (Weyland Overthrust and Ransiki volcanics) together argue for a crust made up of arc volcanics/oceanic crust beneath Cenderawasih Bay (Dow and Hartono, 1982). Alternatively, positive gravity values along the Wandamen peninsula may represent the signature of young metamorphic rocks instead of volcanics/oceanic crust (Baillie et al., 2003). These authors also suggest that gravity data could also be explained by an oceanic crust covered by a thick sequence of sediments.
2.4 Sedimentary sequences in the Waipoga Basin
2.4.1 Offshore (Cenderawasih Bay)
Multichannel seismic data reveal the presence of a very thick sequence of sediments in Cenderawasih Bay (Decker et al., 2009; Sapiie et al., 2010). These studies have recognized two sequences of sediments. The lower sequence is characterized by slightly chaotic reflectors. Sapiie et al. (2010) interpreted vertical offsets of reflectors in the western part of the basin as normal faults whereas Decker et al. (2009) interpreted these offsets as related to east-vergent reverse faults. Sapiie et al. (2010), as well as Decker et al. (2009), interpreted the lower sequence as syn- and post-rift passive margin sediments overlying a basement. This evidence led those authors to infer that the crust beneath the bay is most likely continental. As no well penetrates deeper than the Pleistocene in Cenderawasih Bay (Decker et al., 2009), this assertion remains to be demonstrated and it contrasts with the theory that the crust beneath Cenderawasih
Bay is of Pacific affinity (Dow and Hartono, 1982). Progressive fanning of the reflectors at the base of the upper sequence reflects a phase of rapid clastic sedimentation with an earlier phase of deepening of the basin followed by a sequence in which sedimentation exceeded subsidence and resulted in basin shallowing (Decker et al., 2009). The seismic profiles also show a NE-SW trending fold-and-thrust belt in the southeastern part of the bay close to the Waipoga Trough that appears to be active. Based on regional geology and a well (Tesoro H1, Figure 4) that does not reach the base of this upper sequence, the fold and thrust belt is considered to be Plio-Pleistocene in age (Decker et al., 2009). Compressive folding and thrusting in the upper sequence do not affect the lower sequence and the basement.
2.4.2 Onshore (Waipoga Trough)
Cenderawasih Bay is bounded to the southeast by the swampy Waipoga area, where Bouguer anomalies are very low (Figure 4) and that extends northeast and southwest of the swamps, parallel to the coast (Dow et al., 1986; Visser and Hermes, 1962). It corresponds to an elongated and very deep sedimentary basin referred to as the Waipoga Trough (Dow and Sukamto, 1984; Hamilton, 1979). According to Dow and Sukamto (1984) the minimum thickness of sediment in the trough is 8000 m. In the center of the Waipoga Trough, circular features in the swamps and kilometer scale vertical areas of no reflection on seismic profiles suggest the presence of mud volcanoes, leading Dow and Sukamto (1984) to suggest that a major NE-SW crustal fracture (Waipoga Fault), which has no surface expression in the Waipoga swampy area, controlled the development of the Waipoga Trough in the early stages of
mountain building. To the South, the Weyland Overthrust is bounded to the East by the NS Siriwo left-lateral, strike-slip fault that offsets both the Irian Ophiolites and the Ruffaer Metamorphic Belt (Figure 1). Dow and Sukamto (1984) considered that the Waipoga Fault and the Siriwo Fault define a major crustal left-lateral, strike-slip fault zone that accommodated a 25-km-southward displacement of the Weyland Overthrust, an interpretation supported by the seismic activity in the region (Cloos et al., 2005; Pubellier and Ego, 2002; Stevens et al., 2002).
2.5 Tectonic evolution of the western Central Range
According to Cloos et al. (2005), the sediments of the northern Australian passive margin overlying the transitional crust were involved in a precollision accretionary complex. They were subducted to the North at depths of 15–25 km in the late Oligocene and early Miocene (Warren, 1995). Clastic inputs in the Mamberamo Basin (Makats Fm.) and in the Iwur Basin (Iwur Fm.) containing metamorphic rocks (Visser and Hermes, 1962) show that shortening and thickening led to the local emergence and erosion of small islands near the modern international border in the Middle Miocene (~16-8 Ma) (Cloos et al., 2005; Quarles van Ufford and Cloos, 2005) and at least in the Late Miocene (~10 Ma)(Warren and Cloos, 2007). From about 12 Ma, the onset of widespread siliciclastic sedimentation replaced carbonate shelf sedimentation across the northern edge of the Australian platform, now exposed in the western Central Range (Dow, 1977). It indicates a substantial east-west elongated landmass had emerged and started to be eroded by that time, and it is accepted as the evidence
for the onset of the Central Range mountain building (e.g., Cloos et al., 2005; Visser and Hermes, 1962).
In Cloos et al.’s (2005) model, rock uplift of the Irian Ophiolites has resulted from underthrusting of the lower part of slope and shelf sediments of the Australian passive margin and thickening of the orogenic belt below the Ruffaer Metamorphic Belt/Irian Ophiolite boundary (Figure 2D). In the western part of the Ruffaer Metamorphic Belt, the underthrusted metamorphosed Australian continental margin sediments and crystalline basement have been buried to depths of 20-30 km (Warren, 1995; Warren and Cloos, 2007) at ~21 Ma (Weiland, 1999). The western part of the Ruffaer Metamorphic Belt has been exhumed slowly since the emergence of the island and until mid-Pliocene times, and then rapidly since 3 Ma (Weiland, 1999) (Figures 2A and 5). Field relations lead Warren and Cloos (2007) to suggest that part of the exhumation has been accomplished by normal faulting between the Ruffaer Metamorphic Belt and the Irian Ophiolites.
While the lower sequence of sediments of the Australian passive margin was underthrusted, a thick sequence of continental shelf deposits (New Guinea Limestone Group and Kambelangan Group) detached from its basement, and was deformed, leading to the kilometer-scale folds (Irian Fold Belt) outcropping in the highlands (Kemabu Plateau). In the south flank of the western Central Range, the 300-km-long, basement-cored Mapenduma anticline (Figure 1) has been thrusted to the South and exhumed well after 12 Ma during the late Miocene-Plio-Quaternary. The onset of motion on the Mapenduma thrust correlates with the change from fine-grained clastic sedimentation to coarse-grained clastic deposition in the southern Akimeugah
foreland basin (Buru Fm.) during the early Pliocene (Dow and Sukamto, 1984; Quarles van Ufford and Cloos, 2005; Visser and Hermes, 1962). Following Cloos et al. (2005), the onset of deformation of the Australian basement marks the beginning of subduction of the Australian continental lithosphere and the onset of the collisional orogeny. In the northern margin of the Akimeugah sedimentary basin, deformed Plio-Quaternary alluvial fans indicate recent thrust activity (Dow and Sukamto, 1984; Quarles van Ufford, 1996).
It has been proposed that the late Cenozoic intermediate calc-alkaline volcanism and related intrusives were the result of collisional delamination (Figure 2D) following arc-continent collision (Cloos et al., 1994; Cloos et al., 2005; McMahon, 1994a; Sacks and Secor 1990). Delamination would have started at 7 Ma and it would have triggered up to a maximum of 2500 m of surface uplift in the western Central Range at ca. 4 Ma as indirectly evidenced by coarsening of sediment in the Akimeugah foreland Basin at that time (Cloos et al., 2005).
Since 3 Ma, shortening ceased together with the onset of NW-SE extension in the Lengguru fold-and-thrust belt (Bailly et al., 2009) and shearing along the Tarera strike-slip fault zone (Pubellier and Ego, 2002). Rollback at the Seram Trench probably acted as a free border, triggering escape tectonics and giving an explanation to the Plio-Pleistocene extension observed in the Lengguru Fold-and-Thrust belt (e.g., Bailly et al., 2009).
3 Methods
Erosion dynamics and lithologies in the source catchments for the Waipoga Basin have controlled the sedimentation rates, the grain size and the composition of the clastic infilling. In order to investigate the sedimentation dynamics and clastic composition in the bay we studied the erosion dynamics of the drainage networks in the western Central Range and in the Weyland Overthrust. We analyzed the digital topography to derive geomorphologic indices of drainage dynamics. Based on these results and published erosion rates, we estimated the volumes of eroded rocks of respective lithologies. In the sedimentary basin we estimated the volume of sediments in the upper sequence of well-defined subparallel seismic reflectors described by Sapiie et al. (2010) and Decker et al. (2009) as being Plio-Pleistocene in age.
3.1 Geomorphic indices of drainage network dynamics
Our estimate of volumes of rock removed from the Central Range is based on the current geometry of the source drainage basins. Disequilibrium of erosion rates in adjacent drainage basins are known to trigger drainage divide migration that results in substantial modification of catchment size and of sediment provenance (e.g., Babault et al., 2012; Bonnet, 2009; Castelltort et al., 2012; Prince et al., 2011; Willett et al., 2014). We first analyzed the degree of disequilibrium of the drainage network in the western Central Range using a metric ( that integrates drainage area, from the base level, x, along the channel network (Perron and Royden, 2013; e.g., Royden et al., 2000). In our analysis, we used the digital elevation data at 3" resolution, available at http://viewfinderpanoramas.org/Coverage%20map%20viewfinderpanoramas_org3.ht
m. The main source of this DEM is SRTM but where SRTM data are void or anomalous, as it is the case in the deep valleys of the Central Range, there is input from GDEM, Landsat and various topographic maps. The index has been calculated taking into account the large differences of precipitation between the Kemabu Plateau in the highlands of the Central Range and the surrounding flanks (Figure 2B) following the method described in Yang et al. (2015).
eq. (1)
where m and n are constants, P is precipitation and A is the upstream drainage area. P0 and A0 are arbitrary scaling factors for the precipitation rate and drainage
area, respectively. We used the Tropical Rainfall Measurement Mission precipitation (http://www.geog.ucsb.edu/~bodo/TRMM/ (Annual rainfall)) calculated over 1998 to 2009 following the methods described in Bookhagen and Strecker (2008). Willett et al., (2014) demonstrated that disequilibrium in across drainage divides is suggestive of divide migration. This method assumes that rock strength (mainly controlled by lithology), rainfall and rock uplift rates are uniform in space and constant. We extracted for comparison the values of the proxy of the main catchments draining the southern flank, the Kemabu Plateau and the northern flank between 135ºE and 139ºE. Our values have been computed using a reference concavity value of 0.5 (Kirby and Whipple, 2012).
We also analyzed the local slopes from the DEM and regional slopes from the mean elevation calculated at crustal scale in a 30-km-diameter window (England and Molnar, 1990), and calculated the normalized steepness indices (Ksn) of the main rivers based
on -elevation plots to better constrain the geomorphic evolution of the western Central Range. Royden and Perron (2013) demonstrated analytically that instantaneous changes in uplift rates and spatially variable uplift rates result in linear segments of different slopes separated by knickpoints in -elevation plots. Their theory also predicts that if uplift and rock erodibility are uniform, transient signals propagating in rivers following the stream power equation plot fall in the same location in -elevation plot. Drainage network reorganization by drainage captures also induces kinks in -elevation plots (Willett et al., 2014) but they do not necessarily fall at the same location in -elevation plots (Whipple et al., 2017). We use this behavior in combination with the parameter to detect evidence of reorganization and potential disequilibrium in the drainage network. To estimate the concavity that best collapses the long profiles (main stem and its tributaries) in the -elevation plots we performed regressions of the long profiles following the method described in Mudd et al. (2014). In order to avoid regressions of step-like segments in the long profiles that correspond to artifacts generated by noisy DEMs, we used minimum segment length (msl) value sufficiently high (msl=25) and a total node (tn) value not to high (tn=90). We have visually checked that these values are optimal by varying msl from 10 to 35 in increments of 5 and by varying tn from 90 to 150 in increments of 20.
3.2 Eroded volume in the western Central Range
In order to give time constraints on the onset of the embayment, we estimated the eroded volumes in the catchments that drain the western Central Range and the Weyland Overthrust with outlets into Cenderawasih Bay. There are four main rivers
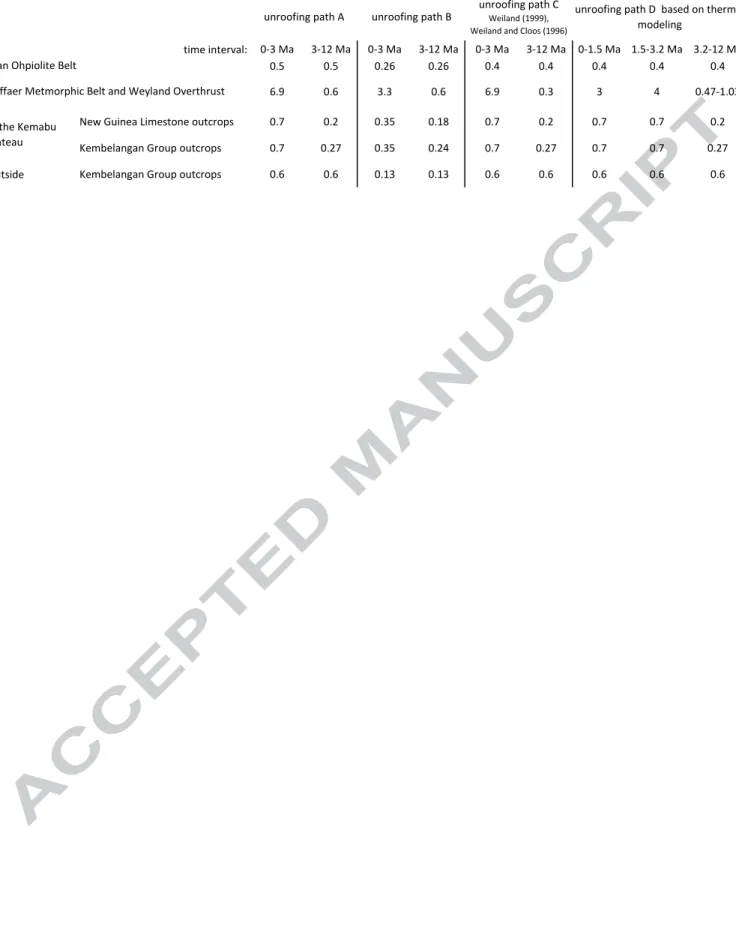
that feed clastics to the Waipoga Basin (Figure 4). Erosion rate data are sparse in the western Central Range and we extrapolated the scattered data to the whole extent of each tectonometamorphic unit in order to obtain an order of magnitude estimate of the eroded volumes. We used the erosion rates derived from thermochronological analysis (Weiland, 1999; Weiland and Cloos, 1996) and from burial depth estimated by petrological studies (Warren, 1995; Warren and Cloos, 2007; Weiland, 1999). The erosion rates for each tectonometamorphic unit that are available in the literature are summarized in figure 5. Based on these studies we calculated end-members for the history of erosion of each tectonometamorphic units, providing a range of possible erosion rates and the ensuing range of possible eroded volumes. We refer to the higher estimate as unroofing path A and to the lower bound as unroofing path B.
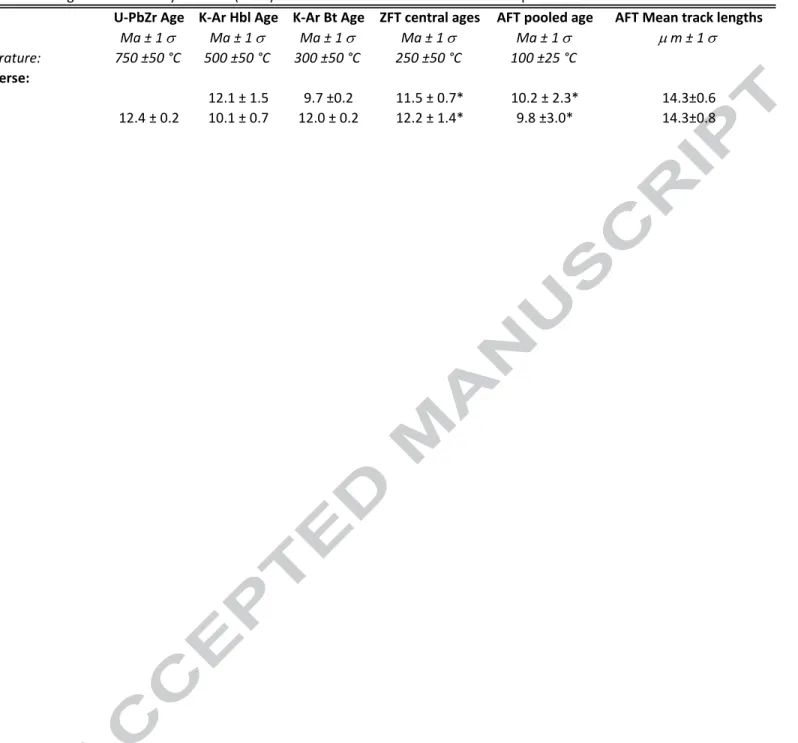
In the Irian Ophiolite Belt, erosion rates were derived from dating of intermediate composition arc rocks that intruded the ophiolites (Weiland, 1999). Different dating techniques using thermochronometers with temperature closures ranging from 750ºC to 100ºC have been applied to these samples giving ages between 9.7 and 12.4 Ma (Table 1). Weiland (1999) interpreted these ages as indicating that rapid cooling of the intrusion begin to slow after the samples passed through the closure temperature for apatite (~100 ±25 °C) at ~10 Ma. Assuming a paleogeothermal gradient of 25ºC/Km, Weiland (1999) deduced ~0.4 ±0.1 mm/a of erosion rate since 10 Ma. We extrapolated this value to the period 12 Ma to 10 Ma to calculate the volume of rocks eroded in the Irian Ophiolite Belt since the onset of building of the Central Range. Geothermal gradients calculated from wells drilled along the southern flank of the Central Range are between 23ºC/km, a value similar to that used by Weiland (1999), up to 38ºC/km (Kendrick, 2000). Applying this higher geothermal value decreases the erosion rate by
35% at 0.26 ±0.06 mm/a. We used the higher (0.5 mm/a) and lower (0.26 mm/a) bounds for unroofing path A and B, respectively. We also modeled the AFT and ZFT ages using QTQtR5.6.0 (Gallagher, 2012) to check the thermal history proposed by Weiland (1999).
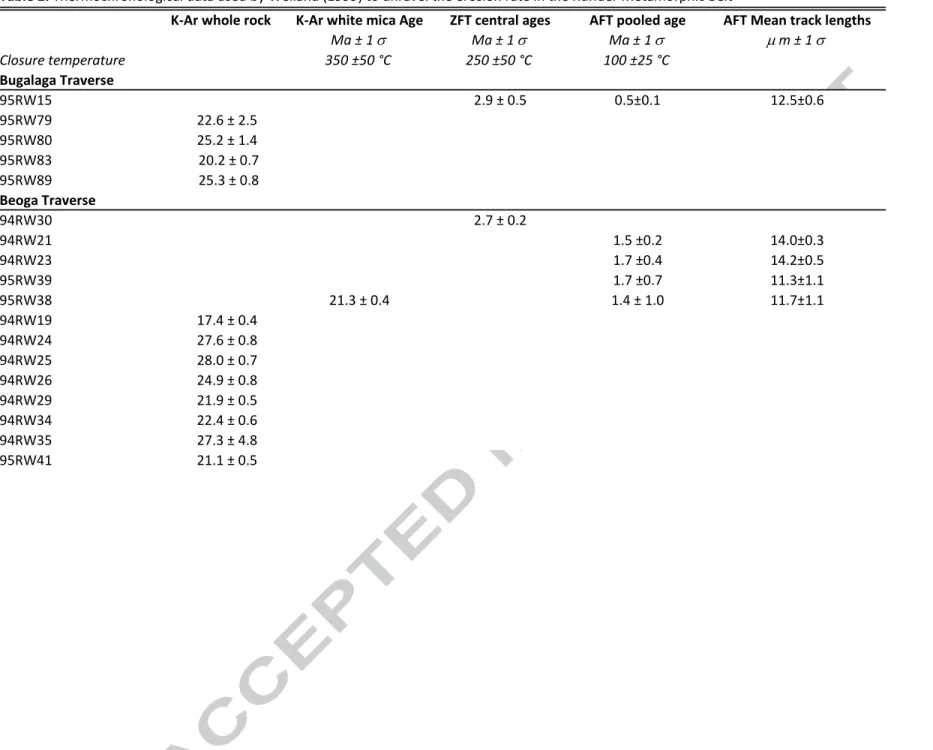
Mineral assemblages suggest that the rocks outcropping in the western part of the Ruffaer Metamorphic belt (Bugalaga and Beoga Traverses in figure 1 and 5A) have been buried to depths of 20 km (~5 kbar) to 30 km (~8 kbar), at temperatures of 250ºC and 350ºC, in the southern and in the northern part of the metamorphic belt, respectively (Warren, 1995; Warren and Cloos, 2007). These results imply a paleogeothermal gradient of 12ºC/Km (Warren and Cloos, 2007) during the peak of metamorphism that has been dated at 20-28 Ma by K-Ar on whole rocks, and by K-Ar dating of a metamorphic white mica (Table 2)(Weiland, 1999). In the western part of the Ruffaer Metamorphic Belt (Bugalaga and Beoga traverses, see sample locations in Figure 1 and 5A), Weiland (1999) obtained young AFT and ZFT ages (Table 2) suggesting rapid erosion rate during the last 3 Ma. Using the 12ºC/km paleogeothermal gradient unraveled by Warren (1995) and Warren and Cloos (2007), a closure temperature of 250ºC for the ZFT thermochronometer, surface temperature at 10ºC, and the average 3 Ma ZFT ages, Weiland (1999) considered that these samples were at 20 km depth at 3 Ma and at 25 km depth at 21 Ma. Accordingly, erosion rates in the Ruffaer Metamorphic Belt were ~0.3 mm/a from 21 Ma to 3 Ma (5 km in 18 Ma), and ~6.9 mm/a from 3 Ma to the present (Figure 5). In order to check these interpretations, we modeled the time-temperature history of the AFT ages analyzed by Weilland (1999)(Table 2) using inverse modelling in QTQtR5.6.0 (Gallagher, 2012). Inverse modelling were performed for the AFT data (Table 2, Weiland, 1999) using the
annealing model of Ketcham et al. (2007). We placed constraints on the thermal history using the K/Ar muscovite (21.3 ± 0.4 Ma) age and ZFT ages (2.9 ± 0.5 Ma)(Table 2) and the corresponding closure temperatures, 350 ± 50 ºC for the K/Ar on muscovite chronometer and the temperature range of zircon partial annealing zone (220ºC-350ºC) estimated by Yamada et al. (2007).
To estimate the unroofing paths A and B, we considered the two values of burial depth determined by Warren and Cloos (2007) in the Ruffaer Metamorphic Belt, 30 km and 20 km, respectively. For the rapid phase of erosion since 3 Ma, we used two different paleogeothermal gradient and the same ZFT closure temperature as Weiland (1999) to infer a higher (unroofing path A) and a lower bound (path B) on erosion rate. We used these two values to estimate a possible error in the eroded volumes for the last 3 Ma induced by the arbitrary choice of a paleogeothermal gradient in the Ruffaer Metamorphic Belt. For the period before 3 Ma and up to 21 Ma, we calculated the erosion rate from the missing column of rock for a total denudation of 30 km and 20 km in unroofing path A and B, respectively. In the case of unroofing path A, we used the same 12ºC/km gradient as Weiland (1999), resulting in the same 6.9 mm/a exhumation rate for the time interval 3 Ma to the present. From 21 Ma to 3 Ma, erosion rate needs to be ~0.6 mm/a (10 km in 18 Ma) for a total unroofing of 30 km, which in return would imply the samples were at ~370ºC at 21 Ma, a value consistent with the K/Ar muscovite chronometer defined by a closure temperature of 350 ± 50ºC. This later erosion rate is twofold the estimate of Weiland (1999) for the same period, who considered the samples were on average at 25 km depth at 21 Ma. Weiland (1999) used the same low paleogeothermal gradient (12ºC/km) for the period of rapid cooling. However, rapid exhumation leads to advection of isotherms near the surface
and to higher temperature gradients, as for example in the Himalaya where 2D heat flow modeling shows it may locally increase up to ~25ºC/km (e.g., Herman et al., 2010). In order to take into account the upward advection of heat by erosion, ,we used a higher paleogeothermal gradient (25ºC/km) for the last phase of rapid exhumation (3 Ma to 0 Ma) in unroofing path B. Following this hypothesis, samples were at ~10 km depth at 3 Ma and they have been exhumed at an average rate of 3.3 mm/a during the last 3 Ma. Before 3 Ma, exhumation needs to reach ~0.6 mm/a (10 km in 18 Ma) for a total denudation of 20 Km during the last 21 Ma. We used these values to calculate the eroded volumes in the Weyland Overthrust considered to be the equivalent of the Ruffaer Metamorphic Belt. Note that a paleogeothermal gradient of 12ºC/km would imply the samples were at ~370ºC at 21 Ma, again consistent with the age of the K/Ar muscovite.
Where the New Guinea Limestone Group and the Kembelangen Group crops out we calculated the mean erosion rates based on the possible range of the missing stratigraphic thicknesses. Preservation of volcanic edifice together with AFT ages indicate that in the Kemabu Plateau (Irian Fold Belt) erosion rate was lower than 0.7 mm/a during the last 3 Ma, and probably in the order of ~0.35 mm/a (Weiland and Cloos, 1996). The New Guinea Limestone Group is 1600- to 1800-m-thick (Quarles van Ufford, 1996) and it has been partially preserved from erosion in the Kemabu Plateau. Considering a spatially homogenous thickness, it means that before 3 Ma, less than 1600-1800 m of rocks have been eroded since the emergence of the island at 12 Ma. It implies a mean erosion rate <0.18-0.20 mm/a for the period between 12 Ma and 3 Ma in the Kemabu Plateau where the New Guinea Limestone Group crops out. We used these values in the unroofing paths B and A, respectively. Where the New Guinea
Limestone Group has been removed, the underlying Mesozoic Kembelangan Group crops out. Cross-sections of the Irian Fold Belt (Kendrick, 2000) suggest that less than 600 m of erosion locally affected the Kembelangan Group in the Kemabu Plateau. Where the Kembelangan Group outcrops in the Kemabu Plateau, we consider 2200 m to 2400 m of erosion (the thickness of New Guinea Limestone Group plus 600 m) between 12 Ma and 3 Ma, which gives a mean erosion rate less than 0.24 and 0.27 mm/a, respectively. The higher value has been used in the unroofing path A and the lower one in path B. Close to the Ruffaer Metamorphic Belt and north of the Grasberg mining district (Kemabu Plateau), Kendrick (2000) obtained two AFT ages in the upper section of the Kembelangan Group (Ekmai Fm., 65-85 Ma). These AFT ages are also published and discussed in Kendrick et al. (1997). One indicates partial resetting at 32.3 ± 6.0 Ma and the second at 12.8 ± 6.0 Ma. Only one track length has been measured which strongly limits the accuracy of thermal modeling. Kendrick (2000) also obtained two ZFT ages from the same samples, one at 11.5 ± 0.6 Ma from a single population of grains and the other partially reset retaining varying degrees of original provenance ages. Thermal modeling of AFT ages and track lengths indicate that these samples were heated to temperatures above 100ºC at 13 Ma, and that they cooled through the isotherm 110ºC at 8 Ma (Kendrick, 2000). Kendrick (2000) suggested ~3500 m and ~2500 m of unroofing since 8 Ma assuming geothermal gradients of 25ºC/km and 35ºC/km, respectively. From the estimates of Kendrick (2000), mean erosion rate were 0.31-0.43 mm/a during the last 8 Ma, values slightly higher than our estimates used in the unroofing paths A and B. The Ekmai Formation is 600 m thick. The removal of 1600-1800 m of New Guinea Limestone Group rocks and of 600 m of the Ekmai Formation implies 2200-2400 m of unroofing, supporting the erosion of up
to ~1000 m of synorogenic clastic sediments, previously shed from the uplifted terranes in the North (Irian Ophiolite Belt and Ruffaer Metamorphic Belt)(Kendrick, 2000). According to thermal modeling, piggy back basins may have existed in the Irian fold belt but they have not been preserved from erosion. Kendrick (2000) did not give any explanations for the reset ZFT ages that would imply high paleotemperatures >250ºC. Possible explanations are counting error, or sample contamination, or localized intrusive heating as observed by Kendrick (2000) in the Paniai lake area. There, ZFT samples from the Kambelangan Group show partially reset ages close to intrusives and retained age provenance in more distant samples. We therefore chose to not use the 0.31-0.43 mm/a erosion rates derived from the poorly constrained thermal modeling of Kendrick (2000). Below the main divide, Kendrick et al. (1995) and Kendrick (2000) obtained AFT ages sampled in the Waripi and Tipuma formations. However, these ages are only based on six apatite grains and only one track length measurement, statistically preventing any well constrained modeling of the time-temperature history at this location. Elsewhere in the north flank of the Central Range where the Kembelangan Group outcrops, we considered that at minimum 1600 m of the New Guinea Limestone Group have been eroded (unroofing path B). The maximum thickness of the Kembelangan Group (Figure 3) described in the region is 5500 m (Quarles van Ufford, 1996). Hence, we also consider that at most 1800 m of the New Guinea Limestone Group plus 5500 m of the Kembelangan Group have been removed since 12 Ma (unroofing path A), resulting in a mean erosion rate ranging between 0.13 mm/a and 0.6 mm/a (respectively 1600 and 7300 m in 12 Ma). We used these values in the unroofing paths B and A, respectively.
Assuming a constant drainage basin size, the land surface A covered by each tectonometamorphic unit n, and using the above minimum and maximum erosion rates E for each lithology and their time interval of validity Δt, the volumes of erosion or outflux from each catchment at time t is:
eq. (2)
with Δt1 from 0 Ma to 3 Ma and Δt2 from 3 to 12 Ma, when the island started to
emerge. The areas of each catchment were derived from the DEM and the surface exposure of each lithology have been derived using the geological map compiled by Charpentier et al. (2010). We derived maximum (unroofing path A) and minimum (unroofing path B) estimates for the eroded volumes considering the range in erosion rates described above and summarized in Table 3. We also calculated the eroded volume using the erosion rates in Weiland (1999) for the Irian Ophiolite Belt, the Ruffaer Metamorphic Belt and in Weiland and Cloos (1996) for the Kemabu Plateau, combined with the erosion rates used in the unroofing path A for the other tectonometamorphic units (Table 3).
3.3 Source rocks of the Waipoga Basin clastics
The main geological units in the four large mountainous catchments draining the western Central Range and the Weyland Overthrust are the Kembelangan Group, the New Guinea Limestone Group, the Ruffaer Metamorphic Belt, the Miocene diorites of the Weyland Overthrust, and in minor proportion the Irian Ophiolite Belt and the Pliocene calc-alkaline volcanics. Using the eroded volume of each lithology we estimated the main composition of the clastics delivered by the four catchments to the
Waipoga Basin. We assumed a steady spatial distribution of the different tectonometamorphic units (e.g., Michael et al., 2014) and we used the maximum estimate of the volumes of erosion since the age of the onset of embayment we previously deduced from the volume balance.
We now summarize the dominant lithologies contained by the main tectonometamorphic units. In the southern flank of the western Central Range, the Mesozoic Kembelangan Group is 4600±900 m thick and it contains ~70% of sandstones and ~30% of mudstones and carbonates in minor proportion. Pigram and Panggabean (1983) divided the Kembelangan into four formations, the Kopai Formation, Woniwogi Sandstone, Piniya Mudstone, and Ekmai Sandstone. A detailed description of the Kembelangan Group can be found in Quarles van Ufford (1996). The New Guinea Limestone Group (Pieters et al., 1983; Visser and Hermes, 1962) is 1600 to 1800 m thick (Figure 3) in the Grasberg mining district in the southern flank of the Central Range (Quarles van Ufford, 1996). Late Cretaceous (Robinson et al., 1988) to Middle Miocene (Quarles van Ufford, 1996) ages have been reported for this group. It contains 98% of limestones and is subdivided into four formations, the Waripi, Faumai, Sirga and Kais Formations (Quarles van Ufford, 1996). The Ruffaer Metamorphic Belt is made of metamorphosed distal equivalents of the Kopai Formation and Pinyia Mudstone of the Kembelangan Group. The low-grade metamorphism resulted in slates and phyllites bearing graphite (Warren, 1995; Warren and Cloos, 2007). The Kopai Formation in the southern flank contains ~75% of sandstones and ~25% of mudstone and siltstone (Quarles van Ufford, 1996). Thin sections analysis revealed quartz arenite siltstone and quartz arenite sandstone in the Pinyia Mudstone. Siltstones are interbedded with well-sorted, fine-grained sandstones. In the Weyland Overthrust an
arc-type magmatic Middle Miocene diorite outcrop with batholitic dimensions. The Irian Ophiolite is made up of serpentinized ultramafic rocks and of mafic intrusives and volcanic rock.
3.4 Volumes of sediments and recent sedimentary dynamics in the Waipoga Basin In Cenderawasih Bay, we estimated the volumes of sediments in the upper sequence described by Decker et al. (2009) and Sapiie et al. (2010). We used the same set of seismic lines acquired by TGS-NOPEC Geophysical Company in 2007-2008. To obtain an order of magnitude of the volume of sediments we restricted our study to eight seismic lines. They cover the maximum extent of the whole set of the seismic lines available in Cenderawasih Bay. Five seismic lines trend NW-SE and three trend NE-SW (Figure 4). The seismic interpretation has been done using Petrel (2013) and we followed the basal unconformity of the upper sequence described in Decker et al. (2009) and Sapiie et al. (2010). We estimated the volume of sediments between the sea floor and this unconformity. Depth conversion of interpreted horizons and grids was carried out using velocity information from well data within the study area. We also estimated the volume of sediments onshore using gravimetric data (Dow et al., 1986; Milsom, 1991; Visser and Hermes, 1962). According to Dow and Sukamto (1984), the minimum thickness of sediments onshore in the Waipoga Basin is 8 km. Since there are no available seismic lines covering the Waipoga Basin onshore we assumed that the Waipoga Basin extent corresponds to the regional low gravimetric anomaly and we converted linearly the isogal contour lines (Figure 4) to depth from 0 km at the margin of the Waipoga Basin where the Bouguer anomaly is null, up to 8 km where the
maximum negative Bouguer anomaly (-110 mGal) is reported. We repeated this calculation using the maximum sediment thickness inferred from our seismic interpretation offshore. We interpolated the offshore and onshore estimates of sediment thicknesses where data were not available.
We analyzed the recent sediment routing system using the high-resolution bathymetry (25 m) acquired by the TGS-NOPEC Geophysical Company. From this bathymetric data we have identified active and abandoned submarine channels, as well as depositional lobes. We used these data combined with the clastic sources in the main channels that feed Cenderawasih Bay to predict the lithology distribution in the Waipoga Basin.
4 Geomorphologic analysis
4.1 Results
4.1.1 Main geomorphological features of the western Central Range
The western Central Range displays marked topographic asymmetry with a short southern flank, 30 km wide, where regional slopes are ~4-7º and a 60-km-long northern flank with regional slopes of ~2-4º (Figures 2 and 6A). In the central part of the western Central Range there is a highly elevated, low-relief erosional surface: the Kemabu Plateau. The mean elevation calculated in a 30-km-diameter moving window (at crustal scale) ranges between 3000 m and 3600 m in this ~25-km-wide and ~250-km-long area (Figure 6A). When calculated in a 100-km-diameter moving window (at lithospheric scale), mean elevation in the western Central Range is well above 1000 m
a.s.l. and it ranges between 2000 m and 2600 m in a ~60-km-wide and ~300-km-long area encompassing the Kemabu Plateau and part of the surrounding flanks (Figure 6B). In the plateau, crest elevations range between 3500 m and 4800 m a.s.l. (Figure 2B) and they stand at most ~500 m higher than the adjacent main valleys (local relief in figure 2A). Mean local slopes are 13º±8 (±1σ) in this high-elevation, low-relief topography (Figure 6B).
Three large and elongated drainage basins drain the plateau and are orientated almost parallel to the mountain chain (Figure 7A). Longitudinal rivers drain west and east of the highest summit, the Puncak Jaya (137º11’E). These rivers then flow parallel to the trend of the Central Range following the axis of the kilometer-scale folds and inverse faults that affect the sedimentary series of the Mesozoic Kembelangan Group and of the Cenozoic New Guinea Limestone Group (Figures 7A and 7B). The resulting longitudinal reaches are tens of kilometers long. In the upper Derewo catchment, a large catchment that feeds Cenderawasih Bay (river 2, catchment B in figure 7A), the rivers locally reach ~35 km long while they flow at an elevation of 3000-4000 m a.s.l., close to the main divide that separates the Kemabu Plateau from the southern flank.
On the other hand, in both flanks of the Kemabu Plateau transverse rivers dominate the drainage network. In the 30-km-wide southern flank, a jagged landscape with 1500-2000 m deep valleys (Figure 2A and 2B) and high local slopes (26º±10, 1σ) makes the transition between the >3000 m a.s.l., low relief Kemabu Plateau and the southern foreland basin that is close to sea level. The transverse rivers are regularly spaced, perpendicular to the structural grain (Figures 7A and 7B) and they follow the steep regional slopes (4º-7º) toward the southern foreland basin.
4.1.2 Spatial distribution of the coordinate, steepness index (Ksn) and longitudinal
profile analysis
Figure 7A shows a 3D view of values in the western Central Range. We observe a sharp contrast in values along the southern border of the Kemabu Plateau. In the headwaters of the southern flank transverse rivers, ranges between 70 and 110. However, directly on the other side of the divide, the values are systematically higher with values ranging between 130 and 250 in the headwaters of the Derewo River (catchment B) and its tributaries located in the plateau. The same contrast also exists between the basins A and C in the plateau and their adjacent catchments in the southern flank.
The analysis of 21 long profiles and their tributaries in the southern flank shows that the best concavity (m/n) to linearize channels in -elevation plots is statistically 0.4, when calculated from collinearity tests, as well as from linear tests of the main stems, although it is poorly defined in the latter case with values ranging between 0.15 to 0.95 (Figure 8).
Using a concavity of 0.4 we extracted the steepness indices (Ksn) of all the main
rivers and their tributaries. Figure 7B and figure 1 in supplementary material show that
Ksn is systematically higher in the southern flank with values ranging between 10 and
30 than in the Kemabu Plateau where Ksn is mostly comprised between 3 and 7. The
analysis of the 21 longitudinal profiles in -elevation space reveals the occurrence of two types of knickpoints in the rivers of the southern flank: one that occurs neat the base of the range and one near the headwaters. Figures 9A and 9C show examples of
these two kinds of knickpoints in the long profiles of the rivers with outlet numbers 32062 and 36632 (see location in Figure 7B). The long profile of river 32062 shows a knickpoint in the downstream segment at = 65 (Figure 9A). We observe this first type of knickpoint in another three adjacent transverse rivers in the region to the southwest of Mount Puncak Jaya. The second type of knickpoint is located close to the southern edge of the plateau in the upstream portions of the transverse rivers. Eleven of the twenty-one catchments analyzed in the southern flank show this arrangement. In catchments numbered 32062 and 36632, they occur at values ranging between 170 and 220 (Figures 9A and 9C). To the North, across the main divide, none of these second type of knickpoints exist in the upstream areas of the Derewo basin (Catchment B in Figure 7B), and similarly none exist in the rivers of catchments A and C that drain the Kemabu Plateau. The spatial distribution of the second type of knickpoints is not correlated with faults nor is it correlated with lithology. Figures 9B and 9D show that most of the reaches upstream of these second-type knickpoints are longitudinal, they follow the fold axes and they are perpendicular to the main transverse stems.
4.2 Discussion on relief dynamics
4.2.1 Drainage network evolution in the western Central Range
We have shown that the drainage network is dominated by rivers flowing almost parallel to the structural grain in the central part of the chain within the Kemabu Plateau. In many fold-and-thrust belts, transverse rivers are diverted into longitudinal reaches, parallel to the geologic structures (e.g., Jackson et al., 1996). Such networks,
which are called longitudinal-dominated occur in response to rock uplift and local slope increase on thrust anticlines and lead to the gathering of transverse rivers into larger rivers, which maintain gorges through growing tectonic structures. The ability for preexisting transverse reaches to incise uplifting topography controls the number of diversions, and therefore the drainage organization in fold-and-thrust belts (e.g., Babault et al., 2013; Babault et al., 2012; Burbank and Vergés, 1994; Champel et al., 2002; Humphrey and Konrad, 2000; Jackson et al., 1996; Jolley et al., 1990; Koons, 1994, 1995; Oberlander, 1985; Sobel et al., 2003; Talling et al., 1997; Tomkin and Braun, 1999; van der Beek et al., 2002; Viaplana-Muzas et al., 2015). Post-tectonic alkaline igneous rocks dated at 3 Ma intrude the Irian Fold belt, indicating that deformation occurred before 3 Ma (McDowell et al., 1996; McMahon, 1994a, b, 2001). In the Lengguru fold-and-thrust belt the drainage network is also longitudinal-dominated with longitudinal reaches being confined to the syncline areas (Figure 10A and 10B). Syn-tectonic clastic sediments of the Klassafet Fm. (Visser and Hermes, 1962) in piggy back basins and in the foreland suggest a Late Miocene to Pliocene age for folding. The shortening rate is 23-29% (Kendrick et al., 2003) being the same as in the highlands of the western Central Range (~25%) (Kendrick, 2000). In the Lengguru fold-and-thrust belt, Plio-Quaternary normal faults developed perpendicular to the preexisting folds and thrust faults (Bailly et al., 2009). Hence, folding ended during the late Pliocene (~3 Ma) in both the Lengguru fold-and-thrust and the western Central Range giving a minimum age for the longitudinal-dominated drainage network. The analysis of the provenance of detrital sediments shows that the Akimeugah Basin in the southern flank of the western Central Range did not received sediments from the Ruffaer Metamorphic Belt during the Middle and the Upper Miocene (12 to 7 Ma)
(Visser and Hermes, 1962). It suggests that during the early period of mountain building in the Central Range the drainage network was already longitudinal-dominated and that it shielded the Akimeugah Basin from the erosion products of the Ruffaer Metamorphic Belt, as it does at present. This is supported by models that show that the diversion of channels and the formation of longitudinal reaches occur during the first stages of thrust emergence (e.g., Champel et al., 2002; Tomkin and Braun, 1999; van der Beek et al., 2002; Viaplana-Muzas et al., 2015). Accordingly, the longitudinal drainages in both the Lengguru and the Central Range were probably created during the onset of shortening and mountain building in the Late Miocene (~12 Ma) when the island started to emerge.
However, the drainage networks in the Lengguru and the western Central Range display different features. The drainage network in the southern flank of the western Central Range is transverse-dominated, with rivers flowing from the highly-elevated southern border of the Kemabu Plateau toward the foreland basin close to the sea level following the steep regional slope (Figures 6A and 10). The local slopes in the southern flank are much higher than in the central plateau (Figure 6B) and are close to the critical value for hillslope stability in active orogens (e.g., Montgomery et al., 1996). The higher local slopes in the southern flank as well as the higher Ksn values
suggest the erosion rates are higher on the southern flank than on the Kemabu Plateau. These geomorphic features are in accordance with erosion rates deduced from low-temperature thermochronology (AFT), which average over million year timescales. In the absence of any data of erosion in the longitudinal-dominated catchments in the southern margin of the Kemabu Plateau, we assume the plateau has the same mean erosion rate of ≤0.7 mm/a estimated by Weiland and Cloos (1996) in
the nearby southern edge of the plateau (Gratsberg mining district) (location in figures 5A and 10). Indeed, although the mining district belongs to a transverse drainage basin in the southern flank, it shows in its upstream area the same geomorphic characteristics as those of the Kemabu Plateau, i.e. low local relief, and similar low Ksn
values at high elevation in longitudinal reaches (Figure 11). Furthermore, the New Guinea Limestone Group in both areas shows a similar level of erosion. On the other hand, in the middle of the southern flank, Upper Pliocene AFT ages (2.3 Ma), unreset ZFT ages (Weiland, 1999) and stratigraphic correlation indicate a total amount of ~9 km of exhumation (Weiland and Cloos, 1996). Weiland and Cloos (1996) estimated an erosion rate of 1.7 mm/a since 2.3 Ma and probably since the last 7 Ma. There is no evidence for the existence of a regional fault with a vertical offset that would account for the 1 mm/a faster erosion rate in the middle southern flank compared to that in the southern plateau border (mining district) and (Figure 11) (Cloos et al., 2005; Kendrick, 2000). In the absence of rock uplift gradient close to the main divide, the local slopes and erosion rates contrasts between the Kemabu Plateau and the southern flank argue for (i) the expansion of the more aggressive transverse-river catchments, (ii) the northward migration of the southern border of the slowly eroding Kemabu Plateau and (iii) the shrinkage of the upper Derewo basin. Following the criteria (Willet et al., 2014), the significant differences of values across the main divide also argue for the northward migration of the divide, toward the higher values of in the Kemabu Plateau. The progressive integration of low-gradient longitudinal reaches, previously belonging to the Derewo drainage basin, by the process of divide migration and captures explains their occurrence in the higher part of the southern flank. The varying elevations and distances from the outlet of the B-type knickpoints in
the catchment 36662 (Figure 9C) are in accordance with an origin by capture. Based on this evidence, we interpret the longitudinal upper reaches of the southern rivers as transient landforms that should disappear by upstream knickpoint migration, so that they are lacking in 10 of the 21 transverse catchments we studied. Consequently, the drainage network in the Central Range evolved from a longitudinal-dominated drainage, controlled by folds and reverse faults, to a transverse-dominated one, probably since the last 7 Ma when rapid erosion begun above the Mapenduma thrust. The difference in erosion rates between the south flank and the Kemabu plateau were previously interpreted to be principally controlled by orographically induced precipitation (Weiland and Cloos, 1996). Our findings suggest these patterns are more likely reflection of transient erosional response to mountain building.
The mean elevation varies between 3000 m and 3500 m a.s.l. in the Kemabu Plateau and the regional slope in the south flank is high (4º to 6º). However, in the Lengguru fold-and-thrust belt, the mean elevation does not exceed 500 m a.s.l. and the topographic gradient in the wedge is less than 1º. The shortening rate is ~40% and 25% in the Central Range (Irian Fold Belt and Mapenduma Thrust) and the Lengguru fold-and-thrust belt, respectively. The more than 3000 m of difference in surface uplift between these two provinces is difficult to explain by the 15% difference in shortening and associated crustal thickening. However, it has been proposed that the subducting Australian lithospheric mantle has been replaced by buoyant asthenospheric mantle during mountain building, during collisional delamination (Cloos et al., 2005). The onset of collisional delamination is dated at 8 Ma by Late Miocene volcanism and associated intrusive rocks in the western Central Range (Cloos et al., 2005). Hence the increase of the mean elevation and of the regional slope in the southern flank may
have started as soon as 8 Ma. Whatever the tectonic processes responsible for the high elevation of the Central Range, the spatial correlations between (i) the low-elevation of Lengguru fold-and-thrust belt and its preserved longitudinal drainage network, and (ii) between the steep southern flank of the Central Range and the reorganization toward a transverse drainage argue for the regional slope increase during mountain building to be driving drainage network reorganization.
This behavior is comparable to the drainage network reorganization observed in other fold-and-thrust belts like the High Atlas of Morocco and the Eastern Cordillera of Colombia where the gain in mean elevation by crustal thickening during mountain building and the resulting increase of the regional slope have been proposed to be the controlling factor for drainage reorganization (Babault et al., 2012; Babault et al., 2013). This model accounts for the contrast of drainage dynamics between the western Central Range and the Lengguru where no transverse rivers have replaced longitudinal-dominated drainage. The same dynamics of drainage network evolution in these three mountain ranges and its tectonic origin support the view that when longitudinal drainage develops in the early stages of mountain building it may become a transient feature if sufficient surface uplift occurs. While the convergence is oblique between the Australian and Pacific plates, we do not observe patterns of catchment distortions and rotation of main stems in the Central Range as observed for the drainage organization in southern New Zealand in a similar context of oblique convergence (Castelltort et al., 2012). In fact, following Cloos et al. (2005), the few kilometers of strike-slip movements in the western Central Range (Sapiie and Cloos, 2004) are negligible compared to the tens of kilometers of shortening. These patterns reveal a strong partitioning of crustal deformation as classically observed during
oblique plate convergence (e.g., Dewey et al., 1998; Ellis and Watkinson, 1987; Tikoff and Teyssier, 1994; Van Den Driessche, 1986).
4.2.2 Divide migration velocity, Derewo catchment shrinkage and implication on sedimentary outfluxes to Cenderawasih Bay
Assuming uniform rock uplift, the differential erosion rate (ΔE ≥ 1 mm/a) can be transposed to a horizontal displacement of the main divide to the north, xm(t). The
mean elevation in the southern flank can be written in one dimension (Figure 12) as:
eq. (3)
In the Kemabu Plateau the mean elevation is:
eq. (4)
The mean celerity of divide migration (Cm) is obtained by solving the equality
between the above two equations (3 and 4) at t when x = xm:
, eq. (5)
Equation 4 shows that Cm depends on the mean differential erosion rate between
the south flank and the plateau, and on the mean regional slope of the south flank ( = 5.7º). We obtain a mean rate of divide migration Cm ≥ 10 mm/a. If we assume a
constant velocity of divide retreat, and take into account the 30 km width of the southern flank, we find the main divide migration started at most 3 Ma ago. This age may be underestimated if the uplift rate is higher in the lower slope of the southern flank than near the crest. During the process of divide migration, any catchment in the