HAL Id: hal-00299377
https://hal.archives-ouvertes.fr/hal-00299377
Submitted on 11 Oct 2006
HAL is a multi-disciplinary open access
archive for the deposit and dissemination of
sci-entific research documents, whether they are
pub-lished or not. The documents may come from
teaching and research institutions in France or
abroad, or from public or private research centers.
L’archive ouverte pluridisciplinaire HAL, est
destinée au dépôt et à la diffusion de documents
scientifiques de niveau recherche, publiés ou non,
émanant des établissements d’enseignement et de
recherche français ou étrangers, des laboratoires
publics ou privés.
The East Aegean Sea strong earthquake sequence of
October?November 2005: lessons learned for earthquake
prediction from foreshocks
G. A. Papadopoulos, I. Latoussakis, E. Daskalaki, G. Diakogianni, A. Fokaefs,
M. Kolligri, K. Liadopoulou, K. Orfanogiannaki, A. Pirentis
To cite this version:
G. A. Papadopoulos, I. Latoussakis, E. Daskalaki, G. Diakogianni, A. Fokaefs, et al.. The East Aegean
Sea strong earthquake sequence of October?November 2005: lessons learned for earthquake prediction
from foreshocks. Natural Hazards and Earth System Science, Copernicus Publications on behalf of
the European Geosciences Union, 2006, 6 (6), pp.895-901. �hal-00299377�
Nat. Hazards Earth Syst. Sci., 6, 895–901, 2006 www.nat-hazards-earth-syst-sci.net/6/895/2006/ © Author(s) 2006. This work is licensed under a Creative Commons License.
Natural Hazards
and Earth
System Sciences
The East Aegean Sea strong earthquake sequence of
October–November 2005: lessons learned for earthquake prediction
from foreshocks
G. A. Papadopoulos, I. Latoussakis, E. Daskalaki, G. Diakogianni, A. Fokaefs, M. Kolligri, K. Liadopoulou, K. Orfanogiannaki, and A. Pirentis
Institute of Geodynamics, National Observatory of Athens, 11810 Athens, Greece
Received: 18 July 2006 – Revised: 28 September 2006 – Accepted: 28 September 2006 – Published: 11 October 2006
Abstract. The seismic sequence of October–November 2005
in the Samos area, East Aegean Sea, was studied with the aim to show how it is possible to establish criteria for (a) the rapid recognition of both the ongoing foreshock activ-ity and the mainshock, and (b) the rapid discrimination be-tween the foreshock and aftershock phases of activity. It has been shown that before the mainshock of 20 October 2005, foreshock activity is not recognizable in the standard earth-quake catalogue. However, a detailed examination of the records in the SMG station, which is the closest to the acti-vated area, revealed that hundreds of small shocks not listed in the standard catalogue were recorded in the time inter-val from 12 October 2005 up to 21 November 2005. The production of reliable relations between seismic signal dura-tion and duradura-tion magnitude for earthquakes included in the standard catalogue, made it possible to use signal durations in SMG records and to determine duration magnitudes for 2054 small shocks not included in the standard catalogue. In this way a new catalogue with magnitude determination for 3027 events was obtained while the standard catalogue contains 1025 events. At least 55 of them occurred from 12 October 2005 up to the occurrence of the two strong fore-shocks of 17 October 2005. This implies that foreshock activity developed a few days before the strong shocks of 17 October 2005 but it escaped recognition by the routine procedure of seismic analysis. The onset of the foreshock phase of activity is recognizable by the significant increase of the mean seismicity rate which increased exponentially with time. According to the least-squares approach the b-value of the magnitude-frequency relation dropped significantly dur-ing the foreshock activity with respect to the b-value prevail-ing in the declustered background seismicity. However, the maximum likelihood approach does not indicate such a drop of b. The b-value found for the aftershocks that followed
Correspondence to: G. A. Papadopoulos
(g.papad@gein.noa.gr)
the strong shock of 20 October 2005 is significantly higher than in foreshocks. The significant aftershock-foreshock dif-ference in b-value is valid not only if the entire aftershock sequence is considered but also if only the segment of af-tershocks that occurred within the first 24-h or the first 48-h after the mainshock of 20 October 2005 are taken into ac-count. This difference in b-value should be examined further in other foreshock-aftershock sequences because it could be used as a diagnostic of the mainshock occurrence within a few hours after its generation.
1 Introduction
During periods of strong seismic activity in a particular area one of the main issues that civil protection authorities re-quest from scientists to evaluate regards the rapid recognition of the nature of the several phases of seismic activity: fore-shocks, mainshock, aftershocks. As for the foreshock phase it is of great importance to recognize it before the mainshock occurrence for the advice of the authorities as for the need to organize counter-measures in view of the impending main-shock. The importance of this problem because of its con-nection with earthquake prediction has been already noted (e.g. Lombardi, 2003). However, foreshocks precede only some mainshocks and not others. In addition, no standard methodology has been established so far for the on time dis-crimination between foreshocks and other types of activity like swarms and aftershocks. On the other hand, the rapid decision that a particular strong shock of the sequence is the mainshock is difficult and should be based on certain dis-crimination criteria. As an instance, the rapid recognition that the system passed from the phase of foreshocks to the phase of aftershocks could be such a criterion.
On 17 October 2005 two strong shocks of magnitudes
Mw=5.5 and Mw=5.8 ruptured the area to the north of Samos
896 G. A. Papadopoulos et al.: East Aegean 2005 seismic activity and earthquake prediction
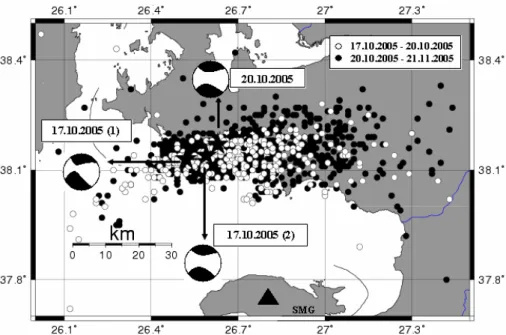
Fig. 1. Foreshocks and aftershocks listed in the NOAGI catalogue (http://www.gein.noa.gr) for the area of Samos Island during October– November 2005. SMG is the Samos station. Stars indicate the three largest shocks (Table 1). CMT focal mechanisms are determined by Harvard.
Table 1. Focal Parameters of the three largest shocks that occurred in the area of Samos Island (Fig. 1) during October 2005. All param-eters are according to the NOAGI determinations (http://www.gein.noa.gr). Magnitudes determined by USGS and Harvard (HRV) are also included.
Date (d m y) Time (GMT) Lat (N◦) Long (E◦) Magnitude
USGS NOAGI HRV 17 Oct 2005 05:45:16 38.14 26.59 5.7 (ML) 5.5 (ML) 5.5 (Mw)
17 Oct 2005 09:46:53 38.13 26.59 5.8 (Mw) 5.4 (ML) 5.8 (Mw)
20 Oct 2005 21:40:04 38.15 26.63 5.9 (Mw) 5.6 (ML) 5.8 (Mw)
20 October 2005 another strong earthquake of Mw=5.8 or
Mw=5.9 ruptured the same area. The earthquake activity
continued with decreasing rate up to the end of November 2005. Hundreds of earthquakes recorded by the national seis-mograph network of the National Observatory of Athens, In-stitute of Geodynamics (NOAGI), Greece. The earthquake sequence was dominated by nearly E–W dextral strike-slip motion and extended in both the Greek and Turkish territo-ries. For reasons of simplicity, however, the area considered in this study (Fig. 1) is referred to as “Samos area”.
The earthquake activity did not caused serious damage in the area. However, a great concern was generated to the local population as for the possible occurrence of a large shock. The main question that scientists but also the author-ities faced with was about the nature of the ongoing activ-ity: were the strong shocks of 17 October 2005 and 20 Oc-tober 2005 foreshocks of an impending stronger earthquake or one of those events was the mainshock? Such questions were impossible to be replied reliably on a near real-time
ba-sis not only due to that magnitudes determined by NOAGI at that time were only preliminary but also because of the lack of certain discrimination criteria between foreshocks-mainshock-aftershocks on near real-time conditions.
In this paper we study the October–November 2005 earth-quake sequence in Samos area. Based on seismicity statis-tical properties it is shown how a methodology could be es-tablished for the rapid recognition (a) of the foreshock phase of activity, and (b) of the mainshock occurrence of an earth-quake sequence. Some general properties of the foreshock sequences, however, are firstly reviewed.
2 Properties of foreshocks
Foreshock sequences are characterized by some distinct fea-tures. Laboratory material fracture experiments (e.g. Mogi, 1963; Scholz, 1968) along with numerical modeling in spring-block models (Hainzl et al., 1999) have shown a clear acceleration of the fracturing process before the main
G. A. Papadopoulos et al.: East Aegean 2005 seismic activity and earthquake prediction 897 fracture. Studies regarding seismicity in Japan, western
United States, Greece, Italy and elsewhere verified this in na-ture showing that foreshock activity increases approximately as the inverse of time before mainshock (Papazachos, 1975; Kagan and Knopoff, 1978; Jones and Molnar, 1979). In the magnitude-frequency or Gutenberg-Richter (G-R) relation
log N = a − bM (1)
the parameter b drops and becomes significantly lower in foreshocks than in aftershocks or in background seismicity (Mogi, 1963; Scholz, 1968; Papazachos, 1975; Jones and Molnar, 1979; Hainzl et al., 1999; Molchan et al., 1999); where N is the incremental or the cumulative number of events of magnitude ≥M±1M and a, b are parameters de-termined by the data (Gutenberg and Richter, 1944). Fore-shocks occur from hours to a few months, and very rarely about 1.5 years before the mainshock (Jones, 1984; Jones and Molnar, 1979; Molchan et al., 1999; Papadopoulos et al., 2000; Sobolev, 2000). A common knowledge is that foreshocks precede only some mainshocks and not others. However, this may be only an apparent result given that low magnitude foreshocks usually are not listed in standard earth-quake catalogues due to that the magnitude cut-off in such catalogues is relatively high.
3 Construction of new earthquake catalogue
Examination of the standard earthquake catalogue produced by the NOAGI routine procedure of seismic analysis (http: //www.gein.noa.gr) showed that in the Samos area no appar-ent seismicity increase occurred before the first strong shock of 17 October 2005. The catalogue lists three shocks that took place at a distance of less than 30 km from the epicen-ters of the 17 October 2005 strong earthquakes: one shock of magnitude 3.0 on 21 August 2005 and two shocks of magni-tude 3.1 and 3.2 on 16 October 2005. The activity increased drastically only after the strong events of 17 October 2005. Therefore, based on the standard catalogue of the area one may conclude that the first strong shock of 17 October 2005 came without foreshock notice. On the contrary, after the two earthquakes of 17 October 2005 many sizeable shocks were recorded, analyzed and listed in the standard NOAGI catalogue. Should the strong shock of 20 October 2005 be considered as the mainshock of the October–November 2005 sequence in Samos area then the standard catalogue implies that foreshock activity appeared only from 17 October 2005 onwards.
To investigate small foreshocks that possibly escaped the routine determination and cataloguing we analyzed the records of the Samos (SMG) station, which is the closest to the activated area. In the daily procedure of seismic analy-sis NOAGI determines focal parameters for every earthquake event that occurs in Greece and the adjacent regions provided that at least three P and/or S phases are readable from its
national seismograph network. NOAGI routinely produces signal duration magnitude, MD(cat), as the average of the MD’s measured in the stations that record an earthquake. In
addition, local magnitude, ML, is routinely produced when
records in both the north-south and east-west components of the Wood-Anderson instrument operating in Athens (ATH) station are available.
Examination of the digital and analog records of SMG station revealed that from 12 to 17 October 2005 a num-ber of 52 shocks were recorded. As mentioned above only three of them are listed in the standard catalogue. However, all the shocks are characterized by a S-P difference of ∼6– 8 s, which corresponds to an average epicentral distance of 50 km. This is also the average epicentral distance of the ac-tivated area of Samos from the SMG station. Because of this and since no activity was noted at that time in a different area to distance of about 50 km away from SMG, we assume that these small shocks were generated in the Samos area and, therefore, they were foreshocks that preceded the strong ac-tivity of 17 October 2005. A similar examination showed that hundreds of small shocks were recorded in SMG station after the origin of the first shock of 17 October 2005. These shocks, however, are not listed in the standard catalogue.
Duration magnitudes, MD, which are in use by NOAGI are
determined from relations of the form (e.g. Papanastassiou, 1989)
MD =a + blog D + c1 (2)
where D is signal duration, 1 is epicentral distance and a,
b, c are parameters. For small epicentral distances the term
c 1can be neglected from Eq. (2). For the estimation of duration magnitude, MD(est), of the small shocks recorded in
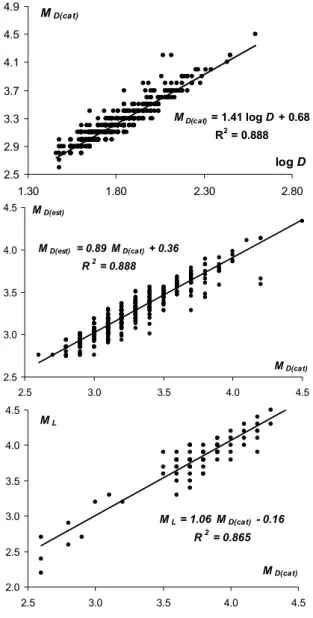
SMG but not listed in the standard catalogue for the period from 12 October to 21 November 2005, we firstly produced the linear relationship (Fig. 2):
MD(cat) =1.41 log D + 0.68, R2=0.888 (3)
from 953 earthquakes that occurred in Samos area in the above time interval and are listed in the NOAGI standard catalogue; where D is signal duration in SMG station and
MD(cat)is duration magnitude in the standard catalogue. For
87 out of 953 events local magnitude is also determined. For these 87 shocks the duration and local magnitudes are corre-lated well (Fig. 2):
ML=1.06MD(cat)−0.16, R2=0.865 (4)
which implies that MD(cat) is equivalent to ML. The term c
1has been neglected from Eq. (3) because 1 is small. For the application of Eq. (3) signal duration of small shocks recorded only in SMG was measured for signal am-plitude ≥1 mm. This procedure resulted with the estimation of duration magnitude, MD(est), for 2054 small events that
occurred in Samos area from 12 October to 21 November 2005. To check the reliability of the magnitude MD(est)a
898 G. A. Papadopoulos et al.: East Aegean 2005 seismic activity and earthquake prediction MD(est) = 0.89 MD(cat) + 0.36 R2 = 0.888 2.5 3.0 3.5 4.0 4.5 2.5 3.0 3.5 4.0 4.5 MD(cat) MD(est) ML = 1.06 MD(cat) - 0.16 R2 = 0.865 2.0 2.5 3.0 3.5 4.0 4.5 2.5 3.0 3.5 4.0 4.5 MD(cat) ML MD(cat) = 1.41 log D + 0.68 R2 = 0.888 2.5 2.9 3.3 3.7 4.1 4.5 4.9 1.30 1.80 2.30 2.80 MD(cat) log D MD(est) = 0.89 MD(cat) + 0.36 R2 = 0.888 2.5 3.0 3.5 4.0 4.5 2.5 3.0 3.5 4.0 4.5 MD(cat) MD(est) ML = 1.06 MD(cat) - 0.16 R2 = 0.865 2.0 2.5 3.0 3.5 4.0 4.5 2.5 3.0 3.5 4.0 4.5 MD(cat) ML MD(cat) = 1.41 log D + 0.68 R2 = 0.888 2.5 2.9 3.3 3.7 4.1 4.5 4.9 1.30 1.80 2.30 2.80 MD(cat) log D MD(est) = 0.89 MD(cat) + 0.36 R2 = 0.888 2.5 3.0 3.5 4.0 4.5 2.5 3.0 3.5 4.0 4.5 MD(cat) MD(est) ML = 1.06 MD(cat) - 0.16 R2 = 0.865 2.0 2.5 3.0 3.5 4.0 4.5 2.5 3.0 3.5 4.0 4.5 MD(cat) ML MD(cat) = 1.41 log D + 0.68 R2 = 0.888 2.5 2.9 3.3 3.7 4.1 4.5 4.9 1.30 1.80 2.30 2.80 MD(cat) log D
Fig. 2. Top: Duration magnitude, MD(cat), versus the logarithm
of the signal duration, log D, for the events listed in the NOAGI standard catalogue for the Samos area for the time interval from 12 October 2005 to 21 November 2005.
Middle: Estimated magnitude, MD(est), versus the duration
mag-nitude, MD(cat),provided by the NOAGI standard catalogue, for
the Samos area for the time interval from 12 October 2005 to 21 November 2005. The reliability of the estimated duration magni-tude, MD(est), is indicated by the coefficient of the duration
magni-tude, MD(cat),in the linear relationship. The closer this coefficient is to 1 the more the MD(est)magnitude approximates the MD(cat)
magnitude.
Bottom: Local magnitude, ML, versus duration magnitude,
MD(cat), for the events listed in the NOAGI standard catalogue for
the Samos area for the time interval from 12 October 2005 to 21 November 2005.
Ris the correlation coefficient of the line fitting the data.
the 953 out of 2054 events listed in the catalogue. The rela-tionship found (Fig. 2)
MD(est)=0.89MD(cat)+0.36, R2=0.888 (5)
implies that MD(est)and MD(cat)are well correlated. In this
way a new catalogue was obtained where the number of earthquakes with determined magnitudes is drastically in-creased with respect to the number of earthquakes inserted in the standard NOAGI catalogue. Although this new cata-logue provides time of occurrence and magnitude determi-nation but not epicentral estimations, yet allows for a reli-able statistical treatment of the October–November seismic sequence in Samos area. In fact, in the new catalogue mag-nitude determination was obtained for 3027 events while the standard catalogue contains 1025 events for the time inter-val from 17 October to 21 November 2005. As for the time interval from 12 October to 17 October 2005 the number of events increased from 3 in the standard catalogue to 55 in the new catalogue.
4 Statistical properties of the October–November 2005 seismic sequence
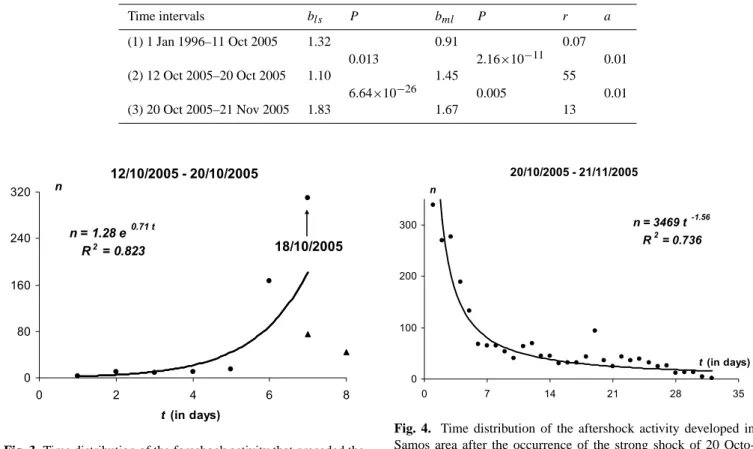
From the magnitude determinations listed in Table 1 it comes out that the largest event in the earthquake sequence of Samos area possibly was that of 20 October 2005 and, there-fore, the hypothesis that this event was the mainshock of the earthquake sequence becomes plausible. This is also sup-ported by the temporal evolution of activity in the Samos area in the time interval from 12 October to 21 November 2005. The strong earthquake of 20 October 2005 was pre-ceded by exponentially increasing foreshock activity since at least the 12 October 2005 (Fig. 3). In fact, the activity increased exponentially from 12 October 2005 up to 17 Oc-tober 2005 inclusive. A relative drop of the activity was tem-porary noted from 18 October 2005 up to the occurrence of the strong shock of 20 October 2005. The time distribution of the activity that followed this shock up to 21 November 2005 fits well the Omori law (Fig. 4) which implies that this phase of activity represents a typical aftershock sequence.
This hypothesis was examined further by comparing the statistical properties of the foreshock period with the statis-tical properties of the background seismicity and the after-shock period. For the identification of the background seis-micity of the Samos area the standard catalogue from 1 Jan-uary 1984 up to 31 December 2005 was considered (data are derived from the catalogue in http://www.gein.noa.gr). The time interval starts on 1 January 1984 since that date signifies the beginning of routine computerized earthquake determina-tion and cataloguing by NOAGI. The residual catalogue that remained after a declustering procedure was considered to represent the background seismicity of Samos area. Declus-tering was performed by removing dependent events on the basis of a Greek version of the Gardner and Knopoff (1974)
G. A. Papadopoulos et al.: East Aegean 2005 seismic activity and earthquake prediction 899
Table 2. Seismicity rate, r (events/day, 1 day = 24 h), and b-values determined for background seismicity (1), foreshock period (2), and aftershock period (3). blsand bmlare b-values determined by the least-squares and maximum likelihood approaches, respectively. P is the
probability that the two samples come from the same population according to the Utsu (1999) test. a is the significance level of the difference of the two samples according to the t-test.
Time intervals bls P bml P r a (1) 1 Jan 1996–11 Oct 2005 1.32 0.91 0.07 0.013 2.16×10⁻¹¹ 0.01 (2) 12 Oct 2005–20 Oct 2005 1.10 1.45 55 6.64×10⁻²⁶ 0.005 0.01 (3) 20 Oct 2005–21 Nov 2005 1.83 1.67 13 12/10/2005 - 20/10/2005 n = 1.28 e 0.71 t R2 = 0.823 0 80 160 240 320 0 2 4 6 8 t (in days) n 18/10/2005
Fig. 3. Time distribution of the foreshock activity that preceded the mainshock of 20 October 2005. Time t=0 is 00:00:00 a.m. of 12 October 2005. n is event frequency per day (1 day = 24 h). Expo-nential curve is the best fit. R as in Fig. 2. A power-law increase of the activity prevails from 12 October 2005 up to 18 October 2005 (solid circles). However, in the last two days a relative drop of the activity is noted (solid triangles).
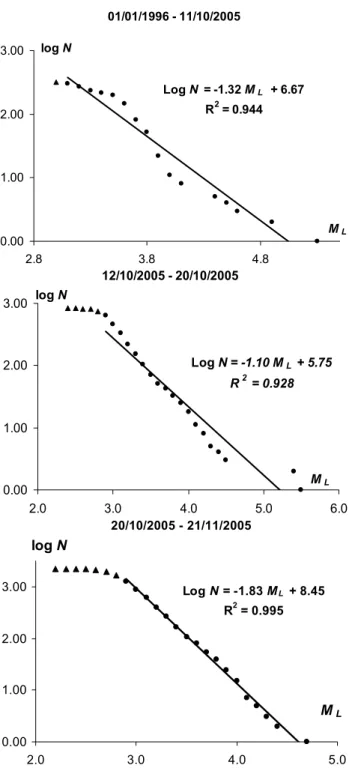
algorithm (Latoussakis and Stavrakakis, 1992). The initial catalogue contains 1758 seismic events while the declus-tered catalogue contains 411 events. Completeness analysis with the G-R diagram showed that the magnitude cut-off is
ML=3.4 from 1 January 1984 onwards but it is ML=3.1 for 1
January 1996 (Fig. 5 top). However, for the interval from 12 October 2005 to 21 November 2005 the magnitude cut-off is
ML=2.9 (Fig. 5 middle and down).
Statistical properties were examined for three main peri-ods of activity for a common magnitude cut-off ML=3.1: (1)
period of background seismicity from 1 January 1996 to 11 October 2005, (2) period of foreshock activity from 12 Octo-ber 2005 to 20 OctoOcto-ber 2005, (3) period of aftershock activity from to 20 October 2005 to 21 November 2005. Time inter-val 2 terminates with the last shock that preceded the strong earthquake of 20 October 2005, while time interval 3 starts with the first shock that follows the strong earthquake of 20 October 2005. 20/10/2005 - 21/11/2005 n = 3469 t -1.56 R2 = 0.736 0 100 200 300 0 7 14 21 28 35 t (in days) n
Fig. 4. Time distribution of the aftershock activity developed in Samos area after the occurrence of the strong shock of 20 Octo-ber 2005. The data fit well the original Omori law. R and n as in Fig. 2 and Fig. 3, respectively. Time t=0 is the origin time of the mainshock of 20 October 2005.
For each one time interval two parameters were calculated: the mean seismicity rate, r (in events/day, where 1 day = 24 h) and the b-value of the magnitude-frequency (or G-R) relation. Parameter b was determined from both the least-squares approach and the maximum likelihood method de-veloped by Aki (1965) and Utsu (1965, 1966).
For reasons of compatibility the seismicity rate for all time intervals examined was calculated for ML≥3.1. Mean
seis-micity rate equal to only 0.07 events/day (Table 2) was found for the time interval of background seismicity. The mean seismicity rate increased drastically to 55 events/day during the foreshock time period from 12 October 2005 to 20 Octo-ber 2005. However, it was equal to about 6 events/day during the early foreshock phase from 12 October 2005 to 17 Octo-ber 2005. After the strong shock of 20 OctoOcto-ber 2005 the rate increased further to 160 events/day and 105 events/day during the first 24-h and the first 48-h time intervals of the aftershock period, respectively. However, the mean seismic-ity rate was 13 events/day during the entire aftershock period from 20 October 2005 to 21 November 2005.
900 G. A. Papadopoulos et al.: East Aegean 2005 seismic activity and earthquake prediction 01/01/1996 - 11/10/2005 Log N = -1.32 ML + 6.67 R2 = 0.944 0.00 1.00 2.00 3.00 2.8 3.8 4.8 ML log N 12/10/2005 - 20/10/2005 Log N = -1.10 ML + 5.75 R2 = 0.928 0.00 1.00 2.00 3.00 2.0 3.0 4.0 5.0 6.0 ML log N 20/10/2005 - 21/11/2005 Log N = -1.83 ML + 8.45 R2 = 0.995 0.00 1.00 2.00 3.00 2.0 3.0 4.0 5.0 ML log N 01/01/1996 - 11/10/2005 Log N = -1.32 ML + 6.67 R2 = 0.944 0.00 1.00 2.00 3.00 2.8 3.8 4.8 ML log N 12/10/2005 - 20/10/2005 Log N = -1.10 ML + 5.75 R2 = 0.928 0.00 1.00 2.00 3.00 2.0 3.0 4.0 5.0 6.0 ML log N 20/10/2005 - 21/11/2005 Log N = -1.83 ML + 8.45 R2 = 0.995 0.00 1.00 2.00 3.00 2.0 3.0 4.0 5.0 ML log N 01/01/1996 - 11/10/2005 Log N = -1.32 ML + 6.67 R2 = 0.944 0.00 1.00 2.00 3.00 2.8 3.8 4.8 ML log N 12/10/2005 - 20/10/2005 Log N = -1.10 ML + 5.75 R2 = 0.928 0.00 1.00 2.00 3.00 2.0 3.0 4.0 5.0 6.0 ML log N 20/10/2005 - 21/11/2005 Log N = -1.83 ML + 8.45 R2 = 0.995 0.00 1.00 2.00 3.00 2.0 3.0 4.0 5.0 ML log N
Fig. 5. Magnitude – frequency relation for the Samos area for back-ground seismicity (top), foreshock period (middle) and aftershock period (down). N = cumulative number of events, ML= local
mag-nitude or equivalent duration magmag-nitude. R as in Fig. 2.
The b-value changes significantly from one time interval to the other but for a given time interval it varies depend-ing on the method of calculation (Table 2). The signifi-cance of b-value changes were tested by applying the test
proposed by Utsu (1999) who calculates the probability P that the two samples come from the same population. For the time period of declustered background seismicity values of bls=1.32 and bml=0.91 were found by the least-squares
and maximum likelihood approaches, respectively. The b-values of bls=1.10 and bml=1.45 found for the foreshock
pe-riod, however, changed significantly with respect to the val-ues found for background seismicity. This is a contradic-tory result which indicates that according to least-squares b decreases but according to maximum likelihood b increases with respect to the values calculated for the background seis-micity. To examine further these contradiction values of b were determined for the time interval which covers the main phase of foreshock activity, which extents from 12 October 2005 up to the generation of the second strong shock of 17 October 2005 inclusive. Values of bls=0.60 and bml=0.92
were found which implies that b again dropped significantly according to least-squares approach but it remained nearly constant according to maximum likelihood approach. The relatively high b-values found for the entire foreshock period with respect to the main phase of foreshock activity can be interpreted by that the two strong foreshocks of 17 October 2005 produced their own aftershocks which are incorporated in the entire foreshock period.
Both approaches clearly indicate that in the phase of af-tershocks the b-value is significantly increased with respect to the main foreshock period as well as with respect to the entire foreshock period. This result is of great importance for the discrimination between the foreshock phase and af-tershock phase of a particular earthquake sequence. To show that such a discrimination becomes possible within one or two days after the strong shock and that the strong shock is the mainshock of the sequence we calculated the b-value only for the first 24-h and for the first 48-h following the oc-currence of the strong shock of 20 October 2005. Values of
bls=1.34, bml=1.74 and bls=1.65, bml=1.74 were found for
the first 24-h and for the first 48-h, respectively. These val-ues are again significantly higher than those found for the foreshock period.
5 Conclusions
Statistical properties of the seismic sequence of October– November 2005 in the Samos area, East Aegean Sea, were studied with the aim to show how it is possible to estab-lish criteria for (a) the rapid recognition of both the ongo-ing foreshock activity and the mainshock, and (b) the rapid discrimination between the foreshock and aftershock phases of activity. It has been shown that before the mainshock of 20 October 2005, foreshock activity is not recognizable in the standard earthquake catalogue produced by the routine procedure of daily seismic analysis and cataloguing of the National Observatory of Athens. However, a detailed exami-nation of the records in the SMG station, which is the closest
G. A. Papadopoulos et al.: East Aegean 2005 seismic activity and earthquake prediction 901 to the activated area, revealed that hundreds of small shocks
not listed in the standard catalogue were recorded in the time interval from 12 October 2005 up to 21 November 2005. The production of reliable relations between seismic signal dura-tion and duradura-tion magnitude for earthquakes included in the standard catalogue, made it possible to use signal durations in SMG records and to determine duration magnitudes for 2054 small shocks not included in the standard catalogue. In this way a new catalogue with magnitude determination for 3027 events was obtained while the standard catalogue con-tains 1025 events for the time interval from 17 October to 21 November 2005. At least 55 of them occurred from 12 Oc-tober 2005 up to the occurrence of the two strong foreshocks of 17 October 2005. This implies that foreshock activity de-veloped a few days before the strong shocks of 17 October 2005 but it escaped recognition by the routine procedure of seismic analysis. This case makes a good example on how single station records may increase drastically the number of events recorded and how hidden foreshocks can be revealed. The onset of the foreshock phase of activity is recogniz-able by the significant increase of the mean seismicity rate. In fact, the mean background seismicity rate in the declus-tered catalogue of the period from 1996 to 2005 inclusive is only 0.07 events/day while the mean seismicity rate during the early foreshock phase from 12 October 2005 to 17 Octo-ber 2005 increased to 6 events/day. The foreshock sequence exhibits an exponential increase of the number of events with time but the last two days before the mainshock a relative drop of foreshock activity is noted.
According to the least-squares approach the b-value of the magnitude-frequency relation dropped significantly during the foreshock activity with respect to the b-value prevailing in the declustered background seismicity. However, the max-imum likelihood approach does not indicate such a drop of b. This contradictory result deserves to be examined as for the factors that control it. One possible cause of it is that the cat-alogue of mainshocks, produced by declustering the initial catalogue, does not entirely satisfies the Gutenberg-Richter law as shown by Lombardi (2003). The b-value found for the aftershocks that followed the strong shock of 20 October 2005 is significantly higher than in foreshocks. The signif-icant aftershock-foreshock difference in b-value is valid not only if the entire aftershock sequence is considered but also if only the segment of aftershocks that occurred within the first 24-h or the first 48-h after the mainshock of 20 Octo-ber 2005 are taken into account. This difference in b-value should be examined further in other foreshock-aftershock se-quences because it could be used as a diagnostic of the main-shock occurrence only a few hours after its generation.
Acknowledgements. This paper is part of the research project
Seismic eArly warning For EuRope (SAFER) supported by the CEC, contract number 036935, 6th Framework Programme, FP6-2005-Global-4, Reduction of seismic risks.
Edited by: M. Contadakis Reviewed by: A. Zavyalov
References
Aki, K.: Maximum likelihood estimate of b in the formula log N=a-bM and its confidence limits, Bull. Earthq. Res. Inst., 43, 237– 239, 1965.
Gardner, J. K. and Knopoff, L.: Is the sequence of earthquakes in Southern California, with aftershocks removed, Poissonian, Bull. Seismol. Soc. Am., 64, 1363–1367, 1974.
Gutenberg, B. and Richter, C.: Frequency of earthquakes in Cali-fornia, Bull. Seismol. Soc. Am., 34, 185–188, 1944.
Hainzl, S., Z¨oller, G., and Kurths, J.: Similar power laws for foreshock and aftershock sequences in a spring-block model for earthquakes, J. Geophys. Res., 104, 7243–7253, 1999.
Jones, L. M.: Foreshocks (1966–1980) in the San Andreas System, California, Bull. Seismol. Soc. Am., 74, 1361–1380, 1984. Jones, L. M. and Molnar, P.: Some Characteristics of Foreshocks
and their Possible Relationship to Earthquake Prediction and Pre-monitory Slip on Faults, J. Geophys. Res., 84, 3596–3608, 1979. Kagan, Y. and Knopoff, L.: Statistical study of the occurrence of shallow earthquakes, Geophys. J. R. Astr. Soc., 55, 67–86, 1978. Latoussakis, J. and Stavrakakis, G. N.: Times of increased probabil-ity of earthquakes of ML≥5.5 in Greece diagnosed by algorithm M8, Tectonophysics, 210, 315–326, 1992.
Lombardi, A. M.: The maximum likelihood estimator of b-value for mainshocks, Bull. Seismol. Soc. Am., 93, 2082–2088, 2003. Mogi, K.: The fracture of a semi-infinite body caused by an inner stress origin and its relation to the earthquake phenomena (sec-ond paper), Bull. Earthq. Res. Inst., 41, 595–614, 1963. Molchan, G. M., Kronrod, T. L., and Nekrasona, A. K.:
Immedi-ate foreshocks: time variation of the b-value, Phys. Earth Planet. Inter., 111, 229–240, 1999.
National Observatory of Athens, Institute of Geodynamics (NOAGI), Earthquake Catalogue, http://www.gein.noa.gr, 2006. Papadopoulos, G. A., Drakatos, G., and Plessa, A.: Foreshock Ac-tivity as a precursor of strong earthquakes in Corinthos Gulf, Central Greece, Phys. Chem. Earth, 25, 239–245, 2000. Papanastassiou, D.: Detectability and location of the determination
of source parameters of the seismological networks of NOA, PhD thesis, University of Athens, 1989.
Papazachos, B.: Foreshocks and earthquake prediction, Tectono-physics, 28, 213–226, 1975.
Scholz, C. H.: The frequency-magnitude relation of microfracturing in rock and its relation to earthquakes, Bull. Seismol. Soc. Am., 58, 399–415, 1968.
Sobolev, G. A.: Precursory Phases of Large Kamchatkan Earth-quakes, Volcanol. Seismol., 21, 497–509, 2000.
Utsu, T.: A method in determining the value of b in a formula logn =a-bM showing the magnitude frequency for earthquakes, Geo-phys. Bull. Hokkaido Univ., 13, 99–103, 1965.
Utsu, T.: A statistical significance test for the difference in b-value between two earthquake groups, J. Phys. Earth, 14, 37–40, 1966. Utsu, T.: Representation and analysis of the earthquake size distri-bution: a historical review and some new approaches, Pure Appl. Geophys., 155, 509–535, 1999.