HAL Id: hal-00296318
https://hal.archives-ouvertes.fr/hal-00296318
Submitted on 22 Aug 2007
HAL is a multi-disciplinary open access
archive for the deposit and dissemination of
sci-entific research documents, whether they are
pub-lished or not. The documents may come from
teaching and research institutions in France or
abroad, or from public or private research centers.
L’archive ouverte pluridisciplinaire HAL, est
destinée au dépôt et à la diffusion de documents
scientifiques de niveau recherche, publiés ou non,
émanant des établissements d’enseignement et de
recherche français ou étrangers, des laboratoires
publics ou privés.
depletion
W. R. Simpson, R. von Glasow, K. Riedel, P. Anderson, P. Ariya, J.
Bottenheim, J. Burrows, L. J. Carpenter, U. Frieß, M. E. Goodsite, et al.
To cite this version:
W. R. Simpson, R. von Glasow, K. Riedel, P. Anderson, P. Ariya, et al.. Halogens and their role in
polar boundary-layer ozone depletion. Atmospheric Chemistry and Physics, European Geosciences
Union, 2007, 7 (16), pp.4375-4418. �hal-00296318�
www.atmos-chem-phys.net/7/4375/2007/ © Author(s) 2007. This work is licensed under a Creative Commons License.
Chemistry
and Physics
Halogens and their role in polar boundary-layer ozone depletion
W. R. Simpson1, R. von Glasow2, K. Riedel3, P. Anderson4, P. Ariya5, J. Bottenheim6, J. Burrows7, L. J. Carpenter8,
U. Frieß9, M. E. Goodsite10, D. Heard11, M. Hutterli4, H.-W. Jacobi17, L. Kaleschke12, B. Neff13, J. Plane11, U. Platt9, A. Richter7, H. Roscoe4, R. Sander14, P. Shepson15, J. Sodeau16, A. Steffen6, T. Wagner9,14, and E. Wolff4
1Geophysical Institute and Department of Chemistry, University of Alaska Fairbanks, Fairbanks, AK, 99775-6160, USA 2School of Environmental Sciences, University of East Anglia, Norwich, NR4 7TJ, UK
3National Institute of Water and Atmospheric Research, Private Bag 14–901, Wellington, New Zealand 4British Antarctic Survey, High Cross, Madingley Road, Cambridge CB3 0ET, UK
5McGill University, Canada
6Environment Canada, Toronto, Canada
7Institute of Environmental Physics, University of Bremen, Bremen, Germany 8Dept. of Chemistry, University of York , York YO10 5DD, UK
9Institute for Environmental Physics, University of Heidelberg, Germany
10University of Southern Denmark, Department of Chemistry and Physics, Campusvej 55 DK5230 Odense M, Denmark 11School of Chemistry, University of Leeds, Leeds, LS29JT, UK
12Center for Marine and Atmospheric Research , Institute of Oceanography, University of Hamburg, Bundesstrasse 53, 20146
Hamburg, Germany
13NOAA/Earth System Research Laboratory, Boulder CO, USA
14Air Chemistry Department, Max-Planck Institute of Chemistry, PO Box 3060, 55020 Mainz, Germany 15Purdue Climate Change Research Center, 503 Northwestern Ave. West Lafayette, IN 47907, USA 16Department of Chemistry, University College Cork, Ireland
17Alfred Wegner Institute (AWI) for Polar and Marine Research, Bremerhaven, Germany
Received: 5 March 2007 – Published in Atmos. Chem. Phys. Discuss.: 29 March 2007 Revised: 30 July 2007 – Accepted: 16 August 2007 – Published: 22 August 2007
Abstract. During springtime in the polar regions, unique
photochemistry converts inert halide salt ions (e.g. Br−) into reactive halogen species (e.g. Br atoms and BrO) that de-plete ozone in the boundary layer to near zero levels. Since their discovery in the late 1980s, research on ozone deple-tion events (ODEs) has made great advances; however many key processes remain poorly understood. In this article we review the history, chemistry, dependence on environmental conditions, and impacts of ODEs. This research has shown the central role of bromine photochemistry, but how salts are transported from the ocean and are oxidized to become reactive halogen species in the air is still not fully under-stood. Halogens other than bromine (chlorine and iodine) are also activated through incompletely understood mechanisms that are probably coupled to bromine chemistry. The main consequence of halogen activation is chemical destruction of ozone, which removes the primary precursor of atmospheric oxidation, and generation of reactive halogen atoms/oxides that become the primary oxidizing species. The different
re-Correspondence to: W. R. Simpson ([email protected])
activity of halogens as compared to OH and ozone has broad impacts on atmospheric chemistry, including near complete removal and deposition of mercury, alteration of oxidation fates for organic gases, and export of bromine into the free troposphere. Recent changes in the climate of the Arctic and state of the Arctic sea ice cover are likely to have strong ef-fects on halogen activation and ODEs; however, more re-search is needed to make meaningful predictions of these changes.
1 Introduction, history, and chemical mechanisms
1.1 Introduction
The Arctic and Antarctic, geographically remote as they may be, have a significant impact on the global atmosphere. They play an important role in the atmospheric and oceanic circu-lation and are regions where unusual chemical processes take place. The glacial ice in polar regions represents an excep-tional archive of atmospheric composition histories, which
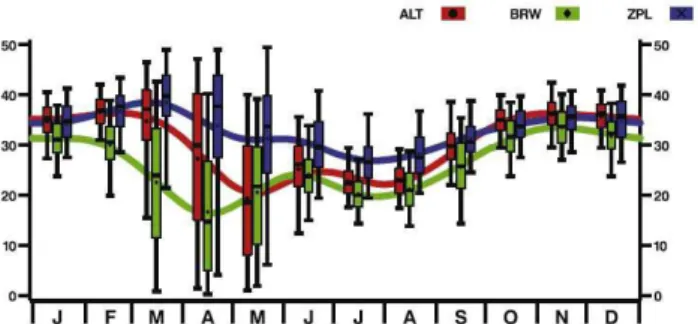
Fig. 1. Box and whisker plots showing 9 years of observations of
O3mole fractions in (nmol/mol) at Alert (red), Barrow (green), and
Zeppelinfjellet (also called Ny- ˚Alesund in this paper) (blue). The smoothing curves were generated by LOWESS, a nonparametric technique used here to illustrate the seasonal cycles for the three stations (Cleveland and Devlin, 1988; Pe˜na et al., 2000). Lower and upper whiskers are the 5th and 95th percentiles, while the bottom and top of boxes are the 25th and 75th percentiles, respectively. Horizontal lines inside the boxes are monthly median values for the 9-year period, and the symbols are monthly means. Reprinted from Bottenheim and Chan (2006) with permission from the American Geophysical Union (AGU).
can be extracted by ice coring. The Arctic, in particular, is in-fluenced by pollution affecting the biosphere and indigenous people, for example by deposition of mercury and persistent organic pollutants (POPs).
The atmospheres of the Arctic and Antarctic are unique. Dominated by cold temperatures, stable stratification of the boundary layer and unusual light conditions, they are an exceptional natural laboratory to study atmospheric pro-cesses. The Antarctic atmosphere is pristine, dry and iso-lated from the rest of the atmosphere by the surrounding Southern Ocean and the polar vortex. The Arctic, however, is strongly influenced by seasonal atmospheric transport and anthropogenic emissions due to its proximity to landmasses and highly industrialized countries. Lifetimes of chemical species are long in polar environments, especially during the dark months of winter with a lack of photochemistry. The winter/spring Arctic pollution phenomenon, known as Arctic haze (e.g. Mitchell, 1957; Schnell, 1983; Barrie et al., 1989; Shaw, 1995; Stohl, 2006), is enhanced by inefficient disper-sal of pollutants and slow removal rates (Barrie, 1986).
Large areas in the polar regions are perennially covered by ice, providing an invaluable paleoarchive in the form of glacial ice cores (Legrand, 1997; Legrand and Mayewski, 1997; EPICA community members, 2004). Understanding polar atmospheric chemistry is essential for the interpretation of ice cores and to reconstruct past variations in atmospheric composition.
Interest in Antarctic atmospheric chemistry intensified after it was postulated that industrially produced halocar-bons (particular chlorofluorocarhalocar-bons, CFCs) could cause
se-vere depletion in stratospheric ozone (Molina and Rowland, 1974). In the mid 1980s, the springtime stratospheric ozone hole over Antarctica was discovered (Farman et al., 1985). The ozone hole involves heterogeneous reactions on polar stratospheric clouds that lead to chlorine activation (Solomon et al., 1986).
Like the discovery of stratospheric ozone depletion, the observation of ozone depletion events within the po-lar boundary layer in the mid-1980s came as a surprise. Episodes of low surface ozone concentrations were measured at Barrow, Alaska (71◦N, 157◦W, Oltmans, 1981; Oltmans and Komhyr, 1986) and at Alert, northern Canada (82.5◦N, 62.3◦W, Bottenheim et al., 1986; Barrie et al., 1989) in late winter/early spring. Ozone levels drop from typical levels of >30 nmol/mol to below 10 nmol/mol, or even below de-tection limit (Oltmans, 1981; Barrie et al., 1988). These episodes were called “ozone depletion events” (ODEs, Olt-mans et al., 1989). After being discovered in the Arctic, ODEs were also observed in the Antarctic boundary layer (Kreher et al., 1996, 1997; Wessel et al., 1998) prompting a variety of new field programs and satellite investigations in the Antarctic. Interestingly, ozone depletions were measured in 1958 at Halley, but the data were not interpreted until the late 1990s. For an historic overview, see Sect. 1.2.
Early on, halogens were found to be involved in the ozone depletion process, since strong ozone depletion events co-incided with high levels of filterable bromine (f-Br) (Barrie et al., 1988). A bromine radical-catalyzed cycle involving Br and BrO was suggested (Barrie et al., 1988; Fan and Jacob, 1992; McConnell et al., 1992; Hausmann and Platt, 1994) with BrO+BrO→2Br+O2 as the central reaction (for a
de-tailed discussion of the chemical mechanism see Sect. 1.3). In contrast, stratospheric ozone depletion is dominated by chlorine chemistry (ClO self reaction forming the Cl2O2
dimer) and halogen oxide cross reactions (Yung et al., 1980; McElroy et al., 1999).
Because ozone is the precursor for most atmospheric ox-idizers, it generally controls the atmospheric oxidation po-tential. However, during ozone depletion events, ozone-dominated oxidation pathways become less important and unique halogen-dominated oxidation pathways become most important. These new pathways alter lifetimes of species and change their fates in the environment. A key example of this effect is that halogens efficiently oxidize gas-phase mer-cury and cause it to be transferred from the atmosphere to the snow, probably enhancing its bioavailability. This impor-tant topic is briefly discussed in Sect. 4.1 and in more detail in an accompanying article (Steffen et al., 2007). Another example is volatile organic compounds (VOCs) that get very efficiently oxidized by the Cl atom (see Sects. 2.2 and 4.2).
Ozone depletion episodes are most commonly observed during springtime, March to May in the Arctic (Tarasick and Bottenheim, 2002; Bottenheim and Chan, 2006) and August to October in the Antarctic (Kreher et al., 1997; Roscoe et al., 2001; Frieß et al., 2004; Jones et al., 2006), when sunlight
re-turns to the high latitudes, but temperatures are still low (be-low −20◦C). Most observations of ODEs have been recorded
from coastal sites when the ocean is frozen and snow cov-ered, although leads and polynyas dynamically open expos-ing salt water and freeze over again. A statistical analysis of the ozone seasonal cycle at Alert, Barrow, and Ny- ˚Alesund (79◦N, 12◦E) is shown in Fig. 1. For a map of all sites de-scribed in this paper and their geographic coordinates, see the electronic supplement (http://www.atmos-chem-phys.net/7/ 4375/2007/acp-7-4375-2007-supplement.pdf). In this fig-ure, ODEs appear as decreases in the smooth seasonal cy-cle during March, April, and May and enhanced variability during these months. Typical unaveraged data show either high (∼30–40 nmol/mol) ozone or near zero values, depend-ing upon whether the site is experiencdepend-ing a background or an ODE air mass.
The most severe and temporally extensive ODEs have been observed over the frozen Arctic Ocean. Measurements performed on ice floes in the Arctic during ice camp SWAN northwest of Ellesmere Island (Hopper et al., 1994) and Nar-whal, 160 km North of Alert (Hopper et al., 1998) found that ozone levels were regularly very close to zero. Ship-borne measurements performed in the Arctic in 2005 confirm this observation (Jacobi et al., 2006). Hopper et al. (1994) re-ported that ozone was undetectable (<0.4 nmol/mol) during 40% of the time at polar sunrise during ice camp SWAN. During the flight campaign TOPSE, Ridley et al. (2003) ob-served large areas over the Arctic with low ozone levels and Zeng et al. (2003) estimate that 20% of the area of the north-ern high latitudes are influenced by ODEs. This finding is in agreement with satellite measurements that show large and persistent areas of elevated BrO in spring over the Arctic (Richter et al., 1998c; Wagner and Platt, 1998a). Recent anal-ysis of historic ozone data from 1958 showed depleted ozone also in the Antarctic boundary layer in the middle of winter (Roscoe and Roscoe, 2006), suggesting a different chemical mechanism since no sunlight is available for photolytic reac-tions.
The main source of reactive bromine species (Br and BrO) is bromide from sea salt that is released via a series of photo-chemical and heterogeneous reactions known as the bromine explosion (see Sect. 1.3). Biogenic oceanic sources have been discussed from the early days (Barrie et al., 1988) but are probably of smaller importance as bromine source for po-lar regions. Biogenic halogen sources may be of more impor-tance to upper tropospheric chemistry, as has been recently considered (Yang et al., 2005; Salawitch, 2006). Consider-ing boundary-layer halogen activation, it is still unclear how bromide from sea salt is released to the gas phase. Interac-tions between snow/ice surfaces and the atmosphere proba-bly play an important role. Sea-ice surfaces, aerosol, brine, and frost flowers – delicate ice crystals that grow out of the vapor phase and transport concentrated brines of young sea-ice – have raised a lot of interest as bromine source in recent investigations. However, the question remains unsolved so
far and is discussed in detail in Sect. 3.1 of this article. Ozone depletion events occur mostly over the frozen ocean, as supported by aircraft (Ridley et al., 2003), ground based ice camp (Hopper et al., 1994, 1998), and ship-borne observations (Jacobi et al., 2006). Satellite observations of BrO also indicate that it is present mostly over the frozen ocean, thus indirectly indicating O3 depletion over frozen
oceans (Richter et al., 1998c; Wagner and Platt, 1998a; Wag-ner et al., 2001). However, depleted air masses can also be transported to lower latitudes or over land. When discussing ODEs, it is important to distinguish between advection of ozone depleted air masses to a measuring site (meteorology controlled), local chemical ozone depletion (chemistry con-trolled) and a combination of the two.
Section 3.2 contains further discussion of the relation-ship between boundary layer structure and ozone depletion episodes. Transport-controlled ODEs can be very rapid in their onset (timescale of minutes, Morin et al., 2005), as-sociated with significant O3 loss and wind speed and
di-rection changes (Jones et al., 2006), while chemically con-trolled ODEs appear normally much more gradual and are not as intense (Jones et al., 2006). However, some fast O3
depletions (∼7 h) have been linked to local chemistry (Ja-cobi et al., 2006). The duration of ODEs at coastal sites is typically between 1–3 days, depending on meteorology. During ALERT2000, a 9-day period with basically no ozone occurred, one of the longest ODEs ever recorded at Alert (Bottenheim et al., 2002; Strong et al., 2002). In April 1992 during ice camp SWAN, Hopper et al. (1994) detected ODEs most of the time with ozone at or below the detection limit (0.4 nmol/mol) more than 40% of the 18 day measurement period. From the analysis of historical ozonesonde records, Tarasick and Bottenheim (2002) concluded that springtime surface temperatures below −20◦C seem to be required for
the occurrence of ODEs. However, observations of BrO at above freezing temperatures over salt lakes and lake beds indicate that cold temperatures are not a prerequisite for halogen activation (e.g. Hebestreit et al., 1999, see also Sect. 2.1.3). The mechanism by which halogen activation occurs at salt lakes may be subtly different from that of polar halogen activation, which does seem to be enhanced by cold temperatures (Tarasick and Bottenheim, 2002). The end of an ODE is largely determined by meteorology since vertical or horizontal mixing with O3-rich air is required to replenish
O3. Chemical O3production is generally not sufficient for a
recovery (due to low NOx).
The frequency of ODEs at Arctic and some Antarctic sta-tions was analyzed from historical ozonesonde records by Tarasick and Bottenheim (2002). ODEs occurred frequently at Alert, Resolute, and Eureka (Barrow was not considered in this study, but also shows frequent ODEs). Other Arc-tic stations such as Ny- ˚Alesund and Churchill experienced fewer ODEs probably due to less nearby sea ice coverage and warmer conditions.
Table 1. Major field campaigns related to ODEs in the Arctic and Antarctic. The following are acronyms in the table: Arctic Gas and Aerosol
Sampling Program (AGASP), Polar Sunrise Experiment (PSE), Tropospheric Ozone Production during the Spring Equinox (TOPSE), NI-trogen Cycle and Effects on the oxidation of atmospheric trace species at high latitudes (NICE), Out On The Ice (OOTI), Chemistry of the Antarctic Boundary Layer and the Interface with Snow (CHABLIS). ARCTOC was an ozone depletion campaign in Ny- ˚Alesund, and LEADX involved experiments at an open lead near Barrow. Some campaigns do not yet have an overview paper and thus do not have a reference.
Campaign Location year Reference
AGASP-II Arctic Ocean 1986 Mickle et al. (1989) PSE 88 Alert, Canada 1988 Bottenheim et al. (1990) AGASP-III Barrow, Alaska 1989 Sturges and Shaw (1993)
PSE 92 Alert, Canada 1992 Barrie et al. (1994)
AGASP-IV Arctic Ocean 1992 Davidson and Schnell (1993) PSE 94 Alert, Canada 1994 Hopper et al. (1998)
ARCTOC Ny- ˚Alesund, Svalbard 1995, 1996 Platt and Lehrer (1996); Barrie and Platt (1997) PSE 98 Alert, Canada 1998
ALERT2000 Alert, Canada 2000 Bottenheim et al. (2002) TOPSE North American Arctic 2000 Atlas et al. (2003)
NICE Ny- ˚Alesund, Svalbard 2001 Beine et al. (2003) OOTI Alert, Canada 2004, 2005 Morin et al. (2005) LEADX Barrow, Alaska 2004, 2005
CHABLIS Halley, Antarctica 2004 Jones et al. (2007)1
1Jones, A. E., W., W. E., Salmon, R. A., and Bauguitte, S. J.-B.: Chemistry of the Antarctic Boundary Layer and the Interface with Snow: An overview of the CHABLIS campaign,
Atmos. Chem. Phys. Discuss., in preparation, 2007.
400 m (Mickle et al., 1989; Leaitch et al., 1994; Anlauf et al., 1994; Gong et al., 1997; Tarasick and Bottenheim, 2002; Bottenheim et al., 2002; Strong et al., 2002; Tackett et al., 2007), but the depth can increase during the season, from 100–200 m in early spring to as high as 1-2 km altitude in late spring (Bottenheim et al., 2002; Ridley et al., 2003). Solberg et al. (1996) found that during some episodes in the Norwegian Arctic ozone was nearly completely depleted up to 2 km altitude. DOAS measurements at Alert (H¨onninger and Platt, 2002), Hudson Bay (H¨onninger et al., 2004b), and Neumayer, Antarctica (Frieß et al., 2004) showed that BrO-enriched air is often found at the surface but can be lifted to elevations of up to 4 km (Frieß et al., 2004).
This review article presents our current knowledge on tro-pospheric ozone depletion in the Arctic and Antarctic. It combines a historical review of the discovery of the phe-nomenon (in Sect. 1.2) with the most recent laboratory, mod-eling, remote sensing, and field results. Chemical reaction mechanisms for bromine, chlorine and iodine are discussed in Sect. 1.3. Methods involved in the study of ODEs are discussed in Sect. 1.4, while observations of halogens and their roles in ODEs are discussed in Sect. 2. The influence of sea ice, boundary layer meteorology and photochemistry on ODEs is discussed in Sect. 3, while the impacts of ODEs on mercury deposition, ice cores, the free troposphere and other aspects of polar chemistry are described in Sect. 4. Open questions and future scenarios of ozone depletion events are highlighted in Sect. 5 of this article.
1.2 Historic overview of the discovery of ODEs
The first reports on surface ozone depletion in the Arctic date from the 1980s. In a paper on surface ozone mea-surements in clean air, Oltmans (1981) noted that the great-est day-to-day changes in O3occurred at Barrow during the
spring. Similarly, Bottenheim et al. (1986) reported a sig-nificant (and quite variable) decrease in O3 levels at Alert
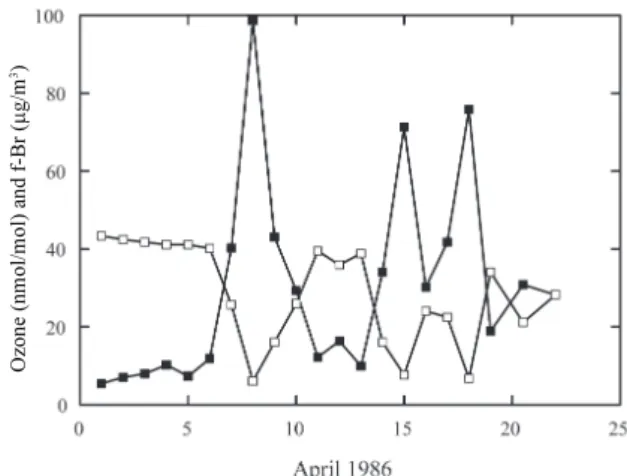
without being able to explain these observations. The key to the understanding of the Arctic surface ozone depletion came shortly afterwards. During the second AGASP campaign (Arctic Gas and Aerosol Sampling Program; see Table 1 for an overview of major field campaigns related to ODEs) in 1986, ozone was sampled together with Br collection on cel-lulose filters. Atmospheric bromine was chosen to be stud-ied because of another curious observation in spring, the oc-currence of “excess of filterable bromine” (f-Br), bromine that could not be explained from windblown dust, sea salt, or automobile fuel additives (Berg et al., 1983; Sturges, 1990). Ozone and f-Br data from spring 1986 at Alert (Fig. 2) show the now classical strong negative correlation (Barrie et al., 1988). Barrie et al. (1988) hypothesized that the chemi-cal mechanism of O3depletion involves a bromine-catalyzed
chain reaction and that photolysis of bromoform (CHBr3)
could be the source of Br atoms. They speculated that hetero-geneous chemistry on ice surfaces could be involved. In sub-sequent years knowledge advanced through intensive field campaigns as well as laboratory and modeling studies. A chronology of major field campaigns in the Arctic follows (Table 1).
The first field campaign dedicated to the study of ODEs was the Polar Sunrise Experiment 1988, PSE88, see Botten-heim et al. (1990) at Alert, Canada. The PSE88 campaign involved studies that investigated the bromoform photolysis hypothesis proposed by Barrie et al. (1988). Indeed, during PSE88 a strong negative correlation between O3and CHBr3
was observed, results that were confirmed during the sec-ond Polar Sunrise Experiment at Alert in 1992 (PSE92, Yok-ouchi et al., 1994). Similar correlations were observed at Barrow during the AGASP-III experiment in 1989 (Sturges and Shaw, 1993). However, CHBr3photochemistry as cause
for O3 depletion was ruled out after absorption spectra of
CHBr3were obtained and spectroscopic data were analysed
(Moortgat et al., 1993). Using this cross section, the pho-tolytic lifetime of bromoform under Arctic springtime con-ditions is ∼100 days (Simpson et al., 2002), indicating that very little of the reactive bromine could come from the rela-tively low observed concentrations of bromoform (Yokouchi et al., 1996). Nevertheless, a truly satisfactory explanation for the strong CHBr3-O3correlation was not found. It has
been proposed that reactive halogen chemistry during ODEs could in fact be producing halocarbon gases (Carpenter et al., 2005b), possibly explaining high halocarbon gas abundances during ODEs (see Sect. 3.3.2). Based on trajectory calcula-tions and satellite images Sturges and Shaw (1993) deduced that high levels of CHBr3were due to recent passage (<24 h)
of the air over open leads in the ice. This implied that O3
depletion also must have occurred within the same time pe-riod. Another important result from AGASP-III, which was largely an aircraft campaign, was that O3depletion in the
ma-rine boundary layer was observed commonly over the Arctic Ocean (Sheridan et al., 1993). They also confirmed that f-Br was mostly particlulate Br, and not gas-phase HBr (Sturges and Shaw, 1993; Sturges et al., 1993).
During PSE92 (Barrie et al., 1994), long-path DOAS mea-surements confirmed for the first time the role of BrO (Haus-mann and Platt, 1994) and Jobson et al. (1994) showed that Cl atom chemistry, although not driving O3depletion, was
taking place, confirming speculations by Kieser et al. (1993). During an 18-day study at ice camp SWAN, O3was
de-pleted over the Arctic ocean for most of the time and only in-creased due to turbulent mixing of ozone-rich air from aloft (Hopper et al., 1994). Ingenious methods were designed and employed to measure “photolysable bromine” (Impey et al., 1997b) and in-situ BrO (Mihele and Hastie, 1998). Further-more, continuing efforts were made to determine low molec-ular weight carbonyl compounds (formaldehyde HCHO, ac-etaldehyde CH3CHO, acetone CH3COCH3), as they were
thought to play an important role in the cycling of reactive bromine (Barrie et al., 1988). During PSE92, de Serves (1994) made on-site measurements and found HCHO lev-els much higher than predicted by Barrie et al. (1988), based on a gas phase production mechanism. Studies using the DNPH (2,4-Dinitrophenylhydrazine) technique (Shepson et al., 1996) yielded similar high concentrations, which were
Fig. 2. The first published observation of the anticorrelation
be-tween ozone and filterable bromine, measured at Alert. Filled squares show filterable Br (f-Br) in ng/m3, from 24 h filter pack, open squares show daily averaged ozone in nmol/mol (ppbV). Reprinted by permission from Macmillan Publishers LTD: Nature, Barrie et al. (1988), copyright 1988.
explained during PSE98, when it was discovered that gas phase HCHO was emitted from the snow (Fuhrer et al., 1996; Hutterli et al., 1999; Sumner and Shepson, 1999). At the same time, Honrath et al. (1999) discovered at Summit that NOxwas produced in sunlit snow. These unexpected
discov-eries of active snow pack chemistry became a major topic of research, giving rise to summer projects at Summit in 1999, 2000, 2001, 2002, 2003, 2004, and 2006, the ALERT2000 campaign, and the South Pole campaigns in 1998, 2000, and 2003 (for further information see the accompanying snow photochemistry review, Grannas et al., 2007). It was shown that O3, once in the snow pack, is short lived (Bottenheim
et al., 2002), that molecular halogens (Br2, BrCl) are
pro-duced in the snow (Foster et al., 2001) along with several other species like NOx, HONO and VOCs, and that oxidized
mercury (Hg(II)) can be photo-reduced in the snow leading to re-emission of elemental Hg into the atmosphere (see also the accompanying mercury review, Steffen et al. (2007).
While many discoveries have first been made in the Arc-tic, these processes have subsequently been observed to vary-ing degrees in the Antarctic. Boundary layer O3 depletion
in the Antarctic was first observed in the mid-1990s (Kre-her et al., 1996, 1997; Wessel et al., 1998) also reporting the presence of BrO (Kreher et al., 1997). Since then, many more Antarctic field (Rankin et al., 2002; Wolff et al., 2003; Frieß et al., 2004; Jones et al., 2006; Kalnajs and Avallone, 2006) and satellite studies (Wagner and Platt, 1998a; Richter et al., 1998c; Hegels et al., 1998a; Kaleschke et al., 2004) have been performed. Analysis of historical surface ozone data from Halley has shown that ozone depletion events were observed as early as 1957/8 during the International Geophysical Year (Roscoe and Roscoe, 2006).
Fig. 3. Key reactions for the XO self reaction ozone destruction reaction cycle.
1.3 Key reactions and cycles
In this section, we discuss key chemical reactions and re-action cycles involved in ozone depletion chemistry. This discussion is not meant to be a complete discussion of all halogen chemistry; the interested reader is referred to recent reviews on this topic (Wayne et al., 1995; Platt and Janssen, 1995; Platt and Moortgat, 1999; Platt and H¨onninger, 2003; von Glasow and Crutzen, 2003, 2007). The overall catalytic ozone destruction mechanism involves halogen atoms (de-noted by X, Y, where X, Y=Cl, Br, or I) that cycle between their atomic forms and their oxides, XO. Halogen atoms are formed from precursors such as Br2, BrCl, HOBr, etc., as
discussed below. The typical fate of an atomic halogen radi-cal is to react with ozone, forming a halogen oxide molecule.
X + O3→XO + O2 (R1)
Typical conversion times (at 40 nmol/mol O3) via
Reac-tion (R1) for Cl are around 0.1 s and of the order of 1 s for Br and I atoms. Halogen atoms are regenerated in a series of reactions including photolysis of XO, which is of importance for X=I, Br and to a minor extent Cl,
XO + hν → X + O (J2)
For this reaction, typical springtime Arctic daytime values of Eq. (J2) are ∼3×10⁻⁵s−1, ∼4×10⁻²s−1, and 0.2 s−1for
X=Cl, Br, I, respectively. Often the photolysis of halogen oxides is the fastest decay of those species, thus the parti-tioning of X/XO is controlled by a balance of Reactions (R1) and (J2). Because of this rapid cycling, the sum of Br+BrO is called the BrOxfamily. For bromine, during the day and
at high ozone, BrO is the prevalent BrOxspecies; however at
low ozone (<1 nmol/mol), calculations suggest that Br can become more abundant than BrO.
For catalytic destruction of ozone to occur, the XO must recycle to X atoms without production of ozone. The pri-mary reactions that destroy ozone are the reactions with other halogen oxides or HO2. In polar regions, the halogen oxide
reactions are most important, so we consider them first. The self reaction of halogen oxides reforms halogen atoms or di-halogens, which rapidly photolyse leading again to two X atoms,
XO + XO → 2X + O2
→X2+O2 (R3)
In the case of XO=BrO the rate constant k3=3.2×10⁻¹²cm3molec−1s−1 (Atkinson et al., 2006).
The reaction sequence that combines (R1) and (R3) using X=Br was proposed by Barrie et al. (1988) to explain Arctic ozone depletion episodes (Fig. 3),
2 × (Br + O3→BrO + O2) (R1)
BrO + BrO → 2Br + O2 (R3)
net: 2O3→3O2
Returning to the general discussion, XO may also react with a different halogen oxide, YO.
XO + YO → X + Y + O2 →XY + O2
→OXO + Y (R4)
If XY is formed, it is rapidly photolysed to X+Y. The com-bination of (R1) with (R4) forms a catalytic cycle destroy-ing ozone based upon recycldestroy-ing of the halogens by the cross Reaction (R4). Cross reactions, e.g. ClO+BrO (LeBras and Platt, 1995) and IO+BrO (Solomon et al., 1994), are about one order of magnitude faster than the reaction BrO+BrO. The cross reaction between BrO and ClO is important in stratospheric polar halogen chemistry but there is no clear evidence for the presence of significant amounts of ClO in the polar boundary layer (although ClO detection limits are relatively high, see Sect. 2.2). Recently, very high concentra-tions of IO have been observed at Halley in the Antarctic, so that the reaction BrO+IO might play a key role under these conditions (see Sect. 2.3). The channel leading to OXO gen-erally leads to short-lived products with little chemical im-pact, possibly except for the case of iodine (see discussion at end of this section).
Another ozone destruction scheme involves reactions of halogen oxides with HO2and follows the sequence:
X + O3→XO + O2 (R1)
XO + HO2→HOX + O2 (R5)
HOX + hν → X + OH (R6)
net: CO + O3→CO2+O2
In this scheme, a key reaction is XO+HO2, which is very fast
(several times 10−11cm3molec−1s−1, Knight and Crowley, 2001). An analogous reaction of XO+CH3O2is also likely
to ultimately produce HOX (Aranda et al., 1997). The above sequence oxidizes CO to CO2, but other reactions similar
to R7 involving hydrocarbons may be substituted for Reac-tion (R7).
All three of these types of reaction cycles, self reaction (XO+XO), cross reaction (XO+YO), and XO+HO2
catalyt-ically destroy ozone at times when halogen atoms and halo-gen oxides are present in the atmosphere. However, these cy-cles do not increase the reactive stock of halogen atoms and halogen oxides (X and XO). A special sequence of chemical reactions, often known as the “bromine explosion” reaction sequence, can theoretically produce reactive halogen gases. This sequence is thought be the source of the majority of reactive halogens during ozone depletion events (Fan and Ja-cob, 1992; McConnell et al., 1992; Platt and Lehrer, 1996; Tang and McConnell, 1996; Wennberg, 1999). The bromine explosion reaction sequence is
HOBr + Br−+H+ →mp H2O + Br2 (R8) Br2+hν → 2Br (R9) Br + O3 → BrO + O2 (R1) BrO + HO2 → HOBr + O2 (R5) net: H++Br−+HO2+O3 mp,hν → Br + H2O + 2O2
In this sequence, graphically depicted in Fig. 4, reactive bromine is produced by HO2oxidizing bromide (Br−), most
often from sea salt and present in solution or on ice sur-faces. The multiphase reaction involvement is shown in Re-action (R8) by the shorthand “mp”, highlighting its impor-tance. If we consider the reactions to be occurring in liq-uid brine solution, then Reaction (R8) would consist of three sub-steps, HOBr gas uptake, reaction in brine solution, and degassing of dissolved Br2 gas. The sequence is
autocat-alytic, meaning that the product is a reactive halogen species that then acts as a catalyst, further speeding up the reaction. It is important to remember that this reaction consumes HOx,
bromide (Br−) and protons (acidity), all of which are critical to subsequent discussions in this paper.
Another equivalent method to consider the bromine explo-sion chemistry is to not view the net reaction above, but in-stead consider an inventory of inactive (e.g. Br−) and
reac-tive bromine species. Reaction (R8) consumes one reacreac-tive bromine species (HOBr) but produces Br2, the precursor of
two reactive bromine species (two Br atoms). Therefore, ef-fectively, one BrOx molecule is converted into two by
ox-idizing bromide at the surface e.g. of brine or dry sea salt on sea ice or aerosol. This process leads to an exponential growth of the BrO concentration in the atmosphere, which led to the term bromine explosion (Platt and Janssen, 1995;
Fig. 4. A simplified set of bromine explosion reactions. The blue
area at the bottom is meant to represent the condensed phase (liquid brine or ice surface).
Platt and Lehrer, 1996; Wennberg, 1999). Recent laboratory investigations have shown that the above heterogeneous re-action is efficient and thus this sequence can produce BrOx
in the troposphere (e.g. Kirchner et al., 1997; Abbatt, 1994; Abbatt and Nowak, 1997; Fickert et al., 1999; Huff and Ab-batt, 2000, 2002; Adams et al., 2002).
The actual mechanism of R8 has been the subject of a number of laboratory studies (Fickert et al., 1999; Huff and Abbatt, 2000, 2002; Adams et al., 2002). These studies con-sidered the source of the halides (Cl− and Br−) to be sea
salt. In sea salt the Cl−/Br−ratio is about 650, but in
experi-ments the Cl−/Br−ratios were varied to elucidate the
mech-anism. When the concentration of Br is decreased below the sea salt ratio, an increasing fraction of BrCl is produced, while at high relative Br/Cl ratios, Br2is the preferred
prod-uct (Adams et al., 2002). The following sequence was first suggested by Vogt et al. (1996) and later laboratory experi-ments (Fickert et al., 1999) were consistent with this mecha-nism. HOBr + Cl−+H+ mp→H2O + BrCl (R10) BrCl + Br− ⇌aq Br2Cl− (R11) Br2Cl− aq ⇌Br2+Cl− (R12) net: HOBr + Br−+H+ mp→H2O + Br2 (R8)
Field evidence supporting this scheme comes from the ob-servation that both BrCl and Br2are produced from the snow
pack (Foster et al., 2001). Additionally, the Br−/Cl−ratio in
snow has been found to be very variable possibly due to these reactions removing bromide from snow and gas-phase HBr adding Br−back (Simpson et al., 2005). When all bromide is used up and the forward Reaction (R11) cannot proceed, BrCl can escape from the surface. It is then photolysed to produce reactive chlorine atoms, which then typically react
ClO S(VI) S(IV) SO2 DMS Cl ClNO2 ClNO2 HOCl ClNO3 H+, Cl -Cl2 HOCl HCl BrCl BrO HOBr Br HBr H+, Br -Br2Cl -Br2 BrCl HOBr BrNO3 BrNO2 BrNO2 Br2 Cl2
gas phase aqueous phase
hv hv hv hv hv hv hv hv hv hv hv O3 NO2 OH OH NO2 HO2 HO2 O3 Br -Br -Br -Cl-, H+ Cl-, H+ Cl -Cl -HCHO alkanes DMS H2O H2O Br-, H+ OH, NO3 H2O2, O3 DMS DMSO HOCl, HOBr N2O5 2 HNO3 Cl -Br -hv
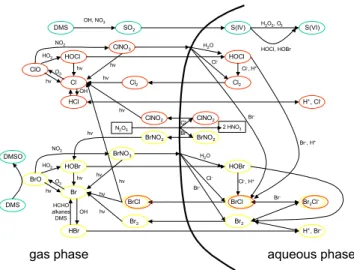
Fig. 5. Schematic diagram of the major halogen-related reactions
in the gas and aqueous phase. Refer to Atkinson et al. (2006) or Sander et al. (2003b) for reaction rate coefficients. The aqueous-phase reaction XY+Z−⇌XYZ−leads to very efficient halogen in-terconversion reactions often leading to the release of Br2. Uptake of HOBr and reaction with Br−leads to the release of Br2, the
so-called bromine explosion. Reprinted from Treatise on Geochem-istry, Vol. 4, von Glasow and Crutzen (2003), “Tropospheric halo-gen chemistry”, 21–64, Copyright (2003), with permission from El-sevier.
with hydrocarbons, reducing their impact on tropospheric ozone destruction,
Cl + RH → HCl + R. (R13)
The relevance of reactive chlorine is discussed further in Sect. 2.2. The high abundance of hydrocarbons in the tro-posphere (e.g. methane) and the high reactivity of Cl atoms means that Cl atoms are to HCl by Reaction (R13) with a 50% probability per Cl atom reaction.
The concept of lifetimes and fates of various XOxspecies
is very useful when considering the relative importance of the various halogen atoms in ozone depletion chemistry. The lifetime of XO is short during sunlit periods, due to photoly-sis (J2). For typical springtime noon conditions, the IO life-time is a few seconds, the BrO lifelife-time is around 2 minutes, and the ClO lifetime is roughly an hour. When high levels of halogen oxides are present (e.g. 30 pmol/mol of BrO found in the polar boundary layer), the lifetime of XO can drop to minutes and self or cross reactions can be the most efficient in converting XO to X. Once halogen atoms are released they are, however, quite likely to reform XO by reaction with O3
(Reaction R1), the probability ranges from >99% for I to up to 99% for Br to ∼50% for Cl. This gas-phase recycling of X to XO leads to an effective lifetime of XOxgiven by
τXOx =τXO
rate of X + O3
rate of X + not(O3)
. (1)
For ClOxthis translates to daytime lifetimes between about
two hours (at low levels of BrO) to several minutes (at 30 pmol/mol of BrO), since Cl atoms react with the ubiq-uitous methane, as mentioned above. On the other hand, Br atoms only react with aldehydes, olefins, or HO2
radi-cals, thus re-conversion to BrO (via Reaction R1 and causing O3depletion) is most likely at normal ozone levels,
conse-quently BrOxlifetimes are quite long despite rapid photolysis
of BrO. In fact BrOxlifetimes typically reach several hours,
with relatively little influence from XO levels. On the other hand, in polar regions the time to destroy ozone is of the or-der of one day, thus BrOxneeds to be recycled from bromide
on surfaces about 10 times during a typical ozone depletion event (Platt and Lehrer, 1996; Platt and H¨onninger, 2003; Lehrer et al., 2004). Based upon the autocatalytic mecha-nism’s ability to convert nonreactive salt bromide into reac-tive bromine, it is currently assumed that most of the reacreac-tive bromine comes from sea salt that is activated by this mech-anism. Early ideas that the majority of the reactive bromine might come from organobromine gases (e.g. CHBr3, Barrie
et al., 1988) or coupling with reactive nitrogen gases (e.g. N2O5, Finlayson-Pitts et al., 1990) have now been discounted
because they are not a sufficiently strong bromine source to explain the rate of ozone destruction or observed BrO levels. However, the bromine explosion chemistry requires a source of “seed” reactive halogens that initiate the explosion. There may be a role for these or other relatively weak sources of re-active halogen species in providing the “seed” for the explo-sion. Other possible initiators of bromine chemistry are inter-halogen reactions, discussed in recent inter-halogen chemistry re-view articles (e.g. von Glasow and Crutzen, 2003, 2007). The complexity of these reactions and interactions is illustrated in Fig. 5, which highlights interhalogen couplings. More recent investigations have shown that iodine must also be included in the scheme (see Sects. 2.3 and 2.4).
Recent laboratory studies of gas-phase halogen chemistry have focused on iodine oxide chemistry, in order to quantify the efficiency of O3destruction (Vogt et al., 1999) and to
un-derstand the formation of new particles (O’Dowd and Hoff-mann, 2005). The IO self-reaction produces OIO (∼40%) and IOIO (∼55%) at atmospheric pressure. The IOIO prod-uct is unstable and most likely rapidly thermally decomposes to yield OIO, so that the overall yield of OIO from the IO self-reaction is high. The photolysis of OIO to O(3P)+IO is very unlikely to occur, it has an upper limit for the quan-tum yield of 7×10⁻³(Ingham et al., 2000). OIO has a series
of strong absorption bands between 480 and 620 nm, where photolysis to yield I+O2 is possible and would make OIO
formation through the IO self reaction a major O3-depleting
cycle (Ashworth et al., 2002). Although two recent studies report upper limits to the I atom quantum yield of <0.05 (560–580 nm) and <0.24 (532 nm) (Joseph et al., 2005; Tuc-ceri et al., 2006), a small probability of photolysis at wave-lengths >470 nm, integrated over the entire OIO absorption band would still lead to significant photochemical conversion
Table 2. Satellite measurements of BrO.
Instrument Hemisphere Time period (MM.YYYY) Reference
GOME SH Sep 1996 Wagner and Platt (1998a)
GOME NH Feb 1997–July 1997 Richter et al. (1998c) GOME NH April 1997, May 1997 Chance (1998)
GOME NH April 1997 Burrows et al. (1999)
GOME NH + SH Jan 1997–Dec 1997 Wagner et al. (2001) GOME NH + SH July 1999–June 2000 Richter et al. (2002) GOME NH March 2000–April 2000 Zeng et al. (2003) GOME NH + SH Feb 1996–Oct 2001 Hollwedel et al. (2004) GOME SH Aug 1999, Sep 1999, Aug 2000, Sep 2000 Frieß et al. (2004) GOME NH + SH Aug 1997, March 2001 Kaleschke et al. (2004) SCIAMACHY NH March 2003 Jacobi et al. (2006)
GOME NH Feb 2000–May 2000 Zeng et al. (2006)
of OIO to I and consequent O3loss.
1.4 Observational, modeling, and laboratory methods
1.4.1 Observations
Most direct observations of halogen compounds in the polar troposphere rely on optical absorption measurements. Halo-gen oxides have narrow band absorption structures at UV and visible wavelengths, and BrO, IO, and tentatively also ClO have been observed by active Differential Optical Absorp-tion Spectroscopy (long-path DOAS) measurements using a strong light source and an open path (e.g. Hausmann and Platt, 1994; Martinez et al., 1999; Saiz-Lopez et al., 2007b). The technique can also be used for OIO, OClO, and I2, but
no results have been reported so far for polar regions. The same species can be detected using atmospherically scattered light with passive DOAS instruments, and polar measure-ments have been reported for BrO and IO (e.g. Kreher et al., 1997; Wittrock et al., 2000; Frieß et al., 2001; H¨onninger and Platt, 2002; H¨onninger et al., 2004b). Later observations use the multiple axis DOAS (H¨onninger et al., 2004c) technique, which has the advantage of being able to separate clearly the tropospheric and stratospheric portions of the atmo-spheric column, and even derive a crude vertical profile. An overview of these ground-based measurements can be found in the electronic supplement (http://www.atmos-chem-phys. net/7/4375/2007/acp-7-4375-2007-supplement.pdf).
Global maps of the total BrO column density (the sum of troposheric and stratospheric columns) can be retrieved with the DOAS technique from satellite measurements by instru-ments such as GOME, SCIAMACHY or OMI (e.g. Wagner and Platt, 1998a; Richter et al., 1998c) (Table 2). First obser-vations of IO from SCIAMACHY around coastal Antarctica have recently been reported by Saiz-Lopez et al. (2007a) and Sch¨onhardt et al. (2007). Satellite data provide good cover-age but have to be corrected for stratospheric XO, the vertical
distribution of XO, and cloud effects in the troposphere, in-troducing substantial uncertainties.
In-situ measurements of BrO and potentially also ClO are possible using the atomic fluorescence method (e.g. Aval-lone et al., 2003) and can determine the vertical profile of BrO in the lowest several meters. The atomic fluorescence technique, originally developed for stratospheric measure-ments, is less accurate when measuring tropspheric BrO due to increased quenching of the resonance signals at higher pressures and large pumps needed to decrease the pressure-induced quenching. With another in-situ method, atmo-spheric pressure chemical ionization mass spectrometry, Br2,
BrCl, and Cl2can be observed (Foster et al., 2001; Spicer
et al., 2002). Indirect evidence for the presence of enhanced levels of chlorine atoms can be obtained from measurements of hydrocarbons, chosen to have rate constants that are sim-ilar for reaction with Cl but different for OH or vice versa (this method is known as the hydrocarbon clock method; see Jobson et al., 1994). The analysis of halogenated VOCs, formed by the reaction of ethene and propene with Cl and Br atoms, provides a valuable method to determine [Br]/[Cl] ratios (Keil and Shepson, 2006). The sum of photolysable bromine compounds can also be measured by conversion to bromoacetone and subsequent GC analysis (Impey et al., 1999). See Sect. 2.2 for more details on these techniques.
1.4.2 Models
Numerical models have been developed to examine and quantify the processes involved in bromine explosions and ODEs as well as the consequences for the chemistry of the at-mosphere. They have significantly improved our understand-ing of the reaction cycles and the interdependencies of dif-ferent elemental cycles. Models have, for example, helped to realize that fast multiphase reactions are necessary to main-tain the bromine explosion (e.g. Fan and Jacob, 1992). Most of these studies use box models focusing on the chemical
reaction mechanism. Some include parameterizations of varying complexity for heterogeneous reactions (McConnell et al., 1992; Tang and McConnell, 1996), some explicitly in-clude heterogeneous reactions (Fan and Jacob, 1992; Sander et al., 1997; Michalowski et al., 2000; Evans et al., 2003). Similarly, the treatment of photochemical processes in the snow pack has explicitly only been done by Michalowski et al. (2000). These processes are discussed in detail in the snow photochemistry companion paper (Grannas et al., 2007). One-dimensional model studies have investigated the vertical structure of ODEs (Lehrer et al., 2004; Piot and von Glasow, 2007; Saiz-Lopez et al., 2007c) Three-dimensional models have so far only used very simple approaches regard-ing the chemical processes, like estimatregard-ing ozone destruction based on satellite-derived vertical BrO columns (Zeng et al., 2003).
One benefit of models is that the whole life cycle of ODEs and the shift in elemental speciation and oxidants can be investigated. Field measurements often only give brief ob-servations of the chemical composition with a poorly deter-mined history of the air mass. A great deal can be learned from these model studies which highlight the often puzzling chemical interactions under the highly non-linear chemical conditions of ODEs. Shifts in bromine speciation play a key role in speeding up or slowing down the development of ODEs (e.g. Sander et al., 1997; Piot and von Glasow, 2007). An innovative way of comparing model results with mea-surements was used by Evans et al. (2003) who used O3as
“chemical coordinate” to be able to compare their results to the rather randomly measured various stages of ODEs en-countered during the TOPSE campaign.
One common problem of all models is that many pro-cesses, especially the source of the bromine for the bromine explosions and the triggering of these events, are still not un-derstood and therefore have to be prescribed/parameterized in the models. The proper description of processes in and on the snow seems to be key to further progress in this field. However, incorporation of snow pack processes in models is very challenging due to the lack of a quantitative physi-cal and chemiphysi-cal understanding of these processes. Progress in these fields will strongly increase our ability to simulate ODEs and lead to a better understanding of polar chemistry in general.
1.4.3 Laboratory methods
Laboratory measurements have contributed significantly to improve our understanding of the chemical processes behind the bromine explosion and snow and ice chemistry. One of the main advantages of laboratory experiments is that good control of conditions is possible, which leads to ready and systematic variation of suspected key features.
The techniques that are typically used for the investiga-tion of rate coefficients, products/mechanisms, photolysis cross sections and quantum yields of gas phase reactions
are, flow reactors, flash or pulse photolysis, or smog cham-bers with a multitude of techniques to measure the products, like UV/VIS/IR spectroscopy, mass spectroscopy, cavity ring down spectroscopy (see e.g. Finlayson-Pitts and Pitts, 2000, for an overview).
A special challenge is posed by reactions on surfaces like snow and ice or liquid or solid aerosol particles, all of which play a major role in ODEs. One example of the involved complications is that at typical polar temperatures, hundreds to thousands of monolayers of ice desorb per second. This desorption is balanced by adsorption of water vapor onto the surface, resulting in a very dynamic equilibrium at the surface. The ice surfaces in the environment are very com-plex, and include natural snow, slush, solid ice and quasi-liquid layers (QLL) on their surfaces. Artificial snow, with its amorphous and crystalline characteristics, may not be al-ways representative of the true solid/slush/QLL conditions found in the environment. However, several successful at-tempts have been made to investigate frost flowers (Mar-tin et al., 1995, 1996; Nghiem et al., 1997; Hutterli et al., 2006), snow (Jacobi and Hilker, 2007) and sea-ice (Richard-son, 1976; Adams et al., 2002; Papadimitriou et al., 2003) in the laboratory.
Other laboratory experiments focus on the kinetics and mechanisms of gas-phase halogen release from surfaces. They can be divided into three main types: (1) Flow tubes; these experiments provide information on gas-solid partition-ing includpartition-ing reactive and non-reactive uptake. (2) Surface probes; these techniques provide characterization of surface and bulk species can be made using a wide range of spec-troscopic techniques. (3) Bulk analyses; these techniques examine the net reactivity of ice and gases in contact with them and can be monitored by a variety of approaches in-cluding mass spectrometry. The frozen solids are often an-alyzed by methods including X-ray diffraction (XRD) and Raman spectroscopy. Much of the bulk analysis is per-formed on thawed material, which is problematic for inter-pretation because the effective surface concentrations of ions and molecules at ice surfaces may be very different from the melted analysis. For example, the pH of the melt might be quite different from the effective pH of molecules on the sur-face of ice. Two recent reviews are particularly useful for a more in-depth discussion of this subject (Huthwelker et al., 2006; Abbatt, 2003).
When ice freezes, ions separate from ice, leading to freeze-concentrated solutions that have different reactivity from the unfrozen solution (see Sect. 3.1). Freeze-concentration ef-fects have been used to explain the effect of cooling on a variety of acidified and neutral, nitrite ion and bromide- or chloride-containing mixtures. In laboratory studies, several trihalide ions were formed, including I2Cl−, I2Br−, ICl−2
and IBr−2 (O’Driscoll et al., 2006). A mechanism to explain the observations was given in terms of reaction steps involv-ing INO and the nitroacidium ion, H2ONO+, within liquid
“micropockets”. These and similar reactions in liquid inclu-sions of ice are likely to be critical to understanding air-ice chemistry that relates to halogen activation and ozone deple-tion events.
2 Halogens and their roles in ODEs
2.1 Bromine
As already discussed in Sect. 1, bromine is the key halogen species for polar ODEs. In this subsection, we give more details on these measurements and other bromine compounds, including biogenic bromine, dis-cuss satellite observations of BrO, and mention similar-ities to other regions. The electronic supplement to this paper (http://www.atmos-chem-phys.net/7/4375/2007/ acp-7-4375-2007-supplement.pdf) contains an extensive list of measurements.
2.1.1 Ground based measurements of bromine compounds
The key first measurements of inorganic bromine com-pounds in the polar boundary layer were those of “fil-terable bromine” published by Barrie et al. (1988) (see Fig. 2 and Sect. 1.2). Since then, a multitude of fur-ther gas phase and aerosol measurements have been made. The Arctic sites where the majority of these observations have been made are Barrow, Alert, Ny- ˚Alesund, and the Hudson Bay. Halley and Neumayer stations have been the locations of key Antarctic studies. See the electronic supplement (http://www.atmos-chem-phys.net/7/4375/2007/ acp-7-4375-2007-supplement.pdf) for a complete listing of the sites and maps of their location.
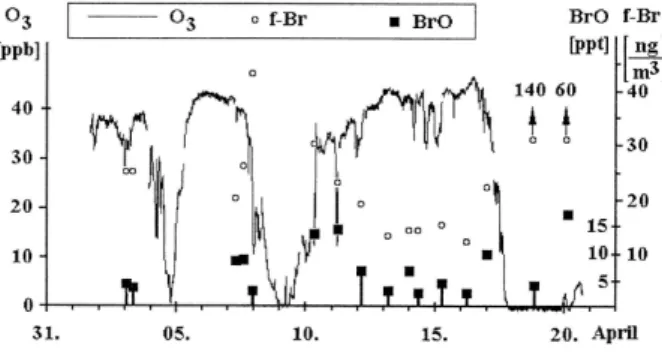
With the direct detection of BrO by active DOAS at Alert, (see Sect. 1.4.1 and Fig. 6) (Hausmann and Platt, 1994), the first evidence for the chemical mechanisms described in Sect. 1.3 was made. Since then active and passive DOAS techniques (Tuckermann et al., 1997; Kreher et al., 1997; Martinez et al., 1999; H¨onninger and Platt, 2002; Frieß et al., 2004; H¨onninger et al., 2004b; Saiz-Lopez et al., 2007b) as well as radical amplifiers (Impey et al., 1999) and atomic flu-orescence techniques (Avallone et al., 2003) have been used to identify BrO in both polar regions at Alert, Barrow,
Ny-˚
Alesund, the Hudson Bay, Neumayer, and Arrival Heights. Typical mixing ratios of BrO are a few to several tens of pmol/mol.
The MAX-DOAS measurements of H¨onninger and Platt (2002) at Alert show that the vertical extent of BrO layers is about 1 km (500–2000 m). Under under some circum-stances elevated layers might be present (H¨onninger et al., 2004b). Frieß et al. (2004) showed that enhanced BrO verti-cal columns were present at Neumayer, Antarctic, when part of the probed airmass was previously in contact with sea ice surfaces (see Fig. 7). The recent ship-based MAX-DOAS measurements of BrO around the Antarctic by Wagner et al.
Fig. 6. Comparison of in situ ozone, filterable bromine (f-Br), and
BrO at Alert. Reprinted from Hausmann and Platt (1994) with per-mission from the American Geophysical Union (AGU).
(2007) gives indications for an elevated BrO layer at the top of the boundary layer. Furthermore they showed that ship-based measurements of BrO show high boundary layer BrO values up to one month before they were detected by satellite, due to the higher sensitivity of MAX-DOAS to near-surface BrO compared to satellite observations.
Most measurements of BrO are made during polar spring. However, data from Alert showed the presence of BrO at smaller mixing ratios in fall as well (G. H¨onninger, personal communication, 2003). The first seasonal variation of BrO was measured by Saiz-Lopez et al. (2007b) in the Antarc-tic at Halley during the CHABLIS campaign (January 2004– February 2005). BrO was detected whenever the solar zenith angle was less than ∼92◦ i.e. also before direct sunlight reached the surface at mixing ratios up to 4 pmol/mol but not during the polar night. BrO showed a distinct maximum of 20 pmol/mol in October/November (spring), followed by a decrease towards the summer and a possible secondary max-imum in fall. The smaller radical concentrations between November and April could be a consequence of the less fre-quent appearance of frost flowers, a lower salinity of sea-ice surfaces, or faster mixing due to a less stable boundary layer (see Sect. 3.1).
Impey et al. (1997b,a) developed a method for determi-nation of the total photolysable chlorine and bromine (X2
and HOX), calibrated and determined “as Cl2” and “as Br2”.
The mixing ratios represent Cl2and Br2equivalents, e.g. in
terms of the rate of photolytic production of chlorine and bromine atoms. For bromine they were able to give mixing ratios for HOBr and Br2 separately. This method was
ap-plied during the 1994 Polar Sunrise Experiment at Alert. To-tal photolysable bromine (TPB) typically ranged from ∼5– 30 pmol/mol, and remained at these levels under full sunlight conditions. The highest values of HOBr (∼240 pmol/mol) detected by Impey et al. (1999) occured at the end of an ODE when O3was already increasing. They also measured Br2of
up to 24 pmol/mol during an ODE.
Fig. 7. Observations of enhanced BrO from 30 August to 15 September 1999, Neumayer, Antarctica. The stacked plots show the BrO differential slant column density (dSCD), duration of sea ice contact (shown in colors on the altitude – time plot), light path enhancement factor (a measurement of the light scattering in the atmosphere), and surface ozone mixing ratio. Reprinted from Frieß et al. (2004) with permission from the American Geophysical Union (AGU).
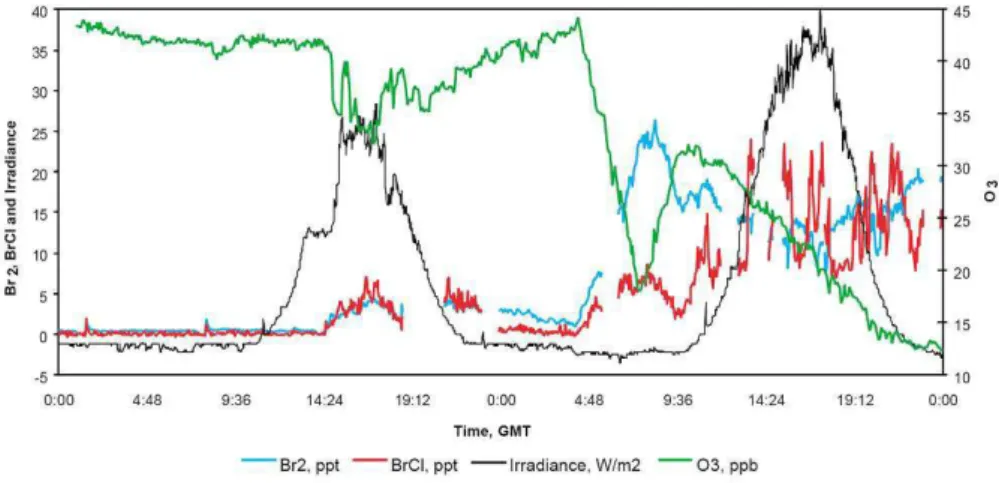
Fig. 8. Time series of O3, Br2, BrCl, and global irradiance at Alert for 10–11 March 2000 (note that the global irradiance results have not
been adjusted for a negative offset). Reprinted from Spicer et al. (2002), copyright 2002, with permission from Elsevier.
bromine compounds (especially Br2 and BrCl). This
evi-dence includes Br2 – wind sector comparisons from Alert
(Impey et al., 1997b), strong vertical gradients in BrO in the lowest meters observed at Ny- ˚Alesund and Alert (Aval-lone et al., 2003), and especially direct measurements of Br2
and BrCl by mass spectrometry in the vicinity and within
the snow pack (see Fig. 8 and Foster et al., 2001; Spicer et al., 2002). Both Br2 and BrCl were measured before
direct sunlight reached the site, possibly indicating a role of O3 reactions in the dark activation of bromine. Organic
bromine compounds and their relevance will be discussed in Sect. 3.3.2.
2.1.2 BrO and IO satellite observations: spatial and tempo-ral scale
With the launch of the Global Ozone Monitoring Experiment (GOME) in April 1995 (Burrows et al., 1999), it became pos-sible, for the first time, to detect globally the spectroscopic signatures of many tropospheric trace gases in the spectra of backscattered sunlight. These observations include BrO (Chance, 1998; Eisinger et al., 1997; Hegels et al., 1998a,b; Perner et al., 1998; Richter et al., 1998b,c; Wagner et al., 1998a; Wagner and Platt, 1998a) as well as IO (Saiz-Lopez et al., 2007a, Sch¨onhardt et al., 20072) and other trace gases. Such UV/Visible nadir satellite observations (which have since also been performed by the SCanning Imaging Ab-sorption SpectroMeter for Atmospheric CHartographY in-strument, SCIAMACHY, the Ozone Monitoring Inin-strument, OMI, and the second Global Ozone Monitoring Experiment, GOME-2 allow the assessment of the spatial dimension and temporal variation of “trace gas clouds” (see also Table 2 for an overview of satellite measurements of BrO).
After the first detection of plumes of enhanced BrO in GOME data (Wagner and Platt, 1998a; Wagner et al., 1998b; Wagner and Platt, 1998b) it rapidly became clear that they are a frequent phenomena in both hemispheres in polar spring, covering large areas mainly over sea ice and along the coasts (Chance, 1998; Richter et al., 1998c,a). It could be shown that the enhanced BrO concentrations detected by satellite were well correlated with depleted O3concentrations
mea-sured from ground based instruments (Wagner and Platt, 1998a; Wagner et al., 2001) and also related with the deple-tion of gaseous mercury (Lu et al., 2001; Ebinghaus et al., 2002; Sommar et al., 2007). As the satellite record grew, it also became clear that the phenomenon of enhanced bound-ary layer BrO concentrations occurs very regularly for sev-eral months in both hemispheres (Van Roozendael et al., 1999, 2002; Wagner et al., 2001; Richter et al., 2002), in-dicating that it probably is a natural phenomenon. From the investigation of the spatio-temporal variation a strong cor-relation with the occurrence of first-year sea ice was found (Wagner, 1999; Wagner et al., 2001, see also Fig. 9), in-dicating that the source is related to the enrichment of sea salt on the surface of freezing sea ice. From a detailed comparison study (Kaleschke et al., 2004) it was found in particular that enhanced BrO concentrations were observed under conditions where the existence of frost flowers was possible (see Sect. 3.1). Several satellite studies address is-sues like a potential trend of the areas covered by enhanced BrO concentrations (Hollwedel et al., 2004) or the existence of a global free tropospheric BrO mixing ratio of the or-der of 1 pmol/mol (Van Roozendael et al., 1999; Wagner,
2Sch¨onhardt, A., Richter, A., Wittrock, F., Kirk, H., Oetjen, H.,
Roscoe, H. K., and Burrows, J. P.: Observations of iodine monox-ide (IO) columns from satellite, Atmos. Chem. Phys. Discuss., submitted, 2007.
Fig. 9. Vertical columns for BrO for both hemispheres in spring.
Data from SCIAMACHY, courtesy of A. Richter.
1999; Theys et al., 2004). It was in particular speculated that the free tropospheric BrO might be at least partly caused by transport of BrO enriched air masses from polar regions (Hollwedel, 2005, see Sect. 4.4). Short-lived halocarbon gases may also be sources of free-tropsopheric BrO (Salaw-itch, 2006). In many aspects, the enhanced BrO concentra-tions in the boundary layer during polar spring are an ideal target for the observation with space-borne sensors. First, the high albedo of ice and snow in polar regions causes a high sensitivity for trace gases located very close to the surface (even in the presence of some clouds). Second, the typical spatial extension (several hundreds of kilometers) and life-time (about one day) of boundary layer BrO fit very well to the temporal and spatial resolution and coverage of GOME. However, some uncertainties remain with respect to the sep-aration of stratospheric and tropospheric columns, cloud ef-fects, and the amount of BrO over low reflectivity surfaces such as the oceans. The improved spatial and temporal cov-erage and resolution of the latest and future satellite instru-ments will provide the opportunity to monitor tropospheric BrO chemistry in greater detail.
Very recently IO was identified from SCIMACHY along the coastline of Antarctica (Saiz-Lopez et al., 2007a; Sch¨onhardt et al., 2007). There are indications that IO is be-low the detection limit in the Arctic and that there is a clear seasonal variation in the Antarctic with maxima in Septem-ber and OctoSeptem-ber and a second maximum in austral autumn (Sch¨onhardt et al., 20072).
2.1.3 The link to other places
Reactive bromine chemistry has been found to be of impor-tance in many other regions, namely the coastal and open oceans, salt lakes, volcanic plumes, polluted cities (under certain circumstances), and the free troposphere. For an overview see, e.g., von Glasow and Crutzen (2007). Of par-ticular interest in this regard are salt lakes (e.g. Hebestreit et al., 1999; Stutz et al., 2002; H¨onninger et al., 2004a) as the release mechanisms are likely related to the ones in po-lar regions due to the presence of po-large salt deposits on the
surface for both salt lakes and regions with new sea ice in high latitudes. This observation shows that low temperatures are not a prerequisite for the chemical cycles to be efficient in bromine release even though many of the involved reactions are temperature dependent so that one can expect important differences. This point, however, does not exclude the possi-bility that other – possibly physical – processes in polar re-gions might be dependent on cold temperatures. Specifically, the freezing of sea water, which causes brine to be pushed to the surface of the newly forming sea ice, is caused by cold temperatures and is likely involved in providing a saline sur-face on which halogen activation can occur (see Sect. 3.1 and its subsections). In Sect. 4.4 we discuss the possibility of transport of boundary layer air to the free troposphere and consequences for the chemistry in the free troposphere.
2.2 Chlorine
Chlorine was the second halogen (in inorganic form) that was detected in polar regions. As chlorine is present in small concentrations only, its direct role in ozone destruc-tion is probably very minor. For a typical [Br] to [Cl] ra-tio of 800 (see Sect. 2.4), chlorine atoms would account for only 2% of ozone depletion. Chlorine does play an impor-tant role, however, in the oxidation of volatile organic com-pounds (VOCs, see also Sect. 4.2) and possibly in the ac-tivation of bromine via BrCl (see Sects. 1.3 and 2.4). Fur-thermore, the concentration of HOx is increased by
oxi-dation of VOCs by chlorine, as detailed in Sect. 4.2. A multitude of measurements is compiled in the electronic supplement (http://www.atmos-chem-phys.net/7/4375/2007/ acp-7-4375-2007-supplement.pdf). With the exception of one measurement of HCl all data for inorganic chlorine so far are from the Arctic.
Jobson et al. (1994) were the first to develop an indi-rect technique to measure chlorine atoms in the polar tro-posphere. Their technique involved a kinetic analysis of the relative rates of hydrocarbon destruction. They showed that the time integrated chlorine concentration in the ob-served air mass at Alert was ∼3–7×10⁹molecules s/cm3 which corresponds, based on estimated reaction times of 1–20 days, to chlorine atom concentrations ranging from ∼3×10³–6×10⁴molecules/cm3.
Muthuramu et al. (1994) studied the decay of a series of alkyl nitrates at Alert and found that the relative alkyl ni-trate decays were also consistent with the known chlorine atom rate constants. Kinetic analysis of the data led to a value of 6.5×10⁹molecules s/cm3, i.e. the same result as ob-tained for light alkanes by Jobson et al. (1994). Muthuramu et al. (1994) discuss that Cl atom oxidation of alkyl nitrates may be an important mechanism for recycling NOx in the
Arctic lower atmosphere. Several other investigators (Sol-berg et al., 1996; Ariya et al., 1998; Ramacher et al., 1999; Rudolph et al., 1999) have used the VOC relative oxidation rate method, producing comparable values for [Cl]. Boudries
and Bottenheim (2000) used the absolute decay rate for alka-nes during a rapid ozone depletion event at Alert, Nunavut to derive a value [Cl]=7.5×10⁴molecules/cm3. The chlorine atom is responsible for all the consumption of a variety of VOCs, such as the alkanes studied by Jobson et al. (1994), and alkyl nitrates (Muthuramu et al., 1994) over the Arctic Ocean during these events, see more details in Sect. 4.2.
As part of ARCTOC, Perner et al. (1999) conducted mea-surements of ClOxat Ny- ˚Alesund, and measured a maximum
[ClO] of 2 pmol/mol, leading again to the conclusion that ozone destruction is dominated by Br atoms. Tuckermann et al. (1997) found average mixing ratios of ClO of about 21 pmol/mol during ODEs in 1995 at Ny- ˚Alesund which im-plies Cl atom concentrations much higher than those calcu-lated with the hydrocarbon clock methods. However, Tuck-ermann et al. (1997) report an average of only 3.3 pmol/mol ClO during ODEs for 1996. The high mixing ratios observed in 1995 stand out as very unusual and seem to be inconsis-tent also with what was observed at other locations. These observations highlight the need for independent methods for measurement of [Cl].
The measurements by Impey et al. (1997b) of total pho-tolysable chlorine (TPC) at Alert during the 1995 Polar Sun-rise Experiment showed mixing ratios typically ranging from ∼5–15 pmol/mol, with the highest concentrations found in the dark. After polar sunrise, TPC decreased to below the detection limit. This work showed that there is a dark pro-duction mechanism for chlorine atom precursors.
As already mentioned above, Foster et al. (2001) and Spicer et al. (2002) conducted the first direct measurements of Br2 and BrCl, at Alert (see Fig. 8). Interestingly, while
BrCl is present in quantities comparable to Br2, as discussed
by Spicer et al. (2002), Cl2was not detected.
A recent study by Tackett et al. (2007) addresses the ques-tion of the vertical scale impact of surface-derived halogen-atom precursors. They conducted measurements of VOCs, Hg(0), and O3in the lowest 300 m above the surface snow
pack at Barrow, Alaska. From these measurements they con-cluded that both Br-atom and Cl-atom chemistry was most active in the lowest ∼100–200 m above the surface. As an ex-ample, shown in Fig. 10 are plots of [methyl ethyl ketone]/[n-butane] as a function of altitude. As discussed in the paper, MEK/butane is a sensitive function of Cl-atom chemistry.
It is clear that chlorine atom chemistry is active and impor-tant in polar marine boundary layers, and over snow packs inland. This chlorine atom chemistry can play a dominant role in the processing of VOCs, and also in radical chemistry that in turn influences bromine atom chemistry. However, the nature of the chlorine atom precursors is not necessar-ily well understood and more measurement data for chlorine atom precursors and chlorine atoms themselves is needed to test and develop our understanding.