HAL Id: halshs-00870689
https://halshs.archives-ouvertes.fr/halshs-00870689
Preprint submitted on 7 Oct 2013
HAL is a multi-disciplinary open access
archive for the deposit and dissemination of
sci-entific research documents, whether they are
pub-lished or not. The documents may come from
teaching and research institutions in France or
abroad, or from public or private research centers.
L’archive ouverte pluridisciplinaire HAL, est
destinée au dépôt et à la diffusion de documents
scientifiques de niveau recherche, publiés ou non,
émanant des établissements d’enseignement et de
recherche français ou étrangers, des laboratoires
publics ou privés.
Would Border Carbon Adjustments prevent carbon
leakage and heavy industry competitiveness losses?
Insights from a meta-analysis of recent economic studies
Frédéric Branger, Philippe Quirion
To cite this version:
Frédéric Branger, Philippe Quirion. Would Border Carbon Adjustments prevent carbon leakage and
heavy industry competitiveness losses? Insights from a meta-analysis of recent economic studies. 2013.
�halshs-00870689�
No 52-2013
Would Border Carbon Adjustments prevent
carbon leakage and heavy industry
competitiveness losses?
Insights from a meta-analysis of recent
economic studies
Frédéric Branger
Philippe Quirion
September 2013
Would Border Carbon Adjustments prevent carbon leakage and heavy industry competitiveness
losses? Insights from a meta-analysis of recent economic studies
Abstract
The efficiency of unilateral climate policies may be hampered by carbon leakage and competitiveness losses. A widely discussed policy option to reduce leakage and protect competitiveness of heavy industries is to impose Border Carbon Adjustments (BCA) to non regulated countries, which remains contentious for juridical and political reasons. The estimation of carbon leakage as well as the assessment of different policy options led to a substantial body of literature in energy-economic modeling.
In order to give a quantitative overview on the most recent research on the topic, we conduct a meta-analysis on 25 studies, altogether providing 310 estimates of carbon leakage ratios according to different assumptions and models. The typical range of carbon leakage ratio estimates are from 5% to 25% (mean 14%) without policy and from -5% to 15% (mean 6%) with BCA. The output change of Energy Intensive Trade Exposed (EITE) sectors varies from -0.1% to -16% without BCA and from +2.2% to -15.5% with BCA.
A meta-regression analysis is performed to further investigate the impact of different assumptions on the leakage ratio estimates. The decrease of the leakage ratio with the size of the coalition and its increase with the binding target is confirmed and quantified. Providing flexibility reduces leakage ratio, especially the extension of coverage to all GHG sources. High values of Armington elasticities lead to higher leakage ratio and among the BCA options; the extension of BCA to all sectors is in the meta-regression model the most efficient feature to reduce the leakage ratio. Our most robust statistical finding is that, all other parameters being constant, BCA reduces leakage ratio by 6 percentage points.
Keywords: Carbon leakage, Competitiveness, Border Carbon Adjustments, analysis,
Meta-regression analysis, Computable General Equilibrium (CGE) models.
Les Ajustements Carbone aux Frontières empêcheraient-ils les fuites de carbone et les pertes de
compétitivité pour les industries lourdes ? Éclairages à partir d’une méta-analyse d’études économiques récentes
Résumé
L’efficacité des politiques climatiques unilatérales pourrait être réduite par les fuites de carbone et les pertes de compétitivité. Une option politique largement débattue pour réduire les fuites de carbone et protéger la compétitivité des industries lourdes est d’imposer des Ajustements Carbone aux Frontières (ACF) aux pays non contraints, ce qui reste controversé pour des raisons juridiques et politiques. L’estimation des fuites de carbone comme l’évaluation des différentes options politiques a conduit à de nombreuses études dans le domaine de la modélisation énergie-économie.
Afin de donner une vue d’ensemble de la recherche la plus récente sur le sujet, nous conduisons une méta-analyse de 25 études, représentant au total 310 estimations de taux de fuites de carbone selon différentes hypothèses et modèles. La plage de variation type des estimations de taux de fuites de carbone sont de 5% à 25% (moyenne 14%) sans politique et de -5% à 15% (moyenne 6%) avec ACF. Le changement de production des secteur Énergie-Intensifs et Exposés au Commerce International (EIECI) varient de -0.1% à -16% sans ACF et de +2.2% à -15.5% avec ACF.
On effectue ensuite une méta-régression pour déterminer plus en détail l’impact des différentes hypothèses sur les estimations de taux de fuites de carbone. La diminution du taux de fuites avec la taille de la coalition et son augmentation avec la cible de réduction est confirmée et quantifiée. Proposer des mécanismes de flexibilité réduit le taux de fuites de carbone, particulièrement lorsque tous les gaz à effets de serre (et pas seulement le CO2) sont couverts. Des valeurs élevées d’élasticité d’Armington conduisent à un taux de fuites plus élevé et parmi les options d’ACF, l’extension des ACF pour tous les secteurs est dans la méta-régression la caractéristique la plus efficace pour réduire le taux de fuites de carbone. Notre résultat le plus robuste statistiquement est que, toutes choses égales par ailleurs, les ACF réduisent le taux de fuites de carbone de 6 points de pourcentage.
Mots-clés : Fuites de Carbone, Compétitivité, Ajustements Carbone aux Frontières, Méta-Analyse,
Méta-Régression, modèles d’Équilibre Général Calculable. CIRED Working Papers Series
Would Border Carbon Adjustments prevent carbon leakage and
heavy industry competitiveness losses? Insights from a meta-analysis
of recent economic studies
Frédéric Brangera,1,∗, Philippe Quiriona,b
aCIRED, 45 bis, avenue de la Belle Gabrielle, 94736 Nogent-sur-Marne Cedex, France bCNRS
Abstract
The efficiency of unilateral climate policies may be hampered by carbon leakage and competi-tiveness losses. A widely discussed policy option to reduce leakage and protect competicompeti-tiveness of heavy industries is to impose Border Carbon Adjustments (BCA) to non regulated countries, which remains contentious for juridical and political reasons. The estimation of carbon leakage as well as the assessment of different policy options led to a subsantial body of litterature in energy-economic modeling.
In order to give a quantitative overview on the most recent research on the topic, we conduct a meta-analysis on 25 studies, altogether providing 310 estimates of carbon leakage according to different assumptions and models. The typical range of carbon leakage estimates are from 5% to 25% (mean 14%) without policy and from -5% to 15% (mean 6%) with BCA. The output change of Energy Intensive Trade Exposed (EITE) sectors varies from -0.1% to -16% without BCA and from +2.2% to -15.5% with BCA.
A meta-regression analysis is performed to further investigate the impact of different assump-tions on the leakage ratio estimates. The decrease of the leakage ratio with the size of the coalition and its increase with the binding target is confirmed and quantified. Providing flexibility reduces leakage ratio, especially the extension of coverage to all GHG sources. High values of Armington elasticities lead to higher leakage ratio and among the BCA options, the extension of BCA to all sectors is in the meta-regression model the most efficient feature to reduce the leakage ratio. Our most robust statistical finding is that, all other parameters being constant, BCA reduces leakage ratio by 6 percentage points.
1. Introduction
International climate agreements are likely to remain sulglobal in the years to come: the global climate architecture is shifting from a UNFCCC-led top-down regime to a bottom-up approach (Rayner, 2010). Differences in Abatement targets among countries may lead to two dinstinct but interrelated issues: carbon leakage and competitiveness losses, especially among Energy Intensive Trade Exposed (EITE) sectors, such as Cement, Steel or Aluminium (Dröge et al., 2009). Indeed, the asymmetry of carbon costs between regions may induce a shift of production of carbon inten-sive products from carbon-constrained countries to less carbon-constrained countries. As carbon dioxyde is a global pollutant, i.e. the geographic location of emissions has no influence on its environmental impacts, this carbon leakage would reduce the environmental effectiveness of the climate policies. Moreover, these production losses in heavy industries would also damage the economy and involve job destructions.
Carbon leakage and competitiveness issues have been one of the main arguments against the implementation of ambitious climate policies. A growing body of academic litterature has been
∗Corresponding author
Email addresses: branger@centre-cired.fr (Frédéric Branger), quirion@centre-cired.fr (Philippe Quirion)
developped in the recent years to quantify the impacts of uneven climate policies and to find the best policy measures to counteract them. Among them, Border Carbon Adjustements (BCA), which consists in taxing products at the border on their carbon content, are widely discussed. Their WTO consistency as well as their political consequences remain highly contentious among legal Experts: they could constitute an incentive to join the climate coalition or trigger a trade war because of green protectionnism suspicions.
Ex post econometrical studies haven’t revealed so far any evidence of carbon leakage (Reinaud,
2008; Ellerman et al., 2010; Quirion, 2011; Sartor, 2013) predicted in analytical models (Fischer and Fox, 2011; Jakob et al., 2011; Hoel, 1996; Markusen, 1975). Ex ante modeling are dominated by Computable General Equilibrium (CGE) (Böhringer et al., 2012a) models but there are also some sectoral partial equilibrium models (Mathiesen and Moestad, 2004; Monjon and Quirion, 2011b). Some litterature reviews have been published recently on the subject (Zhang, 2012; Quirion, 2010; Dröge et al., 2009; Gerlagh and Kuik, 2007) but to our knowledge no quantitative meta-analysis has been made.
Meta-analysis is a method developped to provide a summary of empirical results from different studies and test hypotheses regarding the determinants of these estimates (Nelson and Kennedy, 2009). It has been extensively used in medical research. The first meta-analysis in economics can be traced back to Stanley and Jarell (Stanley and Jarrell, 1989). In the field of environment and resource economics, the majority of meta-analyses summarize the results of different nonmarket valuation studies (Van Houtven et al., 2007; Brander and Koetse, 2011; Barrio and Loureiro, 2010; Ojea and Loureiro, 2011; Richardson and Loomis, 2009). Closer to our subject, one can cite two studies on marginal Abatement costs to mitigate climate change, one for all sectors (Kuik et al., 2009) and the other specific to agriculture (Vermont and De Cara, 2010). An extensive review of meta-analysis methods in environmental economics is given in Nelson and Kennedy (Nelson and Kennedy, 2009).
In this article, we conduct a meta-analysis on 25 studies dating from 2004 to 2012, altogether providing 310 estimates of carbon leakage according to different assumptions and models. The typical range of carbon leakage estimates are from 5% to 25% (mean 14%) without policy and from -5% to 15% (mean 6%) with BCA. We then do a meta-regression analysis to further investigate the impact of different assumptions on computed results. Our model Explains 51% of the variance, which suggests that variability between the models remains significant. Impact of key model parameters, such as Armington elasticities, and policy features such as Linking carbon markets or extending pricing to all GHG sources can be highlighted. We found that, all other parameters being constant, BCA implementation reduces leakage ratio by 6 percentage points.
The remainder of this paper is structured as follow. Section 2 decribes the database and section 3 provides some descriptive statistics. The meta-regression model is Explained in section 4 and results are discussed in section 5. Section 6 concludes.
2. Database description
The selection of studies for a meta-analysis is a decisive matter. Publication bias is a form of sample selection bias that occurs if primary studies with statistically weak or unusual results are less likely to be published (Nelson and Kennedy, 2009). For example, it has been widely recognized to exagerage the effectiveness of pharmaceuticals (Doucouliagos and Stanley, 2009). In our case, as we deal with model studies (no statistical significancy is involved), we believe that the publication bias is less important than for statistical studies (especially in medical studies). However a publication bias may remain for studies with unusual results1. Statistical techniques
to take this bias into account exist (Stanley, 2005; Rothstein et al., 2006) but only for statistical studies. Our best option to address this issue was to embrace as many studies as possible without artificially setting aside some of them, e.g. non peer-reviewed papers.
1Authors compare their results with those of the litterature and are able to change the settings or calibration of their models to influence the results. Model comparisons may involve then a convergence of model results.
Many articles and working papers deal with carbon leakage and competitiveness issues but only some of them are models giving ex ante numerical estimates. The body of litterature regarding these issues also comprises ex post econometrical analyses, analytical models and political or juridical studies (Cosbey et al., 2012; Ismer and Neuhoff, 2007; Monjon and Quirion, 2011b). The criteria to be part of our sample was first to provide numerical estimations of carbon leakage with a model. The second criteria was, since the purpose of this paper is to investigate the impact of Border Carbon Adjustments on leakage, to include BCA in the scenarios. To constitute our sample, we searched for studies in standard search engines (Web of Science, Google Scholar, etc) and cross references. Our sample is made of 25 studies dating from 2004 to 2012, most of them (14) are part of the recent Energy Economics Special Issue. Some are grey litterature (MIT working paper, World Bank working paper, etc), others are published in environmental economics journals (Energy Economics, Energy Policy, the Energy Journal, Energy Policy, Climate Policy etc). The majority are Computable General Equilibrium (CGE) models relying on the GTAP database (except for one), the others are sectoral or multi-sectoral partial equilibrium models. The number of carbon leakage estimates per study varies from 2 (Weitzel et al., 2012) to 54 (Alexeeva-Talebi et al., 2012a), with a mean of 12.6. The way to deal with “within studies/between studies” variability is a major source of concerns for meta-analysis. In the next sections we’ll Explain how we deal with it for descriptive statistics and meta-regression.
The common use of the leakage-to-reduction ratio or leakage ratio,
l=△EN onCOA
− △ ECOA
where △ECOA is emissions variation in the climate coalition between the climate policy scenario
and the counterfactual business-as-usual scenario, avoids us to make approximate conversions between studies. In other words all studies calculate the same thing, which is necessary in a meta-analysis as a “synthesis requires the ability to define a common concept to be measured” (Smith and Pattanayak, 2002)).
In the majority of the cases results were available on tables, but sometimes they were taken from graphs or derived from own calculation (Mattoo et al., 2009).
3. Descriptive Statistics
3.1. First sight
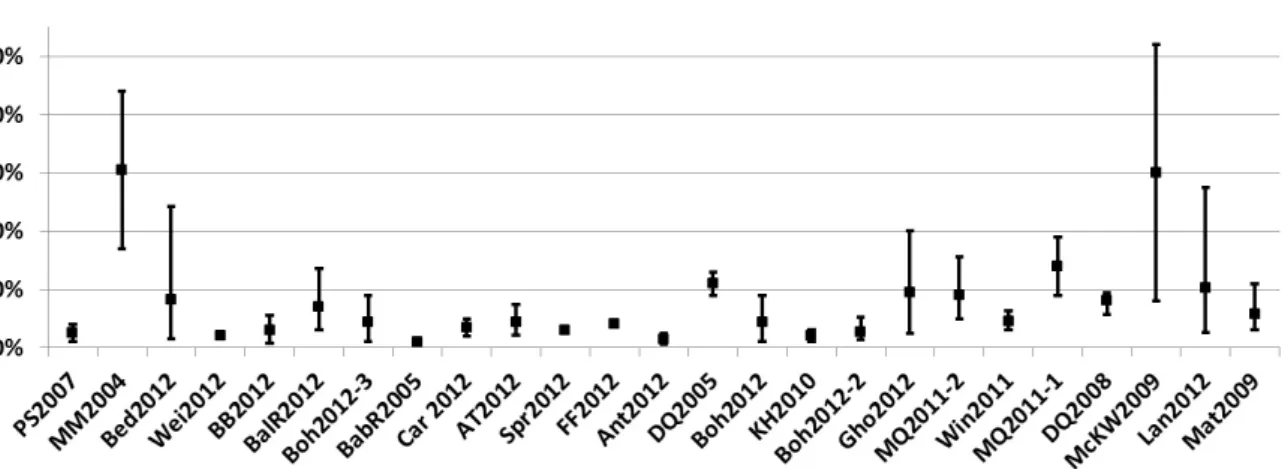
Figure 1 presents ranges of leakage ratio estimates for the 25 studies (mean, minimum and maximal values with or without BCA). Leakage ratio estimates range from 2% to 41% without BCA and from -41% to 27% with BCA. Eight studies find negative values of leakage ratio in case of BCA, with three studies (Mathiesen and Moestad, 2004; McKibbin et al., 2008; Lanzi et al., 2012) finding values below -15%. Internal variations (within one study) of leakage ratio estimates range from almost null (Alexeeva-Talebi et al., 2012b) to relatively high (Mathiesen and Moestad, 2004; Bednar-Friedl et al., 2012; Ghosh et al., 2012) depending on the scenarios and models.
Comparing scenarios by pair (with and without BCA, all the other parameters being con-stant), we can observe that in all cases, BCA led to a reduction of the leakage ratio2. These
results are in constrast with (Jakob et al., 2011) who found that BCA could increase leakage ratio3. For each pair, we calculate the leakage ratio reduction in percentage points (defined as
LeakageRatioReduction = LeakageRatioN oBCA− LeakageRatioBCA ). In the majority of the
cases, the leakage ratio reduction due to BCA stands between 1 and 15 percentage points, but
2In figure 1, for FF2012 (Fischer and Fox, 2011), the mean with BCA is higher than with no BCA. but the “equivalent” BCA scenarios corresponds to the highest value of leakage ratio of the no BCA scenario (Europe only abating).
3In this paper, under certain conditions, if in non coalition countries, the carbon intensity of Exports (“clean” sector) is higher than those of local production (“dirty” sector), a reallocation of production induced by BCA from “clean” to “dirty” sector would increase emissions in non coalition countries and then leakage ratio on a global scale
there are some outliers above 30 percentage points, where BCA actually generates negative leakage ratios (McKibbin et al., 2008; Mathiesen and Moestad, 2004).
Apart from carbon leakage, competitiveness losses in energy-intensive industries constitutes the other component of the climate trade nexus. Though extensively used in the public debate, the notion of competitiveness remains ambiguous (Alexeeva-Talebi et al., 2012b). Some authors consider that this notion is meaningless at the national level (Krugman, 1994). At the sectoral level, it may refer to “ability to sell” or “ability to earn”. In CGE models, competitiveness is most of the time implicitely defined as “ability to sell” and measured by gross output. In our sample, 17 of the 25 studies show results of output change for industries. Based on GTAP sectors, EITE sectors often regroups Refined goods, Chemical products, Non-metallic minerals, Iron and Steel Industry and Non-ferrous metals (although sometimes Refined goods is aside). Some studies present only disaggregated results by sectors, and not the output change for EITE sectors as a whole. In this case, we use the average of the output of Iron and Steel and Non Metallic Minerals sectors (or average of Iron and Cement) as a proxy for EITE sectors4.
The output change of EITE sectors varies from -0.1% to -16% without BCA and from +2.2% to -15.5% with BCA. There is a clear dichotomy between CGE models where output loss range is 0%-3% (except for Alexeeva-Talebi 2012 (b) and Ghosh et al. 2012 where it’s a bit more (around 3%-7%)) and sectoral partial equilibrium models where output loss range is 8%-15%. In all cases, BCA reduce the output loss among EITE industries5 and in five cases (Peterson and Schleich,
2007)(Alexeeva-Talebi et al., 2012b; Kuik and Hofkes, 2010; Mattoo et al., 2009; Ghosh et al., 2012), the output variation of EITE industries is even positive.
The welfare (or in some studies GDP) variation of the abating coalition ranges from -1.58% to 0.02% without BCA and from -0.9% to 0.40% with BCA (the environmental impact is never taken into account in the welfare estimation6). Though BCA improve welfare of coalition countries
compared to a no BCA scenario, they most of the time don’t reestablish a “neutral” situation (e.g a variation near 0%), contrary to previously with the output of EITE industries. The welfare variation is still negative after BCA, because the consumers of the coalition pay higher prices in EITE sectors’ products. This improvement of welfare in coalition countries goes hand in hand with a bigger degradation of welfare in non coalition countries. BCA have big distributionnal impacts: they transfer a part of the burden to the non coalition countries (Böhringer et al., 2012c). In the studies that report it (Böhringer et al., 2012c; Lanzi et al., 2012; Mattoo et al., 2009), global welfare is decreasing with BCA.
3.2. Merging studies
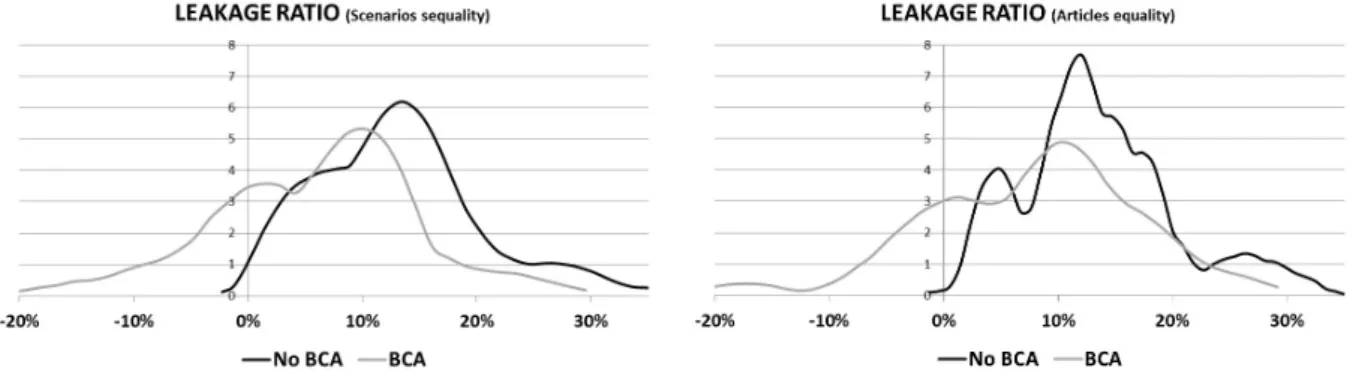
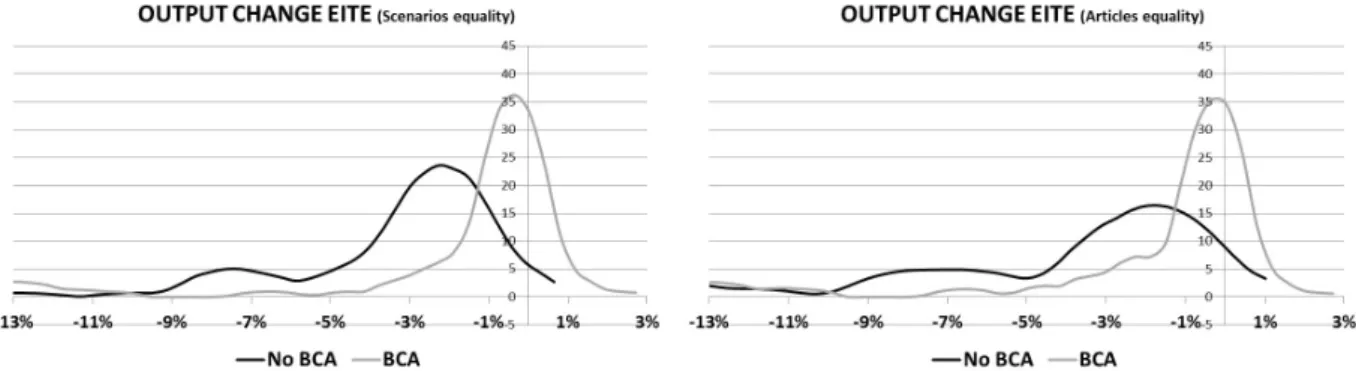
Gathering all the estimates of carbon leakage in the 25 studies, we compute kernel density estimations for the estimates accross all studies. As the number of estimates varies greatly (from 2 to 54) accross studies, we consider two ways of merging results, the “scenarios equality” method and the “articles equality” method. In the “scenarios equality” method, we add all estimates regardless of the article they are from. Then an article with N estimates “weights” N/2 times more in the final distribution than an article with only two estimates. In the “articles equality” method however, weights are put on estimates to assure that each article “weights” the same in the final distribution7. By this process the distribution of results with the “articles equality” method
is less smooth because there are artificially some accumulation in the distribution. However the
4For the only two studies where output changes were available both by sector and for EITE sectors as a whole (Lanzi et al., 2012; Ghosh et al., 2012), it was a correct proxy. Iron and Steel (resp. Non Metallic Minerals) being a bit less (resp. more) impacted than EITE as a whole
5However in the CASE model (Monjon and Quirion, 2011a,b), cement output is more reduced in the presence of BCA
6In the Energy Economics special issue, leakage is endogenously compensated by a higher Abatement to assure a same environmental impact in all scenarios in order to compare welfare variations
7If N
kis the number of estimates in the article k, the weight for an estimate from article i is then
maxk(Nk)
Ni
(and the closest integer value for kernel estimate using Stata). In this case each article weights maxk(Nk)in the final distribution.
distributions share the same shape with both results, especially for the leakage ratio and the output variation of EITE industries, which can be interpretated as a sign of the robustness of the results.
Both leakage ratio distribution and EITE output change distribution are bimodal. For leakage ratio without BCA there is a concentration around 5% and another around 12%8. We can see
that a leakage ratio above 100%, theoretically possible if the carbon content of products is higher outside the climate coalition is well out of the range of estimates in the litterature. For EITE output variation there is a concentration at -2% and another one (more spread out) at -7% (the dichotomy CGE models/PE models). The coalition welfare variation distribution is unimodal, with a mode of -0.6% without BCA and -0.3% with BCA.
One can easily visualize in figures 6 and 7 the impact of BCA in reducing leakage ratio, restoring some competitiveness and to a lesser extent improving coalition welfare with the left shift of the leakage ratio distribution and the right shifts of the output change and coalition welfare change distributions.
8Not a single estimate of leakage ratio is negative without BCA, the negative part is an artifact in the kernel density estimation
T able 1: Selected studies (En. Eco.=Energy Economics, WP=W orking P ap er) Name Reference Journal Mo del Name Mo del typ e Main Database Cluster Obs Boh2012 (Böhringer et al., 2012a) En E co (SI) Sev eral CGE GT AP 7.1 1 28 (15+13) Gho2012 (Ghosh et al., 2012) En Eco (SI) EC-MS-MR CGE GT AP 7.1 7 18 (6+12) A T2012 (Alexeev a-T alebi et al., 2012a) En Eco (SI) PA CE CGE GT AP 7.1 2 54 (27+27) Lan2012 (Lanzi et al., 2012) En Eco (SI) ENV-Linkages CGE GT AP 7.0 3 44 (20+24) Boh2012-2 (Böhringe r et al., 2012b) En Eco (SI) BCR CGE GT AP 7.1 8 18 (9+9) BalR2012 (Balistreri and R uth erford, 2012) En Eco (S I) MINES CGE GT AP 7.0 13 10 (5+5) W ei2012 (W eitzel et al., 2012) En Ec o (SI) D AR T CGE GT AP 7.0 13 2 (1+1) FF2012 (Fisc her and Fo x, 2011) En E co (SI) GT APinGAMS CGE GT AP 7.0 10 5 (4+1) BB2012 (Bo eters and Bollen, 2012) En Eco (SI) W orldSc an CGE GT AP 7.0 14 9 (3+6) Spr2012 (Springmann, 2012) En Eco (SI) CV O CGE GT AP 7.1 11 7 (4+3) Car 2012 (Caron, 2012) En Eco (SI) CEPE CGE GT AP 7.0 11 8 (4+4) Bed2012 (Bednar-F riedl et al., 2012) et al. En Eco (SI) WEG_CENTER CGE GT AP 7.0 4 24 (12+12) Boh2012-3 (Böhringer et al., 2012c) En Eco (SI) SNO W CGE GT AP 7.1 12 10 (1+9) An t2012 (An timiani et al., 2012) En Eco (SI) GT AP-E CGE GT AP 7.1 10 3 (1+2) Mat2009 (Matto o et al., 2009) W orld Bank WP ENVISA GE CGE GT AP 7. 0 9 6 (1+5) McKW2009 (McKibbin et al., 2008) Lo wy Institute WP G-Cub ed CGE n.a 9 4 (2+2) PS2007 (P eterson and Sc hleic h, 2007) ISI W orking P ap er GT AP-E CGE GT AP 6.0 15 6 (2+4) KH2010 (Kuik and Hofk es, 2010) Energy P olic y GT AP-E CGE GT AP 6.0 10 3 (1+2) Win2011 (Winc hester et al., 2011) MIT W orking P ap er EP PA CGE GT AP 6.0 9 5 (1+4) BabR2005 (Babik er, 2005) The Energy Journal No Name CGE GT AP 5.0 12 2 (1+1) MM2004 (Mathiesen and Mo estad, 2004) The Energy Journal SIM PE 6 11 (9+2) MQ2011-1 (Monj on and Quirion, 2011a) Ecological Economics CASE II PE 5 20 (10+10) DQ2005 (Demailly et al., 2005) OECD Rep ort CEMSIM-GEO PE 6 3 (1+2) DQ2008 (Demailly and Quir ion, 2008) E nergy Economic s CASE I PE 6 6 (3+3) MQ2011-2 (Monjon and Quirion, 2011b) Climate P olicy CASE II PE 5 6 (2+4)
Figure 1: Leakage ratio in selected studies (mean, minimum and maximal values with or without
BCA), ranked by mean value without BCA
Figure 2: Leakage ratio reduction in case of Border Carbon Adjustment (same ranking as in
figure 1)
Figure 3: Output change of EITE industries in selected studies (ranked by mean value without
BCA)
Figure 4: Welfare variation in abating coalition (ranked by mean value without BCA)
Figure 5: Leakage ratio (Kernel density estimates) with the two methods of merging, “scenarios
Figure 6: Output change of EITE industries (Kernel density estimates) for two cases. scenarios
equality and articles equality
Figure 7: Welfare variation (Kernel density estimates) for two cases. scenarios equality and
articles equality
Figure 8: BCA leakage reduction (in percentage points)
4. Meta-regression: the model
Meta-regression is widely used in meta-analysis as it is an interesting way to go beyond standard litterature review by combining numerical results from different studies in a statistical manner (Vermont and De Cara, 2010; Kuik et al., 2009; Horváthová, 2010). Several econometric problems occurs during this exercice: data heterogeneity, outliers, heteroskedasticity in effect size variance, non independance of observations of the same primary studies (Nelson and Kennedy, 2009).
Hetereroskedasticity in effect size variance is usually treated by weighting observations by the inverse of variance estimations or sample size (Van Houtven et al., 2007). As we deal with simulation model results and not statistical studies results this method is irrelevant. One may think that among all studies some are more relevant or better than others and should then be weighted more, but we think that putting weights based on the “quality” of the studies would have been too arbitrary. Heterogeneity is addressed with the use of methodological and hypotheses variables in the meta-regression and by attemps to avoid a publication bias as discussed above.
Regarding the non independance of observations of the same primary studies, some authors favor the use of a single estimate per study (Stanley, 2001) but this shrinks dramatically the pool of estimates. In our case we treat this issue with a “cluster-robust” estimator based on Huber and White (Huber, 1967; White, 1980) (as in (Kuik et al., 2009; Vermont and De Cara, 2010)): the observations are gathered in 15 clusters (see table 1). Studies with many observations are the first clusters9, then studies that share common features are gathered in same clusters (2 or 3 studies
per cluster representing 10-15 observations)10.
To treat outliers, we have developped a routine based on the rreg Stata command, which performs a robust regression using iteratively reweighted least squares. First we make a robust regression using this algorithm and keep the final weights. Then we dismiss data that are weighted below a certain threshold (5%)11. Finally we make a cluster-robust regression on this reduced
sample. We show both results (with and without dismissing outliers) in table 3 and one can see that, with only about 10% of data in the sample dismissed, outliers-free results are much more significant.
We test three variations of the two models: one for all leakage ratio estimates, one for no BCA estimates and the last one for BCA estimates:
Leakage= Const + β1GE+ β2Coasize+ β3Abatement+ β4Link
+β5Of f set+ β6GHG+ β7Armington+ β8BCA+ u
LeakageN oBCA= Const + β1GE+ β2Coasize+ β3Abatement+ β4Link
+β5Of f set+ β6GHG+ β7Armington+ u
LeakageBCA= Const + β1GE+ β2Coasize+ β3Abatement+ β4Link
+β5Of f set+ β6GHG+ β7Armington+ β9Exp
+β10F oreign+ β11AllSect+ β12Indirect+ u
The first variables used are GE (a dummy variable set equal to 1 if the model is a CGE).
Coasize(the size of the abating coalition in percentage of worldwide emissions). Abatement (the
9With the exception of (Monjon and Quirion, 2011a,b) which are merged because results are from the same model CASE II
10We tested different clusters without significant changes. Results are available upon demand
11Several values were tested and 5% was the best compromise to have significant results without dismissing too many values. 21 out of the 25 studies had less than one result dismissed and 2 studies had a significant share of dismissed results (Mathiesen and Moestad, 2004; Peterson and Schleich, 2007) which have relatively high estimates of leakage ratio).
Abatement target)12. Then we have three dummy variables related to scenarios Link (if permit
trading is authorized between the different regions of the coalition13). Offset (if Offset credits
are authorized) and GHG (if all carbon sources, and not only CO2 are considered).
Armington elasticities, which are used to model international trade, are considered as a crucial parameter in leakage ratio estimates (Monjon and Quirion, 2011a; Alexeeva-Talebi et al., 2012a; Balistreri and Rutherford, 2012). Most of the time they were not Explicitely displayed in the articles. However some studies made sensitivity analyses on this parameter (for example doubling or dividing in half the original values). In the meta-analysis, the Armington parameter is then not a numerical value but an “almost dummy” Linked with “high” (+1), “low” (-1), “very high” (+2) or “very low” (-2) Armington elasticities values14 when sensitivity analysis were performed
on these parameters. It would have been interesting to incorporate a parameter for the fossil fuel supply elasticity which is recognized to be determinant in the leakage ratio estimations for the international fossil fuel channel (Light et al., 1999; Gerlagh and Kuik, 2007). However, because they weren’t available most of time, it was decided not to take them into account in the meta-regression.
BCA is another dummy which takes the value of 1 if BCA is implemented and four dummy
parameters detail the policy features of the BCA: Exp (if Export rebates are part of the scheme),
F oreign(if the adjustement if based on foreign specific emissions, instead of home specific
emis-sions or best available technology). AllSect (if the adjustment concerns all sectors and not only EITE sectors), and indirect (if indirect emissions are taken into account in the adjustment). Table 2 summarizes information about the regression variables.
12The logarithm of Coasize and Abatement have been tried as variables without changing the statistical signifi-cancy of the results
13which supposes that the abating coalition is composed of more than one region in the model
14In (Balistreri and Rutherford, 2012) the Melitz structure (Melitz 2003) is considered equivalent to “very high” Armington
T able 2: V ariable s of the Meta-regression Name V ariable typ e Explanation Summary statistics GE Dumm y 1 if the mo del is a CGE 268 (87% of the cases) Coasize P ercen tage Size of the abating coaliti on Mean 35% Mo de: 15% (p ercen tage of w orld wide emission s) (for 39% of the cases) Abatemen t P ercen tage Abatemen t target Me an 19% Mo de: 20% for 61% of the cases Link Dumm y P ossibilit y to sell permits accross the coali tion 83 (27% of the cases) Offset Du mm y P ossibilit y to use Offsets to meet 18 (6% of th e cases) the Abatemen t target GHG Dumm y If carb on pricing is extended to all GHG sources 9 (3% of the cases) Armington 5 value s 1 (resp. -1) corresp onds to "Armington high" 31 for 1 and 37 for -1 (-2/-1/0/1/2) (resp. "Armington lo w"). 2 for "Melitz" or (10% and 12% of the cases) higher Armington than "Armin gton high" BCA Dumm y 1 if there is Border Carb on A djustmen t 167 (54% of the cases) Exp Dumm y 1 if exp ort rebates are part of the sc heme 146 (87% of the BCA ca ses) Foreign Dumm y 1 if the adjustmen t is based on foreign sp ec ific 114 (68% of the BCA cases) emissions (or av erage foreign), 0 if home (or BA T) AllSect Dumm y 1 if the ad justmen t concerns all sectors 47 (28% of the BCA cases) and not sp ecifically Energy-in tensiv e sec tors Indirect Dumm y 1 if indirect emissions are tak en in to accoun t 152 (91% of the BCA cases) in the ad justemen t
5. Discussion of the results
Interpreting the results, one must bear in mind that, though meta-regression analysis is a powerful tool to incorporate all the sources of variability in a single model, one should not give excessive credit to the results. Indeed, the calcultated coefficients depends both on primary models that made different assumptions but also on the statistical variability of the parameters which is, except for the variable BCA, far from being perfect. For example Abatement is set at 20% for 61% of the cases and varies within two studies only (Böhringer et al., 2012a; Demailly and Quirion, 2008). Indirect is set at the value 1 for 91% of the cases and varies within two studies only (Böhringer et al., 2012c; Monjon and Quirion, 2011b). This aspect is unavoidable in a meta-regression analysis as we take already made studies and don’t design the scenarios by ourself. We still include these “poorly variable” variables in the regression, knowing that despite statistical methods designed to capture the slighest statistical effects, they may not appear as statistically significant as they may have been or that the value of the coefficients may be biased.
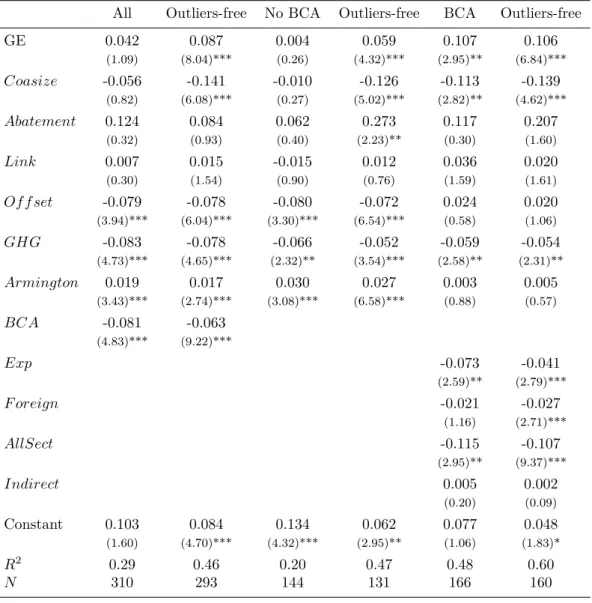
The meta-regression Explains respectively 29%, 20% and 48% of the variance in the leakage ratio estimation in the standard model (for All, No BCA estimates and BCA estimates) and 46%, 47% and 60% without outliers. The relatively higher values of the outlier-free models (where roughly values of (Peterson and Schleich, 2007) and (Mathiesen and Moestad, 2004) are dismissed) indicate that estimates of recent models are converging. However the share of unExplained vari-ability (mainly due to differences between models) remains high: about half of the varivari-ability in the estimates can’t be Explained in our meta-regression model. In the following, we will discuss the results of the outlier-free model (in terms of numerical values) because results are more signif-icant. However, these results don’t depart notably from the standard model and roughly the same conclusions could be made with the standard model results but with less statistical significancy.
The difference between CGE models and other models is statistically significant and is posi-tive. We find that, all other parameters being constant, leakage ratio without BCA policy is 6 percentage points higher in CGE models and a bit less than the double under BCA policy, which is a noteworthy difference. The lack of non CGE models estimates (they constitute only 13% of studies) must remind us to interpret these results with caution. An Explanation could be that CGE models include both channels of leakage ratio, the competitiveness channel and the inter-national fossil fuel channel, which is recognized to predominate (Gerlagh and Kuik, 2007; Fischer and Fox, 2011; Weitzel et al., 2012) whereas partial equilibrium models only include the first one (except for (Mathiesen and Moestad, 2004)).
The coefficient for the coalition size is positive and statistically significant. Changing the size of the coalition from Europe (15% of world’s emissions in 2004) to Annex 1 plus China except Russia (71% of world’s emissions in 2004) would involve in the model a decrease of leakage ratio of about 7 percentage points.
Theoretically, the bigger is the Abatement, the higher is the leakage in absolute terms (tons of carbon emissions). As the leakage ratio is the leakage in absolute terms divided by the Abatement and this latter increases as well, there is an indeterminacy about the relationship between the Abatement and the leakage ratio. In the meta-regression model, the correlation is positive, but the statistical significancy is weak. In (Alexeeva-Talebi et al., 2012b) (which was not included in our study because there was no BCA), the correlationship is negative (leakage of 32%, 29% and 27% for Europe abating respectively 10%, 20% and 30% of its emissions). In (Böhringer et al., 2012b) however, the relationship is positive (leakage of 15.3%, 17.9% and 21% for Europe abating respectively 10%, 20% and 30% of its emissions).
Concerning the policy parameters, authorizing permit trading (Linking) is not statistically significant, but the use of Offset credits as well as extending carbon pricing to all GHG sources is. All other parameters being fixed, the use of Offset credits would reduce the leakage ratio by about 8 percentage points (but the coefficient isn’t statistically significant when there are BCA), which is the same order of magnitude for the effect of taxing all GHG sources.
The Armington parameter proves statistically significant for All and no BCA leakage ratio estimates and is positive as Expected. A higher value, meaning a more “flexible” international trade modeled, induces more impact of price differentiation accross regions on trade flows, and
therefore more leakage ratio. In our meta-regression model, taking high values of Armington elasticities instead of low values would then lead to leakage ratio estimates about 2x1.7=3.4 percentage points higher.
With a very high p-value, we find that the BCA parameter is statistically significant and is negative. All other parameters being constant, BCA implementation reduces the leakage ratio by 6.3 percentage points. This statistical finding fits the data in the descriptive statistics section (figure 8). More specifically, among the BCA options, including all sectors instead of only EITE sectors would have the most important impact (decrease of 10.7 percentage points of the leakage ratio) followed by the inclusion of export rebates (decrease of 4.1 percentage points) and basing adjustement on foreign specific emissions instead of home specific emissions (decrease of 2.7 per-centage points). In this meta-regression model it is then the BCA option with high administrative costs (adjustment to all sectors) rather than the politically and juridically risky options (export rebates and especially foreign carbon content based adjustment) that would be the most efficient to reduce leakage. The inclusion of indirect emissions is without surprise not statistically signifi-cant (there are very little statistical variability for this parameter). In the two studies where this feature is included in the scenarios, it is proven to reduce leakage: in (Böhringer et al., 2012a), from 0.5 to 2 percentage points, depending on the adjustment level (Böhringer et al., 2012c), and in (Monjon and Quirion, 2011a), from 1.5 to 2 percentage points.
Meta-regression results can also be used to make out-of-sample predictions, which is called benefit transfer (Nelson and Kennedy, 2009; Van Houtven et al., 2007). This exercice is especially interesting for meta-analysis of empirical studies as they allow forecast for other locations or commodities which may save the employed ressources to make additional surveys. Here we show as an example the results of leakage ratio estimations with the meta-regression analysis coefficients for different abating coalitions and policies (see table 4). The estimated values of leakage ratio seem reasonable but the 95% confidence intervals are wide.
Table 3: Meta-regression Results
All Outliers-free No BCA Outliers-free BCA Outliers-free
GE 0.042 0.087 0.004 0.059 0.107 0.106 (1.09) (8.04)*** (0.26) (4.32)*** (2.95)** (6.84)*** Coasize -0.056 -0.141 -0.010 -0.126 -0.113 -0.139 (0.82) (6.08)*** (0.27) (5.02)*** (2.82)** (4.62)*** Abatement 0.124 0.084 0.062 0.273 0.117 0.207 (0.32) (0.93) (0.40) (2.23)** (0.30) (1.60) Link 0.007 0.015 -0.015 0.012 0.036 0.020 (0.30) (1.54) (0.90) (0.76) (1.59) (1.61) Of f set -0.079 -0.078 -0.080 -0.072 0.024 0.020 (3.94)*** (6.04)*** (3.30)*** (6.54)*** (0.58) (1.06) GHG -0.083 -0.078 -0.066 -0.052 -0.059 -0.054 (4.73)*** (4.65)*** (2.32)** (3.54)*** (2.58)** (2.31)** Armington 0.019 0.017 0.030 0.027 0.003 0.005 (3.43)*** (2.74)*** (3.08)*** (6.58)*** (0.88) (0.57) BCA -0.081 -0.063 (4.83)*** (9.22)*** Exp -0.073 -0.041 (2.59)** (2.79)*** F oreign -0.021 -0.027 (1.16) (2.71)*** AllSect -0.115 -0.107 (2.95)** (9.37)*** Indirect 0.005 0.002 (0.20) (0.09) Constant 0.103 0.084 0.134 0.062 0.077 0.048 (1.60) (4.70)*** (4.32)*** (2.95)** (1.06) (1.83)* R2 0.29 0.46 0.20 0.47 0.48 0.60 N 310 293 144 131 166 160 * p < 0.1; ** p < 0.05; *** p < 0.01
Abating coalition Europe A1xR A1xR+China
No BCA (a) 17% (7% 27%) 12% (1% 24%) 10% (-3% 22%)
"light" BCA (b) 7% (-10% 23%) 6% (-16% 21%) 0% (-20% 19%) "strong" BCA (c) 0% (-21% 21%) -4% (-27% 19%) -7% (-31% 17%)
A1xR: Annex 1 without Russia (a) estimation with the “All” model
(b) estimation with the “BCA” model. AllSect = 1 only
(c) estimation with the “BCA” model. AllSect = 1. F oreign = 1 and Exp = 1
Table 4: Leakage ratio estimations by the meta-regression model (20% Abatement target)
6. Conclusion
A global climate policy is unlikely to be implemented in the years to come and the adoption of ambitious national or regional climate policies is hindered by claims of industry competitiveness losses and carbon leakage. Border Carbon Adjustment (BCA) has been proposed to overcome these hurdles but its potential efficacy has been controversial. Moreover some authors argue that BCA aims at protecting heavy industries competitiveness rather than at tackling leakage (Kuik and Hofkes, 2010) while other authors defend that BCA implementation cannot be justified only for competitiveness motives (Cosbey et al., 2012). Finally, BCA proposals differ by key design choices such as the coverage of exports and imports or only of imports, the inclusion of indirect (electricity-related) emissions, or the adjustment level, which can be the domestic or foreign average specific emissions, or best-available technologies. How BCA performance would be impacted by these choices remains an open question.
To shed some light of these issues, we have gathered and analysed 310 estimates of carbon leakage and output loss in Energy-Intensive Trade-Exposed (EITE) sectors from 25 studies dat-ing from 2004 to 2012. A meta-regression is then conducted to capture the impact of different assumptions on the model results.
Across our studies, the leakage ratio ranges from 5% to 25% (mean 14%) without BCA and from -5% to 15% (mean 6%) with BCA. The main contribution of this article is that BCA does reduce the leakage ratio with robust statistical significance: all parameters in the meta-analysis being constant, the ratio drops by 6 percentage points with the implementation of BCA. In most CGE models some leakage remains after BCA implementation, which is not the case with partial equilibrium (PE) models. The most likely Explanation is that in CGE models, a part of leakage is due to the international fossil fuel price channel which is unaffected by BCA, while most PE models do not feature this leakage channel.
Concerning output loss for EITE industries, results are in sharp contrast to results about leakage: CGE models predict loss in a range from 0% to 4% (mean 2%) without BCA while PE models foresee more than the double. BCA corrects for the output loss in CGE models but less so in sectoral models. The Explanation seems that in PE models, a higher output loss is due to a drop in demand for CO2-intensive materials, loss which is mitigated by BCA.
The features of BCA (coverage, level of adjustment, etc.) are of the highest importance for the WTO consistency, feasibility, and political acceptability. The purpose of the meta-regression was also to assess their impact on competitiveness and leakage. In the meta-regression, the inclusion of all sectors in the scheme appears to be the most efficient feature to reduce leakage ratio, followed by the inclusion of export rebates and adjustment level based on foreign carbon content. Yet one can guess, in the case of hypothetical BCA implementation, that political and juridical aspects will be the more determinant and that only a “light” version (adjustment based on best available technologies, probably without the inclusion of indirect emissions) is likely to see the light of day. Besides, the importance of the coalition size and the Abatement target are statistically con-firmed and quantified: the smaller the abating coalition and the more stringent the cap, the bigger the leakage ratio. Policy features providing where and what flexibility (the possibility of Offsets and extension to all greenhouse gases) reduce the leakage ratio.
Finally, this meta-analysis confirms the importance of Armington elasticities in the leakage ratio estimation, a result crucial in terms of uncertainty analysis. This calls for more transparency and sensitivity analyses regarding these parameters in future studies.
Alexeeva-Talebi, V., Böhringer, C., Löschel, A., and Voigt, S. (2012a). The value-added of sectoral disaggregation: Implications on competitive consequences of climate change policies. SSRN
eLibrary.
Alexeeva-Talebi, V., Böhringer, C., and Moslener, U. (2012b). Climate policy and competitiveness: An economic impact assessment of EU leadership in emission regulation. Technical report. Antimiani, A., Costantini, V., Martini, C., Salvatici, L., and Tommasino, M. C. (2012). Assessing
Babiker, M. H. (2005). Climate change policy, market structure, and carbon leakage. Journal of
International Economics, 65(2):421–445.
Balistreri, E. J. and Rutherford, T. F. (2012). Subglobal carbon policy and the competitive selection of heterogeneous firms. Energy Economics.
Barrio, M. and Loureiro, M. L. (2010). A meta-analysis of contingent valuation forest studies.
Ecological Economics, 69(5):1023–1030.
Bednar-Friedl, B., Schinko, T., and Steininger, K. W. (2012). The relevance of process emissions for carbon leakage: A comparison of unilateral climate policy options with and without border carbon adjustment. Energy Economics.
Böhringer, C., Balistreri, E. J., and Rutherford, T. F. (2012a). The role of border carbon ad-justment in unilateral climate policy: Overview of an energy modeling forum study (EMF 29).
Energy Economics, 34:S97–S110.
Böhringer, C., Bye, B., Fæhn, T., and Rosendahl, K. E. (2012b). Alternative designs for tariffs on embodied carbon: A global cost-effectiveness analysis. Energy Economics, 34:S143–S153. Böhringer, C., Carbone, J. C., and Rutherford, T. F. (2012c). Unilateral climate policy design:
Efficiency and equity implications of alternative instruments to reduce carbon leakage. Energy
Economics.
Boeters, S. and Bollen, J. (2012). Fossil fuel supply, leakage and the effectiveness of border measures in climate policy. Energy Economics, 34:S181–S189.
Brander, L. M. and Koetse, M. J. (2011). The value of urban open space: Meta-analyses of contin-gent valuation and hedonic pricing results. Journal of Environmental Management, 92(10):2763– 2773.
Caron, J. (2012). Estimating carbon leakage and the efficiency of border adjustments in general equilibrium does sectoral aggregation matters? Energy Economics.
Cosbey, A., Dröge, S., Fischer, C., Reinaud, J., Stephenson, J., Weitscher, L., and Wooders, P. (2012). A guide for the concerned: Guidance on the elaboration and implementation of border carbon adjustment. Policy Report 03, ENTWINED.
Demailly, D. and Quirion, P. (2008). European emission trading scheme and competitiveness: A case study on the iron and steel industry. Energy Economics, 30(4):2009–2027.
Demailly, D., Quirion, P., Szabo, L., Hidalgo, I., Ciscar, J. C., Soria, A., and Russ, P. (2005). The competitiveness impacts of CO2 emissions reductions in the cement industry. Technical report, OECD.
Doucouliagos, H. and Stanley, T. D. (2009). Publication selection bias in minimum-wage research? a meta-regression analysis. British Journal of Industrial Relations, 47(2):406–428.
Dröge, S., van Asselt, H., Brewer, T., Ismer, R., Mehling, M., Monjon, S., Quirion, P., Neuhoff, K., Schumacher, K., Mohr, L., Suwala, W., Takamura, Y., Voituriez, T., Wang, X., and Grubb, M. (2009). Tackling leakage in a world of unequal carbon prices. Technical report, Climate Strategies, Cambridge, UK.
Ellerman, D., Convery, F., and de Perthuis, C. (2010). Pricing Carbon : The European Union
Emissions Trading Scheme. Cambridge, UK, cambridge university press edition.
Fischer, C. and Fox, A. (2011). Comparing policies to combat emissions leakage: Border carbon adjustments versus rebates. RFF discussion paper.
Gerlagh, R. and Kuik, O. (2007). Carbon leakage with international technology spillovers. 17
Ghosh, M., Luo, D., Siddiqui, M. S., and Zhu, Y. (2012). Border tax adjustments in the climate policy context: CO2 versus broad-based GHG emission targeting. Energy Economics.
Hoel, M. (1996). Should a carbon tax be differentiated across sectors? Journal of Public
Eco-nomics, 59(1):17–32.
Horváthová, E. (2010). Does environmental performance affect financial performance? a meta-analysis. Ecological Economics, 70(1):52–59.
Huber, P. (1967). The behavior of maximum likelihood estimates under nonstandard conditions. pages 221–233, Statistical Laboratory of the University of California, Berkeley.
Ismer, R. and Neuhoff, K. (2007). Border tax adjustment: a feasible way to support stringent emission trading. European Journal of Law and Economics, 24(2):137–164.
Jakob, M., Marschinski, R., and Hübler, M. (2011). Between a rock and a hard place: A trade-theory analysis of leakage under production-and consumption-based policies. In NCCR Climate
Economics and Law Conference, pages 16–17.
Krugman, P. (1994). Competitiveness: a dangerous obsession. Foreign affairs, page 28–44. Kuik, O., Brander, L., and Tol, R. S. J. (2009). Marginal abatement costs of greenhouse gas
emissions: A meta-analysis. Energy Policy, 37(4):1395–1403.
Kuik, O. and Hofkes, M. (2010). Border adjustment for european emissions trading: Competitive-ness and carbon leakage. Energy Policy, 38(4):1741–1748.
Lanzi, E., Chateau, J., and Dellink, R. (2012). Alternative approaches for levelling carbon prices in a world with fragmented carbon markets. Energy Economics, 34, Supplement 2(0):S240–S250. Light, M. K., Kolstad, C. D., and Rutherford, T. F. (1999). Coal markets and the kyoto protocol.
Boulder, CO: University of Colorado.
Markusen, J. R. (1975). International externalities and optimal tax structures. Journal of
Inter-national Economics, 5(1):15–29.
Mathiesen, L. and Moestad, O. (2004). Climate policy and the steel industry: Achieving global emission reductions by an icomplete climate agreement. Energy Journal, 25(4)(91-114). Mattoo, A., Subramanian, A., van der Mensbrugghe, D., and He, J. (2009). Reconciling climate
change and trade policy. SSRN Electronic Journal.
McKibbin, W. J., Wilcoxen, P. J., Braathen, N. A., Tao, T. H., and Levinson, A. (2008). The economic and environmental effects of border tax adjustments for climate policy [with com-ments]. Brookings Trade Forum, pages 1–34. ArticleType: research-article / Issue Title: Cli-mate Change, Trade, and Competitiveness: Is a Collision Inevitable? / Full publication date: 2008/2009 / Copyright © 2008 Brookings Institution Press.
Monjon, S. and Quirion, P. (2011a). Addressing leakage in the EU ETS: border adjustment or output-based allocation? Ecological Economics, 70(11):1957–1971.
Monjon, S. and Quirion, P. (2011b). A border adjustment for the EU ETS: reconciling WTO rules and capacity to tackle carbon leakage. Climate Policy, 11(5):1212–1225.
Nelson, J. P. and Kennedy, P. E. (2009). The use (and abuse) of meta-analysis in environmental and natural resource economics: an assessment. Environmental and Resource Economics, 42(3):345– 377.
Ojea, E. and Loureiro, M. L. (2011). Identifying the scope effect on a meta-analysis of biodiversity valuation studies. Resource and Energy Economics, 33(3):706–724.
Peterson, E. and Schleich, J. (2007). Economic and environmental effects of border tax adjust-ments. Working Paper Sustainability and Innovation S 1/2007, Fraunhofer Institute Systems and Innovation Research.
Quirion, P. (2010). Competitiveness and leakage. In Climate Change Policies - Global Challenges
and Future Prospects, pages 77–94. Emilio Cerdá, University of Vigo, Spain.
Quirion, P. (2011). Les quotas échangeables d’émissions de gaz à effet de serre: éléments d’analyse économique. mémoire d’habilitation à diriger des recherches. Technical report, EHESS. Rayner, S. (2010). How to eat an elephant: a bottom-up approach to climate policy. Climate
Policy, 10(6):615–621.
Reinaud, J. (2008). Issues behind competitiveness and carbon leakage. focus on heavy industrys. IEA information paper, International Energy Agency, OECD/IEA Paris.
Richardson, L. and Loomis, J. (2009). The total economic value of threatened, endangered and rare species: An updated meta-analysis. Ecological Economics, 68(5):1535–1548.
Rothstein, H. R., Sutton, A. J., and Borenstein, M. (2006). Publication bias in meta-analysis. In Co-Chair, H. R. R., Co-Author, A. J. S., and PI, M. B. D. A. L., editors, Publication Bias in
Meta-Analysis, page 1–7. John Wiley & Sons, Ltd.
Sartor, O. (2013). Carbon leakage in the primary aluminium sector: What evidence after 6.5 years of the EU ETS? SSRN Scholarly Paper ID 2205516, Social Science Research Network, Rochester, NY.
Smith, V. and Pattanayak, S. K. (2002). Is meta-analysis a noah’s ark for non-market valuation?
Environmental and Resource Economics, pages 271–296.
Springmann, M. (2012). A look inwards: carbon tariffs versus internal improvements in emissions-trading systems. Energy Economics.
Stanley, T. D. (2001). Wheat from chaff: Meta-analysis as quantitative literature review. Journal
of Economic Perspectives, 15(3):131–150.
Stanley, T. D. (2005). Beyond publication bias. Journal of Economic Surveys, 19(3):309–345. Stanley, T. D. and Jarrell, S. B. (1989). Meta-regression analysis: A quantitative method of
literature surveys. Journal of Economic Surveys, 3(2):161–170.
Van Houtven, G., Powers, J., and Pattanayak, S. K. (2007). Valuing water quality improvements in the united states using meta-analysis: Is the glass half-full or half-empty for national policy analysis? Resource and Energy Economics, 29(3):206–228.
Vermont, B. and De Cara, S. (2010). How costly is mitigation of non-CO< sub> 2</sub> green-house gas emissions from agriculture?: A meta-analysis. Ecological Economics, 69(7):1373–1386. Weitzel, M., Hübler, M., and Peterson, S. (2012). Fair, optimal or detrimental? environmental vs.
strategic use of border carbon adjustment. Energy Economics, 34:S198–S207.
White, H. (1980). A heteroskedasticity-consistent covariance matrix estimator and a direct test for heteroskedasticity. Econometrica, 48(4):817.
Winchester, N., Paltsev, S., and Reilly, J. M. (2011). Will border carbon adjustments work? The
B.E. Journal of Economic Analysis & Policy, 11(1).
Zhang, Z. (2012). Land competitiveness and leakage concerns and border carbon adjusments. Nota di Lavoro 80.2012, Fondazione ENI Enrico Mattei.
7. Annex
T able 5: Summary statistics for studies. Leakage Ratio No BCA BCA Mean Range Med Std Obs Mean Range Med Std Obs Boh2012 12.2% (5.0% 23.9%) 12% 5% 15 7.5% (2.0% 12.0%) 8% 3% 13 Gho2012 10.4% (2.5% 26.2%) 8% 9% 6 0.8% (-7.8% 9.5%) 7% 5% 12 A T2012 14.6% (12.6% 18.0%) 14% 2% 27 10.0% (9.8% 10.9%) 10% 0% 27 Lan2012 4.4% (2.0% 9.1%) 4% 2% 20 -6.2% (-21.0% 4.1%) -2% 8% 24 Boh2012-2 10.5% (4.0% 21%) 9% 6% 9 7.9% (2.3% 19.4%) 5% 7% 9 BalR2012 17.9% (12% 32.5%) 14% 9% 5 10.8% (7.0% 19.0%) 9% 5% 5 W ei2012 19.5% (19.5% 19.5%) 20% 0% 1 17.5% (17.5% 17.5%) 18% 0% 1 FF2012 13.5% (7.0% 23.0%) 12% 7% 4 19.0% (19.0% 19.0%) 19% 0% 1 BB2012 19.5% (10.0% 32.5%) 18% 9% 3 16.5% (8.9% 26.9%) 15% 8% 6 Spr2012 14.2% (13.6% 14.7%) 14% 1% 4 11.4% (11.1% 11.6%) 11% 0% 3 Car 2012 16.0% (15.0% 17.0%) 16% 1% 4 12.5% (11.0% 13.0%) 13% 1% 4 Bed2012 22.4% (14.3% 38.4%) 19% 9% 12 11.7% (5.8% 23.0%) 10% 7% 12 Boh2012-3 17.0% (17.0% 17.0%) 17% 0% 1 12.6% (8.0% 16.0%) 14% 3% 9 An t2012 13.5% (13.5% 13.5%) 14% 0% 1 12.0% (11.1% 12.9%) 12% 1% 2 Mat2009 4.0% (4.0% 4.0%) 4% 0% 1 -1.8% (-7.0% 1.0%) 0% 4% 5 McKW2009 7.5% (4.0% 11.0%) 8% 5% 2 -22.5% (-41. 0% 22.5%) -23% 26% 2 PS2007 26.5% (25.0% 28.0%) 27% 2% 2 24.0% (21.0% 27.0%) 24% 3% 4 KH2010 11.0% (11.0% 11.0%) 11% 0% 1 9.0% (8.0% 10.0%) 9% 1% 2 BabR2005 17.0% (17.0% 17.0%) 17% 0% 1 16.0% (16.0% 16.0%) 16% 0% 1 MM2004 24.2% (0% 41%) 26% 11% 9 -4.5% (-18.0% 9.0%) -5% 19% 2 MQ2011-1 8.2% (7.0% 11%) 8% 5% 10 -0.9% (-4.2% 3.2%) -1% 2% 10 DQ2005 13.0% (13.0% 13.0%) 13% 0% 1 -1.0% (-6.0% 4.0%) -1% 7% 2 DQ2008 9.0% (7.0% 11.0%) 9% 2% 3 -2.0% (-2.0% 2.0%) -2% 0% 3 MQ2011-2 10.4% (10.4% 10.4%) 10% 0% 2 5.5% (3.8% 7.1%) 2% 2% 4
T able 6: Summary statistics for stud ies. Output change for EITE industries No BCA BCA Sector Mean Range Med Std Obs Mean Range Med Std Obs Boh2012 "EITE" (1) -2.86% (-5.20% -1.20%) -2.8% 1.1% 13 -1.03% (-3.00% -0.20%) -0.9% 0.9% 13 Gho2012 "EITE" (1) -5.66% (-7.73% -3.58%) -5.7% 2.4% 4 0.80% (0.53%-0.94%) 0.9% 0.2% 4 A T2012 Own Av er age (7) -1.83% (-2.80% -1.00%) -1.7% 0.9% 3 0.07% (-0.10% 0.20%) 0.1% 0.2% 3 Lan2012 "EIT sectors" (2) -2.17% (-2.70% -1.90%) -1.9% 0.5% 3 -0.45% (-0.50% -0.30%) -0.5% 0.1% 4 Boh2012-2 "EITE" (1) -2.30% (-4.95% -0.55%) -2.2% 1.5% 9 -0.64% (-1.29% -0.20%) -0.6% 0.4% 9 Spr2012 "En ergy-in tens iv e go od s (EIT) (3) -2.01% (-2.31% -1.77%) -2.0% 2.2% 4 -0.27% (-0.30% -0.23%) -0.3% 0.0% 3 Car 2012 Own Av erage (6) -3. 20% (-3.20% -3.20%) -3.2% 0.0% 1 0 Mat2009 "Energy-in tensiv e Man ufacturing" (4) -2.30% (-2.30% -2.30%) -2.3% 0.0% 5 -0.08% (-1.50% 2.20%) -0.3% 1.4% 5 McKW2009 "Non dur ables" (5) -0.15% (-0.20% -0.10%) -0.2% 0.1% 2 -0.25% (-0.30% -0.20%) -0.3% 0.1% 2 PS2007 Own Av erage (6) -0.40% (-0.40% -0.40%) -0.4% 0.0% 4 0.20% (0.10%-0.30%) 0.2% 0.1% 4 KH2010 Own Av erage (8) -2.00% (-2.00% -2.00%) 0% 0.0% 2 -0.05% (-0.60% 0.50%) -0.1% 0.8% 2 BabR2005 "Energy In tensiv e Go ods" (3) -1.20% (-1.20% -1.20%) -1.2% 0.0% 1 -0.30% (-0.30% -0.30%) -0.3% 0 1 MM2004 Steel (onl y sector) -7.10% (-7.10% -7.10%) -7.1% 0.0% 2 -3.05% (-4.40% -1.70%) -3.1% 1.9% 2 MQ2011-1 Own Av erage (9) -7.86% (-7.86% -7.86%) -7.9% 0.0% 1 -6.41% (-6.90% -5.80%) -6.4% 0.4% 5 DQ2005 Cemen t (only sector) -7.50% (-7.50% -7.50%) -7.5% 0.0% 2 -2.50% (-3.00% -2.00%) -2.5% 0.7% 2 DQ2008 Own Av erage (9) -11.67% (-19.00% 5.00%) -11.7% 7.0% 3 -4.33% (-7.00% -2.00%) -4.3% 2.5% 3 MQ2011-2 Own Av erage (9) -7.47% (-7.47% -7.47%) -7.5% 0.0% 1 -5.47% (-6.40% -5.00%) -5.2% 0.7% 4 (1) Aggregation of 5 sectors (Refined go ods, Chemical pro ducts, Non-metallic minerals, Iron and Steel industry ,Non-ferrous metals) (2) Aggregation of 4 sectors: same as (1) except no Refine d go ods (3) 1 sector in the mo del. Probably same as (2) (4) Sp ecific sectors non sp ecified (5) One se ctor (6) Iron and Steel and Non Metall ic Minerals (7) Iron and Steel and Other Non Metallic Minerals (8) Steel an d Mineral Pro duc ts (9) Steel and Cemen t 21
T able 7: Summary statistics for stu dies. W elfare variation for the abating coalition No BCA BCA Mean Range Med Std Obs Mean Range Med Std Ob s Boh2012 GDP -0.40% (-0.40% -0.40%) -0.40% 0.00% 1 -0.40% (-0.32% -0.32%) -0.32% 0.00% 1 Gho2012 W elfare -0. 66% (-1.58% -0.28%) -0.54% 0.47% 6 -0.66% (-0.89% -0.21%) -0.35% 0.23% 12 A T2012 W elfare -0.35% (-0.62% -0.21%) -0.33% 0.13% 27 -0.35% (-0.50% -0.25%) -0.28% 0.11% 27 Lan2012 W elfare -0. 17% (-0.35% -0.01%) -0.18% 0.09% 23 -0.01% (-0.12% 0.09%) -0.02% 0.04% 24 BalR2012 W elfare -0.43% (-0.85% 0. 02%) -0.60% 0. 41% 5 -0.43% (-0.2% -0.40%) 0.01% 0.21% 5 W ei2012 W elfare -0.50% (-0.50% -0.50%) -0.50% 0.00% 1 -0.50% (-0.4% -0.40%) -0.40% 0.00% 1 BB2012 W elfare -0. 74% (-0.88% -0.54%) -0.79% 0.18% 3 -0.74% (-0.81% -0.50%) -0.77% 0.15% 6 Spr2012 W elf are -0.51% (-0.54% -0.44%) -0.54% 0.06% 3 -0.51% (-0.42% -0.36%) -0.38% 0.03% 3 Boh2012-3 W elfare -0.69% (-0.69% -0.69%) -0.69% 0.00% 1 -0.69% (-0.66% -0.42%) -0.56% 0.08% 9 Mat2009 W elfare -0.60% (-0.60% -0.60%) -0.60% 0.00% 1 -0.60% (-0.50% -0.40%) -0.50% 0.04% 5 McKW2009 GDP -0.60% (-0.60% -0.60%) -0.60% 0.00% 2 -0.60% (-0.60% -0.60%) -0.60% 0.00% 2 Win2011 W elfar e -0.92% (-0.92% -0.92%) -0.92% 0.00% 1 -0.92% (-0.90% -0.79%) -0.87% 0.04% 4 BabR2005 W elfar e -0.41% (-0.41% -0.41%%) -0.41% 0.00% 1 -0.41% (-0.32% -0.32%) -0.32% 0.00% 1